
Don’t miss our next trade idea. Get on the Bear Traps Report Today, click here
Party like it’s 1999…
“There’s nothing in this world, which will so violently distort a man’s judgment more than the sight of his neighbor getting rich,”
JP Morgan, After the Panic of 1907
Peak Price to Sales Ratio
Tech in 2000
CSCO Cisco: 31x
QCOM Qualcomm: 29x
MSFT Microsoft: 25x
INTC Intel: 14x
Renewables in 2020
PLUG Plug Power: 52x
NIO Nio Inc: 30x
ENPH Enphase Energy: 29x
TSLA Tesla: 19x
Renewable froth, memories of the dot-com boom.
Price to Sales in Growth Equities

Not only are renewables trading at sky-high valuations, but price to sales ratios in growth stocks as a whole are now above their 2000 peak.
Renewables Quarterly RSIs (Relative Strength Index)
ENPH: 96.8
DQ: 89.8
SEDG: 89.5
PLUG: 88.6
Tech Quarterly RSI 2000 Peak
CSCO: 98.5
QCOM: 97.8
TXN: 92.8
INTC: 92.3
ENPH Enphase Energy
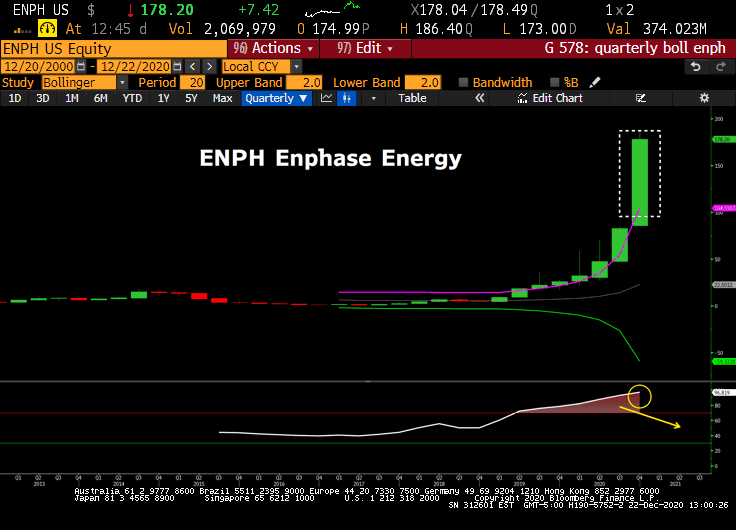
The solar panel manufacturer, Enphase Energy, has a quarterly RSI (Relative Strength Index, momentum indicator) of 96.8, one of the highest readings we could find today. Historically when a quarterly candle is this far above its upper bollinger band (purple) it is hard for a stock to maintain its strength, however, with a quarterly RSI of nearly 97 it’s even more challenging. We see meaningful downside in Q1 for this heavily overbought stock.
Renewables Monthly RSIs
PLUG: 95.3
DQ: 92.5
ENPH Enphase Energy: 88.6
SEDG Solar Edge: 87.9
Tech Monthly RSIs 2000 Peak
QCOM: 98.1
TXN: 93.9
CSCO: 93.4
INTC: 82.7
TXN Texas Instruments Monthly RSI Pop in 2000

Overall, the monthly/quarterly RSIs in the renewable energy space look very similar to tech in the dot-com boom…
Lessons From Cisco
Out of dozens of stocks back in 2000, the highest RSI we could find on a quarterly basis was CSCO at 98.5, only slightly higher than ENPH’s current readings of 96.4.
Despite becoming a very successful company over the past twenty years, now employing over 80,000 people, CSCO is still -45% below its 2000 peak!
The important thing to remember is when equities become this overbought on a long-term technical basis, they are pricing-in DECADES of success. Everyone knows renewables are the future of power-generation, that does not mean these valuations are sustainable in the near-term.
PLUG Plug Power Monthly RSI Above 95
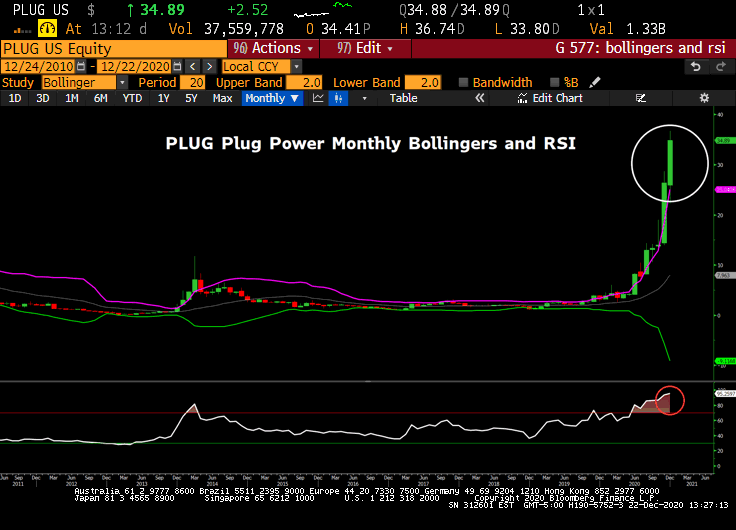
There is unsustainable momentum in high-flying renewable names on a monthly and quarterly basis. When considering we are currently running into month-end / quarter-end, this means January will open with new candles very over-stretched on a technical basis. In our view, this speaks to heavy downside risk in Q1 in the renewable space, RSIs above 95 are very very rare.
RSI Divergence
Any trader experienced with technical analysis will tell you RSI works best when there is price and momentum divergence. As a bearish indicator this means RSI is well BELOW its highs while price is HIGHER. Despite RSI at the highs (blow-off tops) in many renewable and technology equities, this bearish divergence is occurring in the most important equity index in the world – the S&P 500.
S&P 500 Quarterly RSI Divergence
Just like the dot-com peak, the quarterly RSI in the Index has been fading lower for a few years (loss of momentum), while the S&P 500’s price has hit new highs, this is MEANINGFUL bearish divergence. In our view, we are close to a long-term top.
Apple Quarterly Bollinger Insanity
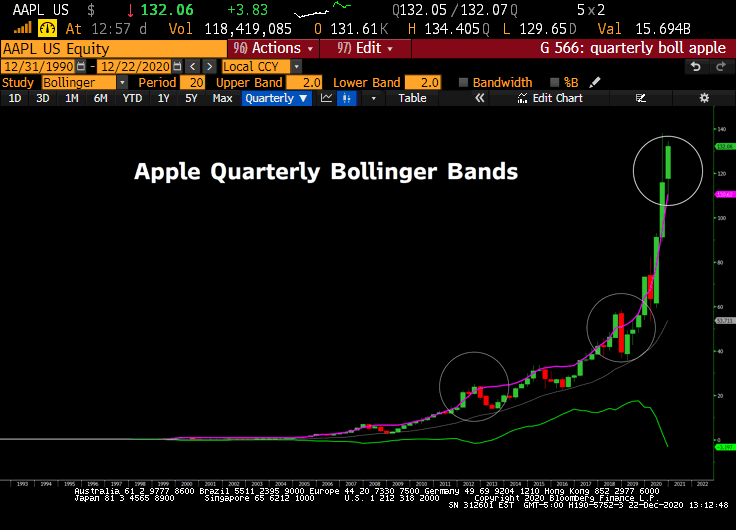
While US equity indexes (and even some non-US equity indexes are over-stretched using quarterly bollinger bands, in some single name equities the over-heating is severe. Namely, Apple and some other volatile tech names like AMD were some of the most extreme examples we could find. Importantly, these all speak to meaningful downside in the first quarter of 2021, especially if we rally into year-end.
Nasdaq Quarterly Bollinger Bands
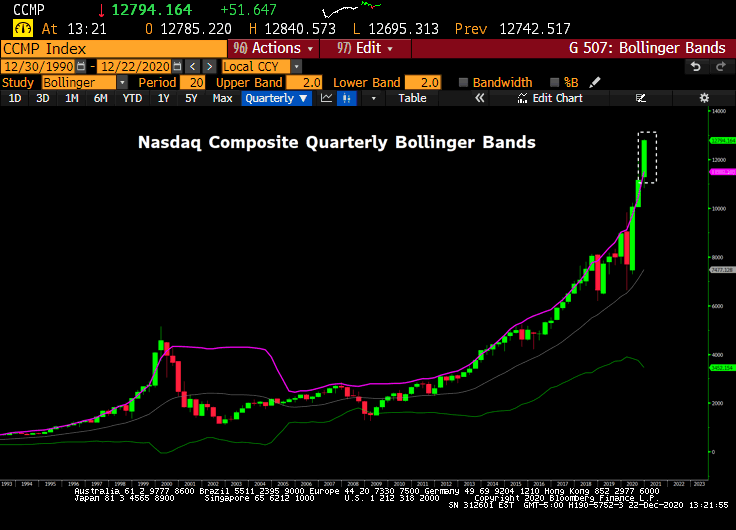
On a quarterly bollinger band chart, this quarter’s candle is meaningfully extended over the upper bollinger band across US indexes, especially the Nasdaq. Historically, it is hard for equities to maintain their technical strength above this upper band. The nasdaq currently sits 11% above the upper bollinger band, this is the largest spread since the dot-com peak.
TAN Solar ETF Spread Above the 200 DMA
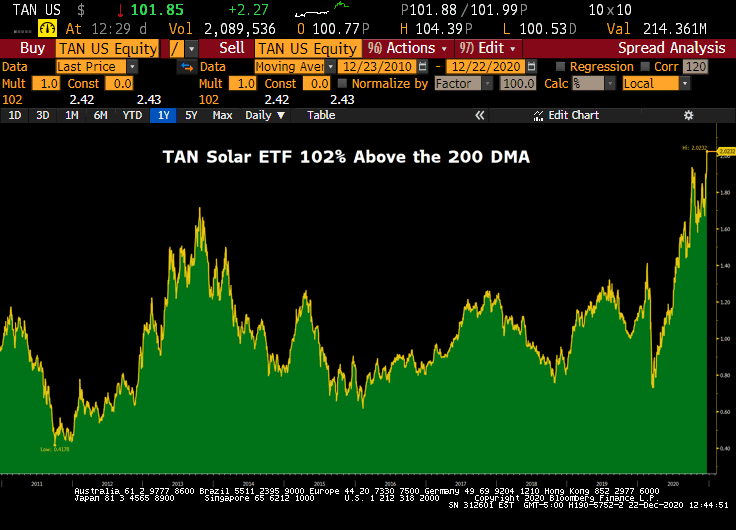 The TAN Solar ETF is now 102% above the 200 day moving average, the largest spread in the ETF’s history.
The argument in 2019: Big tech is not a 1999 bubble because of underlying profits. Now, we have a whole host of tech, renewable, and EV plays with no profits and a colossal newly minted valuation up-take since October 1st.
Don’t miss our next trade idea. Get on the Bear Traps Report Today, click here
