Russian Equities on Key Technical Level

Join our Larry McDonald on CNBC’s Trading Nation, Wednesday at 3:05pm ET

Pick up our latest report here:

Don’t miss our next trade idea. Get on the Bear Traps Report Today, click here


Media stories are countless – President Donald Trump has acted more friendly toward Russia and Russian president Vladimir Putin.  We must ask, why are Russian equities down 4% in 2017, 10% off their recent highs?  It’s clear, the stress the White House is experiencing over its relationship with Russia is weighing on Russian equities.  There were very high hopes  the Trump administration could be more willing to roll back sanctions placed on Russia in response to its actions against Ukraine (Circa 2014-15).

Of course, oil’s 2017 headwinds have played a key role here, much of Russia’s economic activity is centered around crude.  Energy is by far the largest sector weight in the RSX.  It’s no secret, Russia is one one of the world’s largest non-OPEC producers.

Russian Equities

RSX newOnce up 86% from the January 2016 lows, Russian equities have lost 10% from their recent highs.  Down 4% on the year but stull up 14% since the election of Donald Trump – in line with the S&P 500.  This descending wedge above speaks to a key technical level Russian equities are dancing on – we’re about to see a significant move…

Price to Book Value: iShares MSCI Russia Capped ETF 

2017: 0.78x
2016: 0.67x
2015: 0.72x
2014: 0.51x
2013: 0.71x
2012: 0.85x
2011: 0.80x
2010: 0.75x
2009: 0.41x
2008: 1.9x
2007: 3.1x

Bloomberg, Bear Traps Report data

Pick up our latest report here:

Don’t miss our next trade idea. Get on the Bear Traps Report Today, click here


Facebooktwittergoogle_plusredditlinkedintumblrmail

Facebooktwitterrssyoutube

A Real Political Crisis in Brazil

Join our Larry McDonald on CNBC’s Trading Nation, Wednesday at 3:05pm ET

Pick up our latest report here:

Don’t miss our next trade idea. Get on the Bear Traps Report Today, click here


*BRAZIL GOVT ALLIES SAID TO SEEK TEMER RESIGNATION: GLOBO
*TEMER UNLIKELY TO FINISH HIS TERM IF ALLEGATIONS TRUE
*TEMER LOST CONDITIONS TO NEGOTIATE PENSION REFORM
*BRAZIL ’21 EUROBONDS SLUMP MOST ON RECORD AMID POLITICAL CRISIS


We spoke to our analysts in Washington overnight – we’re in contact with our relationships on the ground in Brazil.  Setting up client calls today:

Brazil Erupts as Tapes Could Ruin Temer Presidency

In Cooperation with Analysts at ACG Analytics

Globo news, an internationally respected Brazilian network and news franchise, is reporting that the Chairman of JBS, the world’s largest meat company, has taped weeks of conversations with President Temer involving pay-offs to prevent imprisoned house speaker Eduardo Cunha from testifying in the Operation Car Wash scandal.

Brazilian equities have surged over the past year as Temer’s administration forged on an ambitious reform program that cheered investors. Brazilians, however, are overwhelmingly opposed to his austerity measures and the president’s approval rating hovers at around 11%.

Equities in Brazil

ewz newUp 132% from the January 2016 bottom, stocks in Brazil have priced in a ton of political goodwill.  The EWZ is set to open at the $34.20 – $34.50 level, below the two year trend line above in red.

We believe the administration’s economic team is highly concerned the crisis will impact their reform agenda. The government has been positioning their long awaited, and very controversial pension reform proposal to the lower house of Congress.  Equity prices / valuations are very dependent on completion / passage of these reforms.

Credit Risk Rising

Brazil 2021 newIn our view, credit risk will surge focused on Brazil’s government bonds if the reforms collapse.

Pick up our latest report here:

Don’t miss our next trade idea. Get on the Bear Traps Report Today, click here

The JBS CEO Josely Batista reportedly taped Termer ordering the executive to “keep up” the payments in one of the recordings, which are said to be damning throughout.

Several weeks of recordings have reportedly been delivered to the
Attorney General’s office while opposition lawmakers are calling for the president to resign immediately.  If this occurs, the Brazilian Constitution requires that elections be held within ninety days.

Dollar – Real Heading North

real new

Technically, the real is moving to far weaker ground – a print above 3.21 shifts the currency into a new bear market.

Per our friends at ACG Analytics, if Temer resigns or otherwise leaves office the Brazilian Constitution requires elections within ninety days.  Brazil had been emergencing from it’s worst recession and consensus had been slowly but appreciably growing for Temer’s market based economic reform agenda.

From ACG Analytics in Washington

The corruption crisis in Brazil has left scorched earth where there
were political parties.  Initial thoughts include increased attention toward Mariana Silva, a candidate of the left who surged in the 2014 elections but ultimately missed the second round vote.  If she is not tainted by scandal, her stock certainly goes up.  Brazil’s small but vocal hard right will receive attention as its calls for “cleansing” Brazilian politics through the instatement of military rule could resonate in some quarters.

Pick up our latest report here:

Don’t miss our next trade idea. Get on the Bear Traps Report Today, click here
Facebooktwittergoogle_plusredditlinkedintumblrmail

Facebooktwitterrssyoutube

U.S. Dollar, a Key Technical Break

Join our Larry McDonald on CNBC’s Trading Nation, Wednesday at 3:05pm ET

What’s Our List of Systemic Risk Indicators Saying now?  Pick up our latest note here:

Don’t miss our next trade idea. Get on the Bear Traps Report Today, click here

Updated May 20, 2017 at 6am

We’ll have a note out later today, but this is a BIG story.  The U.S. dollar has broken its five year trend line.  Across Wall St., lofty 2017 dollar estimates are coming down fast.

“In light of the high degree of uncertainty around the outcome of the (Comey – Trump – Russia) investigation—and the likelihood that it will consume policymakers’ time and energy for some months—the prospects for progress on the Administration’s economic agenda, at least over the near-term, look quite dim. We recently revised down our forecasts for the trade-weighted US dollar, but the latest developments in Washington have introduced additional downside risks. A longer-than-expected period of political uncertainty would likely reduce the likelihood of fiscal stimulus and other dollar-positive aspects of the Trump agenda, with possible implications for Fed policy as well. Until the fog clears, we expect that the dollar will struggle to find its footing.”

Goldman Sachs, May 17, 2017

Impact of the Fed?

Wall St’s calling for 2-3 more rate hikes this year, seven over the next two years – but Mr. DXY says no way Jose.  The ultimate barometer for the Trump trade (tax cuts, infrastructure and deregulation) is signaling a major warning.

Our Dollar Call from May 3rd

Dollar New 3This image was produced on May 3rd and included in our Bear Traps Report, 95 target highlighted above with the DXY at 99.08 then.

U.S. Dollar, a Key Technical Break

DXY TrendThe dollar closed at 97.14, breaking a key technical level this week.

Four Significant Catalysts

  1. Trump’s agenda in Washington is at Risk – So Are the Fed’s Beloved Rate Hikes.

    This is a BIG Technical Break in the U.S. Dollar, political risk in the USA is surpassing that of Europe

    Is this Drama in Washington Impacting the Legislative Time Line?  The simple answer is yes.  Every minute that legislative and executive branches of the US government are focused on Comey-Russia is a minute wherein the tax bill, infrastructure, trade negotiations – homeland investment act or change to Medicare is not being debated, scored and advanced. Investors bought the dollar because Trump’s policies were going to be good for the greenback; without Washington’s legislative goodie bag (tax cuts – fiscal stimulus) we’re just looking at high drama on the world’s most important stage.

    2. Equity valuations in Europe (Euro is surging, highest since November) are playing catch up with the U.S., as the President’s growth agenda still sits in stall mode – investors globally are reaching for alpha in Europe.

Stocks in 2017

S&P 500: +7.9%
Euro STOXX 50: +11.1%
MSCI Europe: +16.8%

3. Credit risk on the consumer side is surging in North America at the fastest pace since the financial crisis; commercial real estate / REITS, auto loans, credit cards, student loans are all experiencing a significant rise in delinquencies and late payments – as a result, banks and financial institutions are pulling back lending.  The U.S. dollar is responding to economic risks and moving lower.  Likewise, an extremely low core CPI print relative to very high expectations is pushing down bond yields in the USA.  We still see 2% before 3% in 2017 on U.S. 10s, our long held position.

4. Jack Welch was Right?

U.S. Stats Officials Say Measurements of GDP, Inflation Are Off

Looking at the personal consumption component of GDP, the authors find that price measures likely show an overstatement of 0.2 percentage point in 2000, rising to 0.26 percentage point in 2015.

Combined with some bogus measurement of quality changes in computer and software investment, the total effects would mean GDP growth is understated by a bout 0.4 percentage point for 2000, 2005, 2010 and 2015, according to the new paper.

What’s Our List of Systemic Risk Indicators Saying now?  Pick up our latest note here:

Don’t miss our next trade idea. Get on the Bear Traps Report Today, click here
Facebooktwittergoogle_plusredditlinkedintumblrmail

Facebooktwitterrssyoutube

Ugly Divergence

Join our Larry McDonald on CNBC’s Trading Nation, Wednesday at 3:05pm ET

What’s Our List of Systemic Risk Indicators Saying now?  Pick up our latest note here:

Don’t miss our next trade idea. Get on the Bear Traps Report Today, click here

The news headlines sound terrific:

“The S&P 500 climbs above 2,400 for the first time.” 

U.S. stock indexes rose to new highs as a rally in crude and dollar weakness sparked gains in commodities producers. Emerging-market assets jumped and Treasuries slid.

On the other hand, beneath the surface there’s an ugly divergence.  Only 58% of NYSE stocks are above their 200 day moving average today compared to more than 72% in February.   This is the lowest reading since October and a sure sign of a very tired bull (market).

FACT: More and More Equity Market “Bulls” are Hiding Out in Fewer Stocks

Bottom line, 26% of the market is controlled by the top 15 stocks, there’s $5T of market capitalization in just those names.  So when Apple AAPL, Google GOOG and Amazon AMZN march high, indexes like the S&P 500 which are market cap weighted don’t tell us the whole story.  Not even close.

Percentage of NYSE Stocks above their 200 Day Moving Average

TRADPAUS newThe Nasdaq 100 is up 18% on the year while the Russell 2000 is only 2% higher.  Forget about the noisy headlines, the truth is MORE and more stocks are being left behind in this bull market. 

What’s our List of Systemic Risk Indicators Saying now?  Pick up our latest note here:

Don’t miss our next trade idea. Get on the Bear Traps Report Today, click here
Facebooktwittergoogle_plusredditlinkedintumblrmail

Facebooktwitterrssyoutube

A Counter Trend Rally

Join our Larry McDonald on CNBC’s Trading Nation, Wednesday at 3:05pm ET

What’s Our List of Systemic Risk Indicators Saying now?  Pick up our latest note here:

Don’t miss our next trade idea. Get on the Bear Traps Report Today, click here

Oil is on a roll. WTI is up 12.4% from the May 5th lows while Brent 12.1% higher in a  beautiful counter trend rally.

“We’re getting a solid capitulation reading in our seven factor model today focused on the oil space.   We recommend buying into capitulation today.”

The Bear Traps Report Trade Alert, May 4, 2017

Higher oil prices, infer higher inflation, which should drive interest rates higher.  Typically, 5 year break-evens track this spread and move higher (break-evens help market participants measure inflation expectations).   However, so far today rates are broadly stuck near their post CPI lows from last week.  This speaks to the large bid for bonds.  It looks like rates will want more time to assess the quality of these production cuts.  The market wants to see if there is a more meaningful impact on oil exports, which have not really slowed from OPEC countries post the November deal.

Oil, Rates and the Fed

File_000 (2)

The front end of the oil futures curve has surged (orange line above)  relative to 2019 pricing contracts.  What does backwardation mean for rates and the FOMC?  What we have seen since the November output cuts from OPEC, US inflation expectations move in close lockstep to oil prices, but more importantly, the structure of the oil curve. Following the news that Russia and Saudi Arabia are willing to extend the current cuts by nine months, the calendar 18 brent spread went back into backwardation.

What’s Our List of Systemic Risk Indicators Saying now?  Pick up our latest note here:

Don’t miss our next trade idea. Get on the Bear Traps Report Today, click here
Facebooktwittergoogle_plusredditlinkedintumblrmail

Facebooktwitterrssyoutube

“Subprime is Contained”

Join our Larry McDonald on CNBC’s Trading Nation, Wednesday at 3:05pm ET

What’s Our List of Systemic Risk Indicators Saying now?  Pick up our latest note here:

Don’t miss our next trade idea. Get on the Bear Traps Report Today, click here

Blog Updated May 20, 2017 at 4:10pm


Nominal Residential Property Prices

2007-2017

China: +155%
Canada: +82%
Australia: +74%
Norway: +72%
Sweden: +70%
USA: -4%

BIS Data, NY Fed

China’s impact on global property prices is colossal.  Massive – debt build funded infrastructure spending pumped up commodity prices globally.   Shadow banking leverage in China helped pump up commodity prices 2010-17.   This had a substantial follow-on impact on Canada, Norway and Australia real estate prices (these countries are oil and materials rich).  Likewise, $1T of currency outflows from China had to go somewhere, likely into real estate markets globally, hello Vancouver.  Since 2007, U.S. real state prices are down slightly while property markets in some other G10 economies experienced no such downturn.  The side effects of easy money central bank policies are visible here.  Even with the global recession: prices, building activity, and mortgage credit continued to rise in fierce fashion. In several instances, the run-up has gone far enough that it has raised concerns about the broader consequences for economic and financial stability if real estate markets were to sour. While prices are extremely overvalued in several markets, there are also important differences across countries, and some important idiosyncratic factors to take into account.   Bottom line; leverage, China and commodity prices have had a heavy hand in this disconnect. 

A Look Back and a Look Forward

“Subprime is contained”

Federal Reserve’s Ben Bernanke, Spring of 2007

“Subprime is contained”

Bank of Canada’s Stephen Poloz, Spring of 2017

Almost ten years to the day, history is repeating itself – right in front of our very eyes.  It was the spring of 2007, New Century had just gone bust.  The subprime mortgage lender was the biggest story on Wall St., and when reporters finally got ahold of Federal Reserve Chairman Ben Bernanke, he did what all central bankers do on the eve of a credit crisis – try and keep investors calm.

“At this juncture, however, the impact on the broader economy and financial markets of the problems in the subprime market seems likely to be contained. In particular, mortgages to prime borrowers and fixed-rate mortgages to all classes of borrowers continue to perform well, with low rates of delinquency.”

Ben Bernanke, March 28, 2007 

Ten years later, almost to the day – Central Bankers in Canada are singing Bernanke’s song.  After Home Capital Group’s stunning collapse last month, investors have been told Mortgage lender’s problems won’t spread to other financial institutions.  The Bank of Canada Governor Stephen Poloz told Globe & Mail in an interview this weekend.  “Home Capital crisis is contained and doesn’t threaten broader market.”

In 2007, our Larry McDonald led a team at banking over $150m in profits betting against New Century and other subprime lenders.  He has an entirely different perspective.

“The truth is very elusive as you’re heading toward that giant iceberg, the Captain wants those fannies in the seats.  Believe half of what you see and none of what you hear.”  McDonald said.

We believe the credit cycle has turned in North America, whether you’re looking at Mall Reits, credit card receivables, auto or student loans – defaults are spiking at an alarming rate.  Fasten your seatbelts ladies and gentlemen.

“Risk is most dangerous when it is least apparent, and least dangerous when it is most apparent.”

Jim Grant

Canada’s Subprime Lending King

HCGMoody’s downgrade of Canada’s biggest banks beat down assets in a market already rattled by woes of mortgage lender Home Capital Group Inc. Yet, very similar to 2007 – most analysts say this isn’t evidence of an impending crisis. Investors are concerned that Home Capital’s troubles can lead to broader financial contagion, tipping Canada’s economy into the kind of crisis it averted in 2008. 

What’s Our List of Systemic Risk Indicators Saying now?  Pick up our latest note here:

Don’t miss our next trade idea. Get on the Bear Traps Report Today, click here

Still, home prices are at “the top of our list” of issues that could threaten Canada’s financial system, Poloz said. Poloz didn’t rule out the possibility of providing an emergency loan to Home Capital but stressed the need for a private solution to the co.’s issues.

Poloz trusts private system to continue stepping in to support Home Capital.

What’s Our List of Systemic Risk Indicators Saying now?  Pick up our latest note here:

Don’t miss our next trade idea. Get on the Bear Traps Report Today, click here

Here’s Another Classic:

Merv King

Facebooktwittergoogle_plusredditlinkedintumblrmail

Facebooktwitterrssyoutube

A Noble Effort

Join our Larry McDonald on CNBC’s Trading Nation, Wednesday at 3:05pm ET

What’s Our List of Systemic Risk Indicators Saying now?  Pick up our latest note here:

Don’t miss our next trade idea. Get on the Bear Traps Report Today, click here

Singapore company involved in coal and funded by global yield hungry investors.  Has $3.3 billion net debt and makes $125 million negative cash flows.  Only hope was President Trump buying all that coal.  The company reported a quarterly loss of almost $130 million – won’t return to profitability until at least 2018-2019.

Leverage on Leverage

NobleThis is the beginning of a colossal commodity driven credit collapse. Central bank funded moral hazard gone rogue! May 15th, Noble Group Limited Cut To Caa1 From B2 By Moody’s: “Downgrade reflects heightened concern over Noble’s liquidity stemming from its weak operating cash flow and large debt maturities over the next 12 months, Moody’s says. Moody’s also cites significant uncertainties over an operational turnaround and the high likelihood of debt leverage remaining elevated after company reported 1q loss.  Outlook remains negative.”

  • Validity of any recovery estimate would be based largely on where the assumptions regarding fair value of the contracts are at, which is a difficult task given the disclosure levels –  Citi
  • Recovery rate on Noble’s senior unsecured debt at between 47 cents and 83 cents depending on the discount rate assigned to its assets – Nomura

All part of our Lehman 10th anniversary book, coming Sept 2018.

Much of the leverage build out in the global commodity space comes from the colossal banking system in China relative to the country’s economy.

Bank China
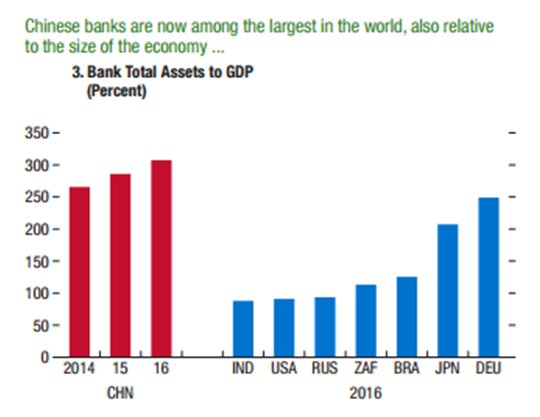
China’s banking system and underlying economy is far more leveraged than her global peers.

China’s Share of Global Refined Copper Consumption

2020: 42.8%*
2017: 46.2%
2010: 37.7%
2000: 10.4%
1990: 8.1%

*Forecast

Wood Mackenzie data

The tailwind from China is rolling over as they de-lever.  The gravy train is not making its next stop. From 1990 to 2015, Chinese consumption of refined copper increased from 622kt to 10.6mt, explaining nearly 92% of the total growth in global copper demand. Looking ahead, the growth in the Chinese demand for industrial metals is likely to be much more muted, also contributing to lower commodities returns relative to historical experience.

China 5 Year Credit Default Protection

China 5 YearThe insanity of the current global credit profile is on display right here.  If you want to buy default protection on the MOST levered economy on the planet earth, its very cheap.  This reminds us of Citigroup in 2007, default protection was extremely cheap relative to the underlying credit risk, investors didn’t care.  History is repeating itself RIGHT before our very eyes.

Facebooktwittergoogle_plusredditlinkedintumblrmail

Facebooktwitterrssyoutube