
Join our Larry McDonald on CNBC’s Trading Nation, Wednesday at 3:05pm ET
“There is a disconnect between the Trump stimulus execution risk and how far we’ve come in terms of expectations. An actual fiscal boost is more than 12 months away in reality, Obamacare took well over 300 days to land on the President’s desk while the Dems controlled the House, Senate and the White House. As much as well all want to believe Mr. Gridlock is dead, he’s still breathing. As we head into 2017, gold miners, bonds, gold miners and utilities continue to be our favorite options as the street has unanimously bought into the “reflationary trade” narrative.”
The Bear Traps Report, January 5, 2017
Pick up our latest note here:
Don’t miss our next trade idea. Get on the Bear Traps Report Today, click hereTreasury Bond Gurus Blindsided Again as Reflation Trade Falters
Ten-year yield forecasts are off by the most since September.
Guggenheim’s Minerd sees rising odds of 10-year yields at 1.5%.
“In recent years, the overwhelming problem with bond market prognostications from U.S. economists is they’re far to wedded to their craft. Bond prices are manufactured by political risk and global systemic risk, substantially more so than economic data. We have a whole army of economists with their eyes on the wrong ball.”
The Bear Traps Report’s Larry McDonald, April 25, 2017
It’s never been easy being a bond-market prognosticator. But while history is strewn with botched calls and embarrassing revisions, 2017 is shaping up to be Not only is there the Federal Reserve to worry about, but also a new U.S. administration struggling to enact its pro-growth policies and geopolitical risks from elections across Europe to saber rattling in North Korea.
Perhaps that’s why on Wall Street, consensus estimates for the direction of Treasuries are proving to be so off the mark.
Strategists and economists were blindsided by the five-week rally in Treasuries, which left the gap between their forecasts
for the end of June and the actual 10-year yield at the widest since September. In theory, they’d converge as the date draws
closer.
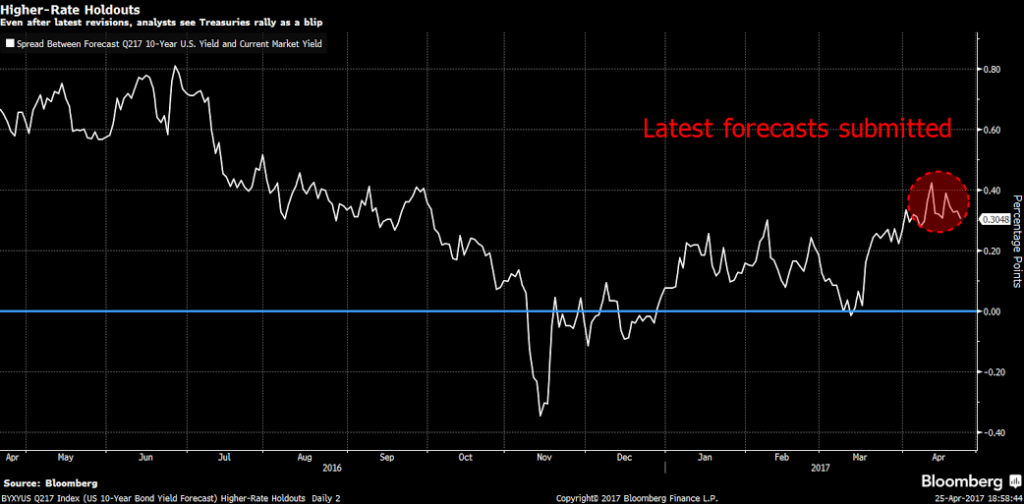
To some, the disparity reflects a growing sense that traders in the Treasury market are giving up, at least for now, on the so-called reflation trade that was all the rage in the wake of Donald Trump’s election victory in November. “I don’t know that the words ‘confident’ and ‘yield forecasts’ belong in the same sentence,” said Richard Moody, chief economist at Regions Financial. “Our forecasts have been based on where the market was, which is how you have to do it, but we’ve been saying since the day after the election that people need to slow down in terms of what they’re expecting.”
Moody, who called for the 10-year yield to end the quarter at 2.71 percent in March, dropped his forecast to 2.46 percent on April 13.
Lower for Longer
Higher yields have been a core component of the reflation trade, which was pinned on expectations of faster growth and inflation, as well as tighter monetary policy by the Fed and other central banks. Ten-year yields more than doubled from their all-time low in July to 2.63 percent on March 14. Since then, yields have retreated, falling victim to some of the same trends that led to the pervasive idea that rates would stay lower for longer. They ended at 2.27 percent on Monday.
Pick up our latest note here:
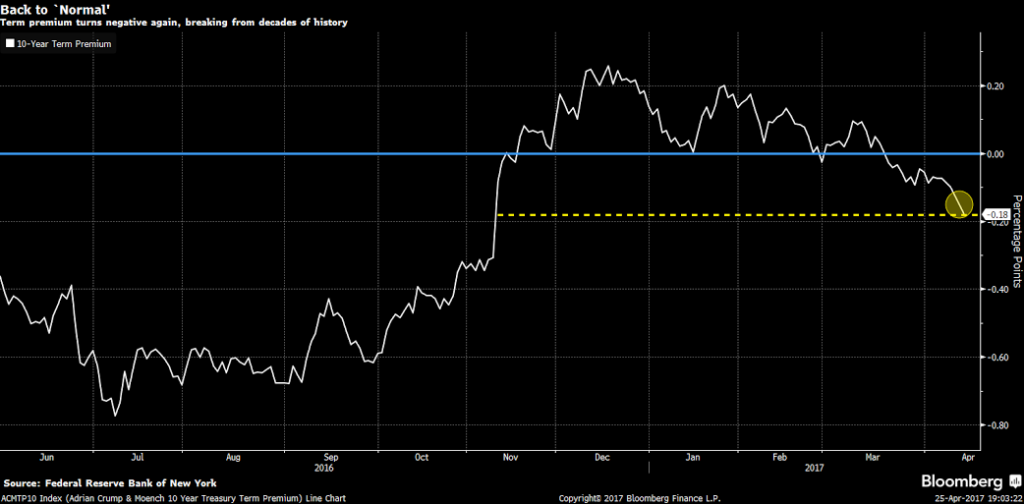
Don’t miss our next trade idea. Get on the Bear Traps Report Today, click hereThat view is reflected in something called the term premium. As its name suggests, the metric should normally be positive and has been for almost all of the past 50 years. Yet it’s back in negative territory — an anomaly that first emerged as a result of the Fed’s quantitative easing — suggesting investors can’t see any risks on the horizon that would push yields higher.
“We’re acknowledging that the term premium will stay lower than we thought,” said Paul Ashworth, chief U.S. economist at Capital Economics. The firm reduced its June forecast by a half-percentage point to 2.5 percent, the biggest cut among those in
the latest Bloomberg survey. “The market is not convinced that the Fed is going to follow through or the economy is going to be strong.”
Mark Kiesel, Pimco’s chief investment officer of global credit, disagrees and says investors are underestimating the Fed’s intent to raise rates.
Coin Flip
“The market is wrong in terms of only pricing one hike this year and a little over one hike next year,” he said. “The Fed is going to do more than that.” Indeed, futures traders are pricing in just one more increase this year, likely in September.
Scott Minerd says the low-yield camp will ultimately prevail. Minerd, who co-manages the $5.7 billion Guggenheim Total Return Bond Fund, said the odds have risen that yields will fall to 1.5 percent over the next several months. As of Feb. 28, the fund’s largest holding was the principal portion of a stripped Treasury bond due in 2044, among the most profitable to own as rates fall.
Pick up our latest note here:
The outlook for inflation suggests that there’s no need for
the Fed to rush. Bond investors see little chance that U.S.
consumer prices will rise more than 2 percent a year, on
average, over the next three decades. The reading is close to
the lowest since November.
“We’re seeing a lot of signs that inflation is not picking
up,” BlackRock Chief Executive Officer Larry Fink said on
Bloomberg Television last week. “There’s a 51 percent
probability that the 10-year Treasury can go below 2 percent.”
Pick up our latest note here:
Don’t miss our next trade idea. Get on the Bear Traps Report Today, click here

 Across the board, risk on assets are moving higher, risk off assets lower.
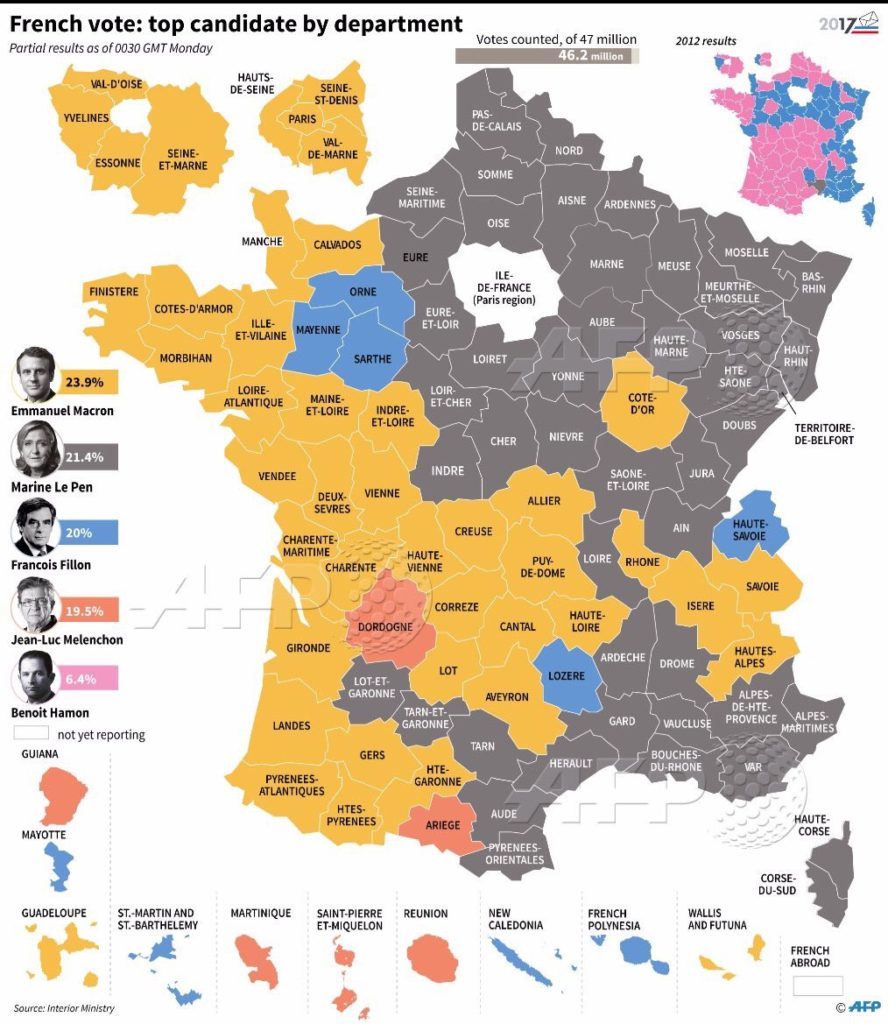
 The euro surged against the dollar after the initial count of ballots in the first round of the French election showed that entrist Emmanuel Macron and the National Front’s Marine Le Pen were on a path to reach next month’s run-off. Euro moved to highest since November; trimmed gains as hedge funds fade the rally, now 1.8% higher to $1.0919.
 The Trump trade has some life left. We recommended clients short bonds last week in our Bear Traps Report, pick up our latest – click on the link below.
 CPI M/M -0.3%, Exp. 0.0%
 The decline — reflecting cheaper motor vehicles, wireless phones services and apparel — interrupts a recent pickup in inflationary pressures. Businesses have been regaining some pricing power on the heels of improving global demand and steady sales in the U.S. The Federal Reserve’s preferred gauge of inflation, a separate figure that’s based on what consumers purchase, exceeded its 2 percent goal in February, though some officials focus on the measure excluding food and energy, which is still below their target. The year-over-year gain in the March core CPI was the smallest since November 2015. – Bloomberg reported
 First-round support for French presidential election candidate Emmanuel Macron declined by 1 percentage point from yday to 22% while support for Jean-Luc Melenchon remained stable at 17%, according to daily Opinionway poll results published today.
 The cost of default protection on South Korea rose to the highest level since July on the surge in geopolitical nerves. S. Korea’s stock loans for short-selling hit record high amid the tensions.
  Now translated into 12 different languages, our New York Times bestseller is a perfect gift for that college student.
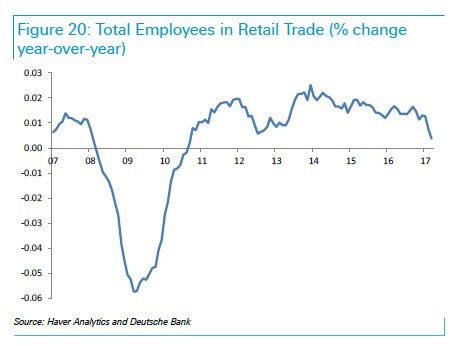 This is a profound secular change in the retail shopping experience, no one has a clue where it’s going to stop.
