Join our Larry McDonald on CNBC’s Trading Nation, Wednesday at 3:05pm ET
Pick up our latest report here:
Don’t miss our next trade idea. Get on the Bear Traps Report Today, click here
Stocks Down, Bonds Down
Something occurred in markets this week that’s been very hard to find over the last twenty years. It was the last straw and triggered an avalanche of selling. Our awareness MUST be high around positive correlation, let’s explore.
QQQ Nasdaq Historic Volume
 Just five FANG (Apple 13%, Amazon 11%, Microsoft 10%, Alphabet 9%, and Facebook 5%) stocks make up 48% of the QQQ ETF. We witnessed record capitulation volume on Thursday, an 11% draw-down in just six trading days, that’s nearly $700B wiped out across 605 ETFs and funds.
Recent Drawdowns and Rotation
Facebook -31%
Netflix -25%
FANG Index -20%
Amazon -17%
Google -17%
Banks XLF -14%
Russell 2000 IWM -13%*
Dow Transportation -11%
Nasdaq 100 NDX -11%
US Treasury Bonds -11%****
Apple -9%
S&P 500 -8%
US Investment Grade Corporate Bonds LQD -9%*****
Oil USO -8%
DJIA -7%
Staples XLP -6%**
Gold Miners GDX +14%***
*Now flat since Nov 2017
**Up 7% since early May
***Last 35 days
****iShares 20+ Year Treasury Bond ETF, Dec 15 to Oct 8 drawdown
*****iShares iBoxx Investment Grade Corporate Bond ETF
A Shift from Negative to Positive Correlation in Stocks and Bonds
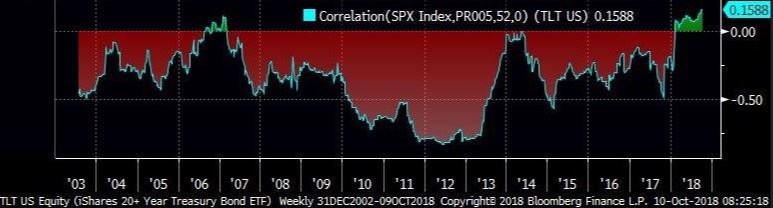 In the past 3 years, there have only been 14 trading days (including today) in which the S&P 500 (SPY) was lower more than 1% and U.S bonds (TLT) were also lower on the day. Keep in mind, eight of these 14 occurrences took place in 2018 alone. Today, stocks are bonds are wearing a very rare positive correlation. Above, see the negative correlation period (stocks DOWN vs. bonds UP) in red and the positive correlation period (stocks DOWN vs. bonds DOWN) in green. This is one of the MOST important blogs you’ll read this month.
At the beginning of the year, we explored this dynamic in our report, “Paradigm Shift in Rates”
“We believe inflation is set to finally pick up in 2018. Much of the passive and quant-side to asset management has become heavily invested in the “risk parity” model which involves being long equities and bonds on a risk-adjusted basis. One of the fundamental problems with this strategy is you’re effectively really long disinflation. Sure, it has worked very well in the post great financial crisis period, but it’s a grossly crowded trade and has all the makings of a gruesome slaughterhouse. So in this case, the risk tail is a period where equities and bonds fall together, which is not that uncommon in a late cycle inflationary environment. Other than out of the money puts in rates (or the *ProShares UltraShort 20+ Year Treasury TBT – we are long with a 2/3 position), a big way for these guys to hedge inflation is to increase commodity exposure. Given the current market structure, the only commodity market really big enough to absorb that colossal bid is oil. This is not to say all the big money longs have this in mind, but it could make an extended long position in the oil patch more durable than usual. As long-time
bulls, we’re now ‘pounding the table’ bond bears for 2018.”
Bear Traps Report, January 2, 2018
Stocks and Bonds, Friends No More
The stock market crash wiped out $7.2T in shareholder wealth in 2008, but bonds delivered investors a $2.9T profit cushion, that’s NOT the case today. Here are five Things You Need to Know about Positive Correlation.
Today, your standard 60/40 portfolio (60% stocks vs. 40% bonds) isn’t hedging any risk. Why? Rising domestic yields (in the USA) continue to pressure equity valuations. We must always remember, a company’s future cash flows are discounted by higher bond yields. Just look at the Nasdaq, it’s off nearly 11% this month with HIGHER bond yields.
Regime Change: S&P 500 Total Number of Days with 3%+ Losses
2018: 3
2017: 0
2016: 0
2015: 2
2014: 0
2013: 0
2012: 0
2011: 7
2010: 5
2009: 13
Bloomberg data. Clearly, we’re in a new volatility regime today. In 2018, emerging markets, bonds, currency/forex and US equities have all scored a substantial surge in vol.
Investment Grade Corporate Bond Yield Surge
 In a classic side effect of global tightening in monetary policy, investment-grade bonds dramatically underperformed earlier in the year while equities largely ignored this early warning. As an asset class, investment grade US corporate bonds are far more sensitive to global (tightening) financial conditions. US equities finally woke up to these risks this week.
US Investment-Grade Bond Market, % BBB Rated
2018: 49%
2000s: 34%
1990s: 26%
*Today, there’s a colossal $2.5T of US corporate debt rated borderline Junk at BBB. That’s 3x levels seen a decade ago! We’re looking down the barrel of the mother of all default cycles. Bloomberg, Morgan Stanley data.
Correlation between Stocks and Bonds
2018: +0.16%*
2017: -0.51%
2016: -0.65%
2015: -0.73%
2014: -0.74%
2013: -0.82%
2012: -0.85%
2011: -0.84%
2010: -0.76%
2009: -0.45%
2008: -0.51%
*This is the first monthly positive correlation in a decade. We’ve witnessed nearly $2T in bond losses globally over the last 60 days, and now stocks are joining the plunge.
Rude Awakening
Across the country today, wealth managers are faced with a RUDE awakening. Clients are on the phone asking why their statements are in the red with stocks and bonds down together. For much of the last twenty years when stocks have sold off significantly, bonds have been the saving grace – not this time.
Number of Times, Stocks (S&P 500) have been Down and with U.S. 10 year bond Yields HIGHER (Bonds Down)
3 Weeks in A Row
2010-2018: 1
2000s: 3
1990s: 3
1980s: 19
1970s: 24
4 Weeks in A Row
1990-2018: 1
1980s: 4
1970s: 8
Deutsche Bank data
We must keep in mind that stocks and bonds were positively correlated for much of the 70’s, 80’s, and 90’s. In other words, in equity market drawdowns, bonds DID NOT offset the wealth destruction. Today, investors have become far too complacent around their assumptions that bonds will bail out stocks at all times, THIS IS NOT THE CASE.
Regime Change
In a regime change, a period where stocks and bonds move lower together, the flight of assets out of passive bond / risk parity strategies will be ferocious. Click here to get a peek at our winners in this new regime.
VIX Spikes above Twenty vs. US 10 Year Bond Yield
Oct 2018: 3.21%
Mar 2018: 2.76%
Feb 2018: 2.81%
Nov 2016: 2.29%
Jun 2016: 1.37%
Feb 2016: 1.68%
Sep 2015: 1.97%
Jan 2015: 1.67%
Oct 2014: 1.90%
Jan 2014: 2.57%
Oct 2013: 2.50%
Bloomberg data
Stocks Down, Bonds Down
 Think of the dentist in Cleveland, Ohio with $1M in stocks and $1M in bonds in a portfolio. For the first time in 30 years, he / she is looking at their brokerage statement and seeing NO wealth destruction OFFSET from bonds. We have an eye on credit quality globally (AAA rated corporates / sovereign credits are off 30-40% in terms of the amount of high-quality paper last 10 years). Next, shift your eyes on the debt to GDP in the G20, up from 70% to near 100% (maybe 110%). Then look at the EM dollar-denominated debt issued 2007-2017, in the trillions, there’s a new player at the table trying to sell / refinance a large debt load. All this speaks to a regime change, we’re in the 1-2 inning we believe, more to come.
Largest US Equity Market Wealth Destruction
2008: -$10.5T
2015: -$4.5T
2011: -$3.7T
2018: -$3.2T**
2010: -$2.4T
*Last 10 years, Bloomberg US Market Capitalization data.
**only instance in the last 18 years where bonds also lost value. In the 2018 equity drawdown, bond SOLD OFF from 2.05% to 2.85%, ADDING nearly $1.4T of ADDITIONAL wealth destruction. This occured in the month of February and we show it as an example as the wealth destruction that occurs when stocks and bonds move down together.

 The U.S. economy is chugging along. Gross domestic product climbed a better-than-expected 3.5 percent in the third quarter on strong consumer and business spending, according to Commerce Department figures released Friday. The annualized rate of gains marks the best back-to-back quarters of growth since 2014.
 The GDP picture is loaded with inventory, consumption and government spending, BUT light on investment. The capex (capital spending by companies) boost from tax cuts has been drowned out by tariff / trade headwinds.
 Before stocks began to sell-off last week, the ratio of S&P 500 growth vs. value nearly touched its all-time high set during the dot-com bubble. We are confident this structural market shift will continue and are bullish on the value (defensive stocks, consumer staples) vs. growth rotation.
 A significant divergence began between the S&P 500 and staple equities this week. Capital has to flow somewhere.
