
“Our indicators tell us, we’re very close to a Lehman-like drawdown,” argues Larry McDonald, a former strategist at Société Générale who now runs The Bear Traps report.
Financial Times, February 20, 2020
*Our institutional client flatform includes; financial advisors, family offices, RIAs, CTAs, hedge funds, mutual funds, and pension funds.
Don’t miss our next trade idea. Get on the Bear Traps Report Today, click hereOne of Ernest Hemingway’s classics, “To Have and Have Not” was published during the depression in 1937. The scene is set after a wealthy man sneaks off without paying his bill to the fishing boat captain after a three-week fishing trip, leaving the captain destitute, forcing him to a life of crime. The 1930s connectivity to 2020 is ominous-looking out to 2021-2023. At what point does capitalism break on the back of social unrest? Let us explore.
% of Total Profits Coming from the Largest 100 Companies*
2020: 90%
2017: 84%
1997: 52%
1977: 48%
*U.S. publicly traded corporations, Wall St. Journal data and the Bear Traps Report. We are capitalist, with a profound love for capitalism, but is this trend sustainable? It’s clear, events like Lehman’s failure in 2008 and COVID19 2020, only exacerbate a Hayek’s Road to Serfdom. We MUST be prepared for what’s coming.
The Haves and Have Nots
In financial markets today, we also face a case of the “Haves” and the “Have Nots”. The Fed is not a solvency provider for the benefit of the “Have Nots”, but a liquidity provider for the benefit of the “Haves”. It’s survival of the fittest, complete with steroid injections. Sure, liquidity can help some companies that are hurt but not destroyed by the pandemic. But it is a fantastic boon to the real “Haves” that are not in distress at all. All but free money allows cheap financing to garner a still greater percentage of the economy. Classic Marxian concentration of capital. Meanwhile, the “Have Nots” who are heavily impacted by the pandemic, still can’t raise new debt capital, even in today’s awash-in-capital funding world. They are left helpless and forced to not only file for bankruptcy but downsize their operations by firing employees, rendering them destitute, like the hero of Hemingway’s novel.
Horrible Long Term Breadth
 As you can see above, the S&P 500 equal-weighted index relative performance against the Nasdaq 100 is unsightly. Remember, an equal-weighted index treats all 500 stocks equally, unlike the S&P 500 SPY ETF where a few stocks are holding up the index. Over the last 5 years, the Nasdaq 100 is 116% higher vs. 31% for the S&P 500 equal-weighted index.
US Treasury Debt Issuance
2021: $4.10T
2020: $5.20T
2019: $1.10T
2018: $1.20T
2017: $0.60T
2016: $0.60T
2015: $0.65T
2014: $0.70T
2013: $0.80T
2012: $1.10T
2011: $1.1T
2010: $1.6T
2009: $1.5T
*Net Marketable Treasury Issuance, Guggenheim. One MUST ask, with the US government coming to borrow at this pace, how much will be left for the have nots of corporate America?
Extreme Inequality – One Uneven Playing Field
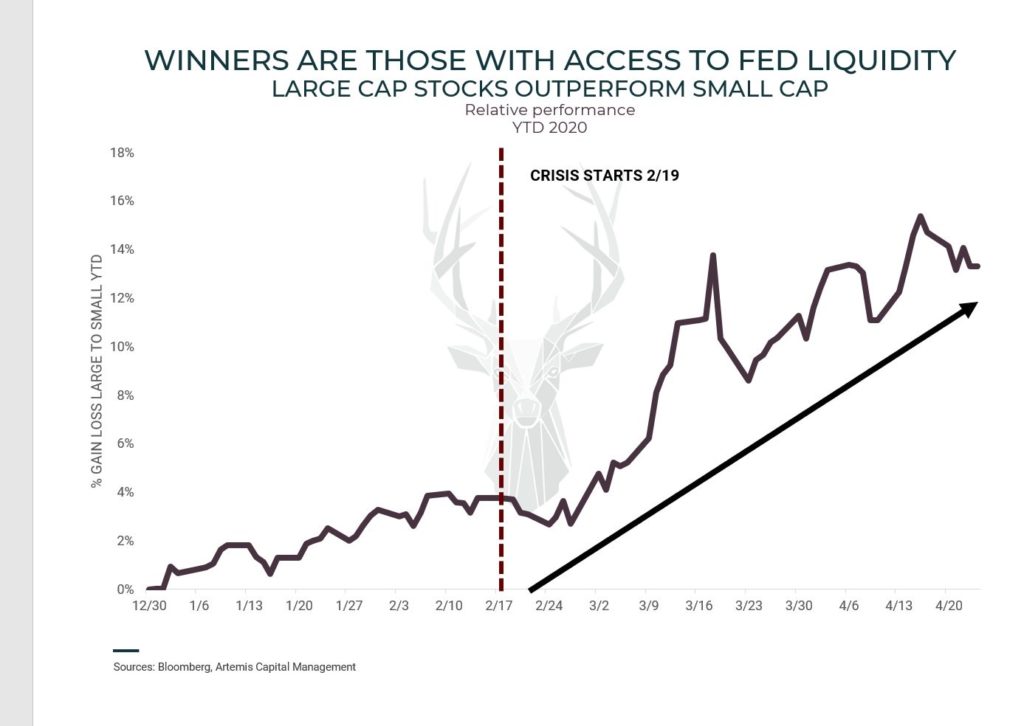 Everyone knows the Federal Reserve has expanded their balance sheet by nearly $3T in recent months, but few realize the colossal distortions that are forming in markets. Our friends at Artemis Capital Management have a unique lens on market distortions – while the mad mob was playing “don’t fight the Fed” roulette in February, they were getting long volatility at very attractive prices. See their powerful chart above. The strange thing is, the same crowd that was telling us “don’t fight the Fed” in February – is piling back into the Nasdaq again. They’ll NEVER learn, but why should they when the Fed bails them out each time? Year-to-date the Nasdaq 100 QQQs are +2.6%, while the Russell 2000 is -24.1%. Remember, 44% of the Qs are in just six stocks (Facebook, Apple, Amazon, Netflix, Google, and Microsoft). Where’s the trade? There is one sector we believe which will dramatically outperform the Nasdaq over the next 24 months, email tatiana@thebeartrapsreport.com for our special report.
Recent debt issuance has been phenomenal, well outstripping former years.
Weekly US Investment Grade New Bond Issue Supply
2020: $81B
2019: $42B
2018: $37B
2017: $34B
2016: $42B
2015: $41B
2014: $35B
2013: $27B
2012: $26B
*Nearly $800B YTD, four-week moving average above marking each year’s highest level. Bloomberg data. Last year, US investment-grade bond issuance was near $1.05T, at the current (unsustainable) pace – 2020 will end up close to $2.4T, fueling corporate inequality.
Bonds for Sale
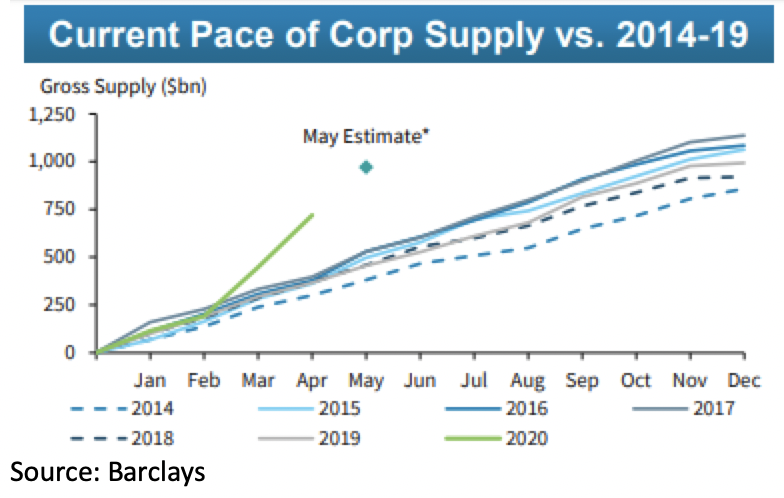 Companies are raising a COLOSSAL amount of cash, preparing for a long period of uncertainty. After extremely tight financial conditions, many U.S. corporations were shutout from borrowing in March. Today, they’re running to the open arms of investment banks -trying to get their hands on fresh capital. Many claim we’re entering a period of debt deflation, which begs the question. With capital markets this – wide-open – (see above) is it inflationary or deflationary? BY DEFINITION, debt deflation comes with extremely tight credit conditions leading to deflation. As you can see, the Fed is seeking to AVOID deflation while creating an environment where capital is easily accessible. The bottom line, the HAVE NOTs are forging deflation risk, at the same time the HAVEs are bringing on inflation risk in our view.
Two-Tiered Access to Capital
So, who are these “Haves” with unfettered access debt markets at almost free interest rate levels, rates well below what U.S. Treasuries yielded only a few months ago? Most are NASDAQ 100 companies and multi-nationals.
And, who are the “Have Nots”? The Russell 2000 and other small caps, who, by the way, employ a lot of people.
Nasdaq QQQ Extreme Richness to Russell 2000 IWM
 Is the Fed picking winners and sowing the seeds of losers? As central banks suppress interest rates with trillions of dollars of asset purchases (much of the buying U.S. Treasuries), bond prices are NOT the only thing moving higher. Why? It all comes down to the net present value of cash flows, a premium builds in Nasdaq equities during QE periods. A 1.25% 30 year U.S. Treasury yield makes corporate cash flows more valuable, it’s that simple. Large companies can borrow at far cheaper levels than small companies and it’s becoming exponentially unfair. The relationship between the Nasdaq QQQs and small-cap equities is reaching blood-curdling extremes. Since Q4 2018, the 2000 stocks in the Russell are flat and the Qs are up nearly 60%. One group has had easy access to capital powering stock buybacks, the other has not. It’s corporate inequality at its worst. Where’s the trade? There is one sector we believe which will dramatically outperform the Nasdaq over the next 24 months, email tatiana@thebeartrapsreport.com for our special report.
The Power of Hot Air – Inside the Secondary Market Corporate Credit Facility (SMCCF)
“Boeing just raised $25 billion on a deal that was met with $70 billion in orders, making it the sixth-largest corporate bond placement on record. In fact, investment-grade corporate bond issuance this year has broken the previous monthly record twice, with March volume of $262 billion breaking the previous record in May 2016 of $168 billion, and April volume of $285 billion breaking March’s record. Year-to-date investment-grade bond issuance through April totals $765 billion, putting 2020 on track to easily surpass last year’s total of $1.1 trillion. Many companies, including Boeing, Southwest, and Hyatt Hotels, have likely gained access to financing simply on the strength of the government’s intentions to intervene in credit markets. Successful debt offerings have also been completed by recent fallen angels like Ford and Kraft Heinz, both of which had corporate bonds trading at or near distressed levels only weeks ago. This was a real success for corporate bond issuers, but it was also a success for the Fed. The Fed has yet to buy a single bond in the SMCCF, but the mere announcement of the program has managed to tighten credit spreads dramatically and greatly ease liquidity issues.)”
Our friend Scott Minerd, CIO Guggenheim
Solvency vs. Liquidity
In our global, New York Times best-seller, we break down the difference between a solvency and liquidity crisis. In the case of the latter, sometimes healthy firms collapse because they can’t access the credit window, the Fed can address this risk. The former focuses on companies that can’t survive no matter how much they can borrow – they need a large cash flow boost. The Fed is helpless here, fiscal policy can provide some relief.
Equity Returns Sorted by Credit Ratings
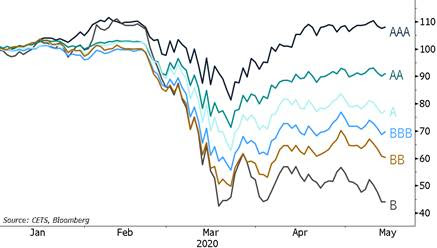 We are entering a period that will be extremely difficult for passive asset management. The days of blindly placing capital in index funds (S&P 500 SPY) and outperforming are over. Looking forward, if you cannot pick the winners from the losers – you will underperform. We believe long/short active asset managers are coming into a bull market in terms of incoming assets under management. As you can see above, credit leads equities. If you don’t understand the credit risk, you shouldn’t be in the stock.
Political Risk Surging Across Fixed Income and Equity Markets
Populist movements and political risk is SURGING across equity and fixed income markets. FAANG equities, for example, will have a significant target on their back moving forward as Washington moves to either break up these companies or find new, creative ways to tax them. Another example is found in the Fed’s Primary Market Corporate Credit Facility. This tool is designed to have the central bank buy debt directly from issuers – WITH strings attached. As a reminder, Treasury provided $75B of collateral to these programs, that the Fed leverages 10:1, to buy $250B in the secondary market and $500B in primary market debt. We hear some issuers will NOT sign up for it. Why? Some are thinking only ~20 companies (Ford, GM etc) because the government’s terms require CEO and CFO sign-off and potentially leave them exposed to some sort of congressional/government probes in the future, which many issuers may want to avoid. Translation, companies don’t want to become the next Fannie and Freddie. The GSEs went into Federal assistance (conservatorship) a decade ago and have NEVER come out of Uncle Sam’s grip with hundreds of BILLIONs of dollars in profits swept to the U.S. Treasury.
Shrinkage
However, there is a flaw to being one of the “Haves” if the number of “Have Nots” increases exponentially. Even the “Haves” need customers, and those customers may be fast disappearing as the “Have Nots” experience rolling bankruptcies and downsizings.
The savings rate recently vaulted (nearly doubled) to 25%, and for good reason, given the times in which we live. After a decade long buying binge, Americans have enough stuff. And as the super-charged unemployment compensation from the stimulus bill expires July 31st, the excess income it offered will evaporate, and fees for Netflix will decline. Companies can create all the content they want for people who have no money or who are desperately saving what little they have. Multi-hundred dollar smartphones? Forget it. Pay to play apps? Not a chance. Pay for movies? They’re free on Pluto. Keep your old phone and use the free apps you already have.
So the “Haves” become the “Have Nots” down the road. Look at it this way. Say a yacht was worth $30 million six months ago. What is it worth now that there are no buyers? Zero. What happens to private golf courses when half the members quit? They fold. Luxury cars? A bid here. A bid there. But the aspirational shopper is gone. Some asset prices can and will crash. High-end contemporary art is already offered at a 30% discount.
And what happens to that portion of spending attributable to keeping up with the Joneses when the Joneses run out of luck? Kaput. So much for multiple once in a lifetime vacations every year.
As the core of the economy is hollowed out, the number of “Haves” joining the ranks of the “Have Nots” will only increase.
This is part and parcel of “The Fourth Turning”. Over the next 6-8 weeks, correlation will rise across equity market sectors.
Money Supply Surge
Beware – broad money supply year-over-year percent growth is now at a record 18.5%, this is sowing the seeds of inflation 6-12 months out. We say this with HIGH conviction. More than QE1, QE2 or QE3 combined, the Fed’s nearly $1T of asset purchases in April is at an unsustainable pace. In the inflation recipe, there are three primary ingredients and we have them all; a) large printing to fund government spending, MMT, b) a large budget deficit, c) a significant supply shock.
Total Returns YTD
Nasdaq 100: +0.14%
Berkshire: -19.35%
1 Year
Nasdaq 100: +14.09%
Berkshire: -15.5%
3 Year
Nasdaq 100: +60.02%
Berkshire: +10.02%
Since 2000
Nasdaq 100: +181.08%
Berkshire: +412.02%***
Bloomberg data
Buffett is NOT Interested
Over the weekend we learned Berkshire Hathaway has been a net seller of stocks this year. Even with a $137B war chest of cash – Buffett has no interest in making a large purchase. Keep in mind, his pile of greenbacks is up from $53B in 2016! This is fascinating, clearly, Buffett doesn’t want to play the “don’t fight the fed” roulette – he’s waiting for real value. Clearly, low rates put FAANMG like equities in high demand. Buffett doesn’t want to chase, play musical chairs in these stocks, thus he continues to get swamped on a relative performance basis. What could stop this seemingly endless trend? Just the slightest hint of INFLATION will crush the Nasdaq 100, unimaginable destruction. Join us below for our special report:
Don’t miss our next trade idea. Get on the Bear Traps Report Today, click here
