Institutional investors can join our live chat on Bloomberg, a groundbreaking venue since 2010 – now with clients in 20+ countries, just email tatiana@thebeartrapsreport.com – Thank you.
Author Lawrence McDonald is the New York Times Bestselling Author of “A Colossal Failure of Common Sense” – The Lehman Brothers Inside Story – one of the best-selling business books in the world, now published in 12 languages – ranked a top 20 all-time at the CFA Institute.
Lessons Looking Back and Forward
We have all heard the phrase — “Those Who Do Not Learn History Are Doomed To Repeat It.” As we place our lens on modern inflation, let us take a look back for clues that may help us look down the road ahead.
Global Population Trends
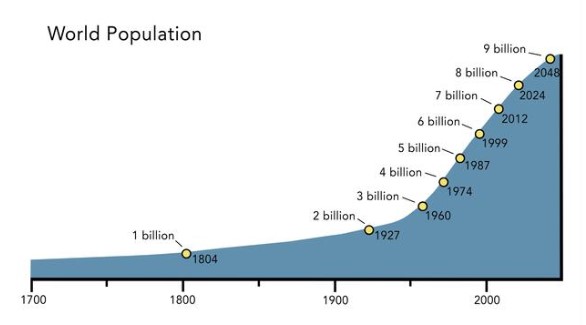 There is a price to pay for all that cheap underwear at Walmart. Think of the last 40 years, we have decimated the U.S. Rustbelt. The good news is millions of people have been pulled out of poverty globally. From 1998 to 2021, the U.S. lost more than 5 million manufacturing jobs thanks to the growing trade deficit in manufactured goods with China, Japan, Mexico, the European Union, and other countries. – EPI Data. The bad news? The per capita consumption of commodities is exploding globally. There are 1 billion human beings in India that do NOT have air conditioning. Another 1 billion in China do NOT own an automobile. We are suppressing the supply (hello ESG) of many key commodities all around the planet, while at the same time roiding up future demand. There is a price to pay for exporting higher-paying jobs out of the United States, and the consequences are fast approaching.
Economic cycles were much slower in the Middle Ages, given the transmission mechanisms of the time. However, broadly, many of the factors that affected prices in Medieval times will be familiar to those who have studied the most recent inflationary bout. Generically, prices increased on average by no more than half of one percent from 1225 to 1345. The main and initial cause of this price increase was an increasing population: a medieval baby boom. Price increases were not uniform, however. Inflation was especially strong in four areas: energy, food, shelter, and raw materials. Of the four, initially, the most striking was the cost of energy.
From 1261 to 1320, English charcoal and firewood rose quite rapidly. Why? Because England, like the rest of Europe, cut down its forests, not just for fuel, but to build cathedrals, while using much stone, and use much lumber as well. Timber and charcoal began to be traded internationally. It was at this time that the coal mines of England, Belgium, and France were developed. Air pollution in London in the 13th century was awful. Nor were forests replanted. Thus, inflation was caused by an increase in demand. The population increased causing trade to increase. The increase in commerce caused an increase in industrial development. Expanding markets increased the velocity of money. As monetary inflation was added to demand inflation, prices rose inexorably.
Eventually, consumers got used to the idea that prices always went up. This led to governments expanding the money supply. In the thirteenth century, that meant expanding the silver supply. England created 200,000 silver coins from 1210 to 1218. In the 1240s, this increased to 500,000 silver coins for the decade. For the decade of the 1280s, silver coin production totaled 1,000,000. The Italian city-states began to mint gold coins for the first time since the fall of Rome. In southern Europe, peppercorns began to be used as a form of currency. The Florentines and then the Genovese invented credit instruments: contracts of exchange and bank transfers.
With the notable exception of Florence (currency = florins) and the Serene Republic of Venice (currency = ducats), currencies were systematically debased. The result was that Venetian and Florentine money was the most sought-after in Europe for international trade.
As a result of the above drivers, inflation became self-reinforcing, “sticky.” Higher prices created a demand for more money. The demand for money was met with an increase in its supply, but as international trade continued to expand, so too did the velocity of money, fueling inflation still more.
Wages are NOT Coming Down
 U.S. government spending is UP 10% year over year. We are looking at a near $2T deficit. There are 70,000,000 Americans receiving an 8% COLA (cost of living adjustment). What many people fail to understand, are the colossal social and political drivers of inflation. Once inflation gets above 6%, the follow-on effects linger on for years. It´s like spilling a can of Coca-Cola in the backseat of the car. It gets under the seat cushions, it´s in the seams and is extremely hard to kill. Especially with government spending ripping higher which after all was a reaction to higher inflation in the first place!
As inflation continued, by the mid-13th century wages began to lag. Real wages fell slowly at first, then with increased rapidity. By 1320, real wages were 25% to 40% lower than they had been 100 years earlier. Meanwhile, rents and interest had risen. Eventually, rents and land values increased more than energy. Interest rates in the Italian city-states rose from 12% a year in 1230 to 20% towards the end of the century. Thus, the cost of capital and shelter increased as real wages fell. Not everyone was harmed.
Core Inflation is Double the Fed´s Target
 The “power of labor” and rents are keeping core inflation high – more than double the Fed´s target. Labor strikes are everywhere, inflation is empowering organized labor. Some 20,000 railway workers will strike on July 20, 22, and 29 as part of the ongoing national rail dispute, the RMT union announced Friday. A strike from 340,000 UPS workers could cause major disruptions across the U.S., and would be the country’s biggest work stoppage since a steelworkers strike in 1959, CBS News reported.
What happened was merchants would lend money out in debased currency but made sure laws were enacted so that they would only get paid back in Venetian ducats and/or Florentine florins. The arbitrage between debased currencies and currencies that held their worth through a constant metal content made some merchant families enormously wealthy. Thus, there was a growing economic inequality between the merchant class and the working-class peasantry. The key is, the growing gap between returns on capital and the returns on labor stimulated economic inequality.
Another effect of constant inflation was an increased imbalance between governments’ public income and expenditures. Basically, governments borrowed more money the longer inflation lasted. Public deficits increased dramatically. This weakened government power, and, ultimately, Feudalism.
As inflation hummed along, it became more volatile. Price swings higher and lower became more extreme. Production and productivity fell, both for land and for labor, reducing much of the populace to subsistence living. This meant greater sensitivity to poor harvests. In those days, a harvest reduction of only 10% could cause severe problems for the lower 50% of the population. A harvest 20% below normal caused widespread starvation.
Governments would come to the breaking point and face up to inflation via “recoinage” or a new setting of the metal content, and, in fact, such recoinages did last for certain lengths of time. Debasement drove prices up. Recoinage drove prices down. Every single time a recoinage happened, the price of oxen fell, for example.
As one might imagine, exchange rates in the 14th century destabilized. Especially when banking families collapsed. In the late 13th century, the large Italian banks extended too much credit to too few monarchs: extreme leverage plus concentration risk. Of course, such loans (if the payments were on time) made the banking families enormously wealthy. However, a banking panic cropped up in 1298. Siena’s most important bank was the Gran Tavola of the Buonsignori. This bank lent to all the governments, all the great merchant families, and to the pope. Its agents were in every major trading center of Europe. It managed to hold on even as its loan portfolio began to sour, but by 1307, the bank collapsed, taking many businesses downs along with it, and crippling the Sienese economy for many years.
The failure of the Gran Tavola of the Buonsignori was the first bank failure, but not the last. In the early 14th century, various Florentine banks fell: the Mozzi in 1302, the Franzesi in 1307, the Pulci and Rimbertini in 1309, the Frescobaldi in 1312, and the Scali in 1326. Six more banks failed in 1342. Between 1343 and 1346 the three huge banks of the Peruzzi, Acciaiuoli, and Bardi imploded. It would take many years for Tuscany to recover.
Another response to rising inflation was the hoarding of precious metals. Inflation demanded an increase in stocks of inventory of silver and gold. This in turn fueled inflation. This pushed many governments to the brink of bankruptcy. As noted above, the decline in real wages made subsistence razor-thin for the masses as well. Poverty and hunger spread throughout the West. Crime increased, mainly the theft of food but also of anything that could easily be exchanged for food. The worst famine in European history occurred from 1315 to 1317, right in the middle of the rolling bank crisis. The population decreased by 10% because of that famine. After famine came epidemics. That in turn led to more crime.
Wars happen in clusters. After 1294, there was a notable increase in military conflict. This strained government purses when they could least afford it. Domestic riots became more common as well.
Then the Black Death struck. The population of Europe in the early 14th century was approximately 80 million. After the Black Death, it was about 60 million. That makes it the worst population decline in European history. The effects of the Black Death varied over time. When it first appeared, food prices went through the roof. However, as the population collapsed, food prices collapsed as well. However, as the artisan class was all but wiped out, the cost of finished goods went through the roof. Massacres of Jews and foreigners became commonplace. Eventually, the Black Death spelled the end of Medieval civilization.
The Hundred Years’ War between England and France (which had many multi-year hiatuses) left huge swaths of the countryside in complete anarchy. Mercenaries, released from their duties for a year or more, preyed upon the peasantry of the countryside. No one could stop them. Some gangs were as large as a brigade today. Obviously, this curtailed trade, not only agricultural production. Many farms were simply abandoned. This hurt population growth as well. Even after the Black Death subsided, the low point of the European population wasn’t hit until 1401 to 1402.
During the late 1300s, money in circulation declined. The amount of gold and silver in Europe fell. Much of it was hoarded only to be discovered today. Since Europe couldn’t produce enough food and goods, the balance of trade with Asia gradually depleted the money stock in Europe. The decline in money created further economic depression. Land values fell proportionally to the population decline. Grain prices went down, but a shortage of labor made wages go up. The cost of unskilled labor in some towns increased 50% from 1350 to 1400. In real terms, wages increased dramatically throughout Europe.
The result? A new society. As a result of increased real wages, the serfs were emancipated, and Feudalism ended. The Feudal economy had lasted over 700 years. Many of its social structures remained (class consciousness, what have you) but as an economic system, it was finished. As the power of labor increased, the labor class gained political power and peasant rebellions became more frequent and more intense: the Jacquerie in France (1358), the Ciompi in Florence (1378), the Peasant Rebellion in England (1381). The lower classes rose against the upper classes. By the time we reach the reign of Queen Elizabeth in the mid-sixteenth century, rural serfdom no longer existed in England.
Early in the 15th century, prices still fluctuated but began to be more regular and less intense. Commodity prices declined and then stabilized. Real wage gains were permanent. The result? The Renaissance. The fall of Byzantium created a one-time windfall of cultural knowledge for Europe. And now there was steady, healthy demand for it.
Our take: there are parallels between Medieval inflation and contemporary inflation. Surely, the increase in the global population is one factor in long-range multi-generational inflation. Another parallel is the increased consumption of energy combined with a lack of investment in replacement energy. More similarities may be marked in the long-range increase in the supply of money and an increased tendency to believe in higher long-term inflation. Fiat currencies are in a debasement cycle. The collapse in real wages and the concomitant increase in inequality are also familiar. Increased FX volatility, bank failures, and Central Banks hoarding precious metals also have a familiar ring. The increase in the power of labor after a global pandemic is almost eerie in its parallels. What is most surprising, perhaps, is how even a low rate of inflation (well below the 2% target of the Federal Reserve) can over a century lead to disaster, how even a low rate of inflation leads to yet higher rates of inflation, fluctuations aside. History repeats.
These days, it is a stretch if people discuss inflation from half a century ago, so we thought it might be helpful to look at Medieval inflation. Above is an encapsulation of work complied with by David Fischer. We urge a read of his tome “The Great Wave.” However, for those who lack the time, here above is a summary.
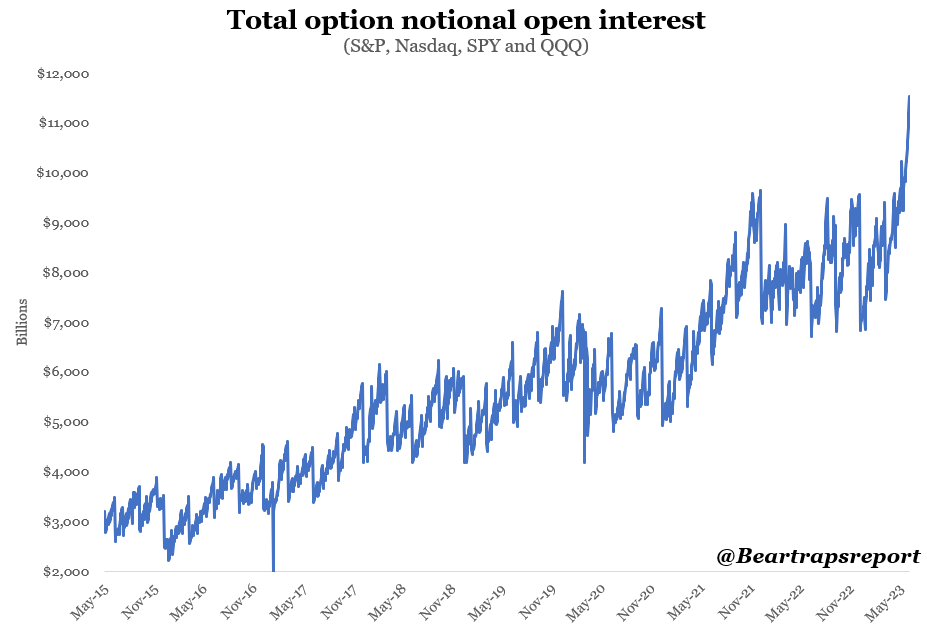 Open interest in index options has soared to all-time highs. As dealers get lifted on calls in size (large banks offering options – marking markets) – they MUST buy stock (Apple, Tesla, Nvidia etc) in size to hedge their upside risk – this helps trigger short covering. As stocks move higher, option market markets then have to buy even more stock. The gamma squeeze is on. Each day that passes by,
 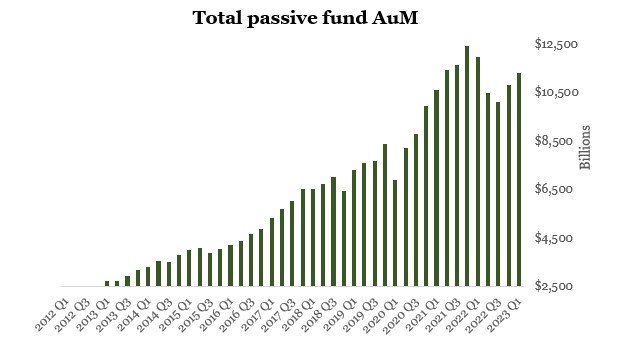 Warning – your 401k has been hijacked by SEVEN stocks. There is nearly $18T inside the Nasdaq 100 – Microsoft, Apple, Google, Nvidia, Tesla, Amazon, and Meta, makeup nearly 54% of the QQQs. Assets under management with passive investors, which are those funds that mirror indices and/or specific quantitative parameters, have grown from $2.5 Trillion in 2012 to more than $11 Trillion by Q1 of 2023.
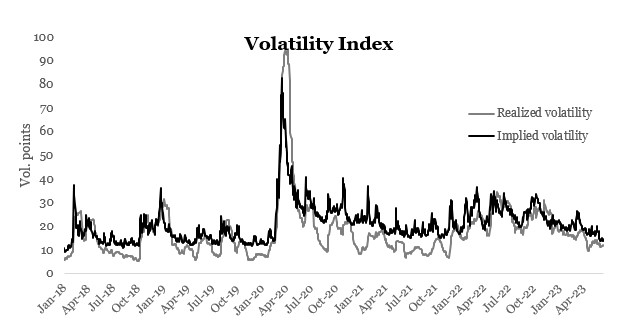
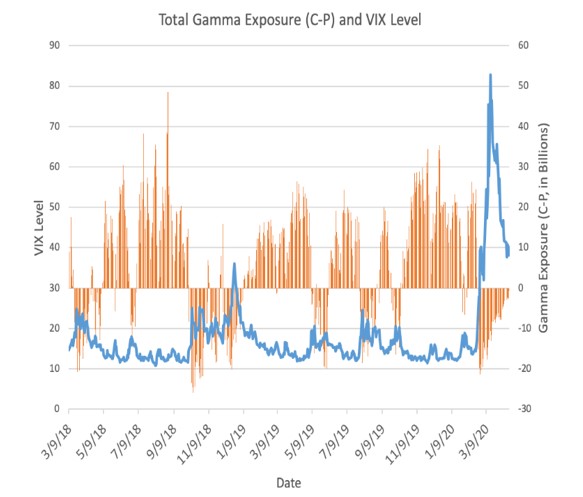 This historical chart shows the interplay between gamma and volatility. Gamma is generally positive and increasing when volatility (VIX) is low and negative and declining when volatility is high. This means that in low-volatility markets dealers tend to sell stock and indices when markets rally and buy when markets sell off. This has a dampening effect on volatility and it’s easy to see a positive feedback loop with lower vol creating higher gamma that leads to even lower vol. The opposite is true as well, and in volatile markets, dealers sell when markets go down and buy when they go up so this enhances volatility.
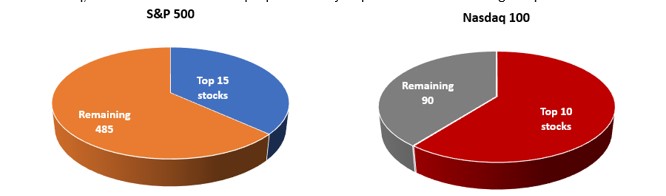 The 15 largest stocks in the S&P now represent 36% of the entire index while the ten largest stocks in the Nasdaq 100 represent 60% of the index. These largest stocks are of course Microsoft, Apple, Amazon, Google, Nvidia, Meta and Tesla and the like.
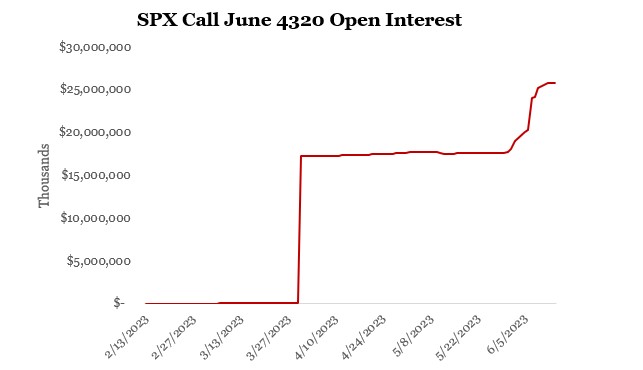 Open interest in the 4320 call that ex[ires on June 30 rose from $800K to $17 Billion when JP Morgan’s JHEQX came in and sold 40,000 calls in late March.