
Institutional investors can join our live chat on Bloomberg, a groundbreaking venue, just email tatiana@thebeartrapsreport.com – Thank you.
Lawrence McDonald is the New York Times Bestselling Author of “A Colossal Failure of Common Sense” – The Lehman Brothers Inside Story – one of the best-selling business books in the world, now published in 12 languages – ranked a top 20 all-time at the CFA Institute.
What have we done with the $11 Trillion?
We have clients in 23 different countries, but most reside within the continental United States – in recent weeks, we keep hearing countless stories of self-proclaimed 24-hour turnaround testing centers to do a PCR test, then taking more than 80 hours to get the results back. Friends in New Jersey tell us not one pharmacy or walk-in clinic in a 100-mile radius has appointments available in the next week. Home testing has improved but for those traveling overseas – it is a PCR test that is needed.
The question that haunts us now is that, almost two years into this crisis and an $11 Trillion U.S. Fiscal and Monetary spending deluge, we still don’t have an adequate testing infrastructure? It blows us away – we are still dealing with endless waiting lines, no availability of testing appointments, shortages of at-home tests and overwhelmed testing labs scrambling to process vials. Where did all that money go?
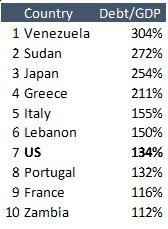
State and Federal Debts Add Up
In the US, the corona crisis started on January 29, 2020, when the White House initiated its coronavirus task force. Since then, the US has gone from crisis to crisis and the media and our politicians have been obsessed with this epidemic and its consequences ever since. Amidst all the turmoil, the US government has left no stone unturned to throw money at this disaster. The Fed kicked off in early March by lowering interest rates to zero and shortly after began rolled out an alphabet soup of emergency programs. From buying high yield debt to bankrolling bailout checks (PPP loans), nothing was left on the table for our adroit stewards at the Fed. The byzantine maze of fiscal stimuli has left everyone confused. Nevertheless, the total amount of support the Fed has pumped into the economy is best measured by the expansion of its balance sheet. When the Fed finishes its asset tapering program in March of 2022, its balance sheet will have expanded by $5 Trillion. In less than two years the Fed deployed more money than during, and in the 10 years after, the great financial crisis ($3.5TR). This monetary support alone is also more than that of the entire GDP of Japan, the third-largest economy in the world.
Not to be outdone, the Federal government opened the floodgates by quickly passing spending bill after spending bill. After less than two years, the total amount of fiscal stimulus, as measured by the fiscal deficit spending, has reached a mind-blowing $6 Trillion. U.S. Federal debt has reached $29 Trillion and $32 Trillion if you add State and Local debt. At this point, US debt is a whopping 134% of GDP, giving the U.S. the dubious honor of being among top ten most indebted countries worldwide. This is a spot the erstwhile creditor to the world shares with the likes of Italy and Venezuela.
Where did all the money go?
And what did we, the American people, get for this colossal $11 Trillion in a monetary and fiscal deluge? As we find ourselves in the midst of yet another massive outbreak is case count, this seems like a valid question. You would think that the priority for these funds is to bolster essential healthcare needs to address this medical crisis. But even now, the US is still woefully ill-equipped with testing capabilities, almost two years into this crisis. Our friends in Europe tell us testing is quickly done there. They live in urban areas such as Paris where testing is still readily available. France is also in the midst of another outbreak but seems to have no problem providing its citizens with ample testing facilities.
In hospitals, there has apparently been no improvement in available capacity in the critical ICUs, judged by the Johns Hopkins weekly hospitalization trends.
Hospitalizations
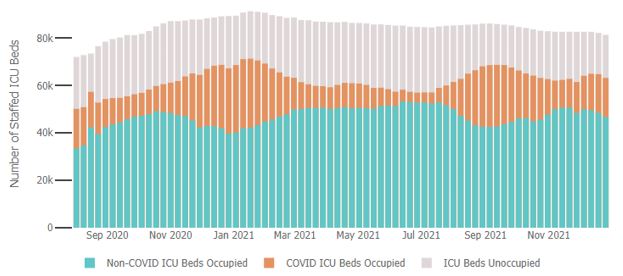
Incredulously, ICU beds-in-use compared to overall availability is almost higher now than it was a year ago.
So Where did the Money Go?
According to the Congressional Research Service, $25 Billion was appropriated for “selected domestic COVID-19 vaccine-related activities”. That sounds like a lot, but it’s a mere 0.5% of the federal emergency spending in the last two years. It turns out that the department of health and human services wasn’t even the biggest recipient of all the emergency spending. It was fourth on the list, which was topped by the Treasury Department, the small business administration, and the department of labor. Other major recipients were the department of education and the agriculture department. Why farmers needed a $160 Billion windfall during the pandemic is incomprehensible, especially since most crop commodities have been at record highs for a year now.
Reasonable people can agree that small businesses needed support during this crisis, especially during the lockdown. But the Fed’s Term Asset-Backed security Loan Facility (TALF), Primary and Secondary Market Corporate Credit Facilities ((P/S) MCCF), and Municipal Liquidity Facility (MLF) had absolutely nothing to do with small business assistance. These programs, together with the $5 Trillion purchases of Treasuries and agency debt, helped to foster an explosion in debt issuance by big business. Fueling stock buybacks – Investment-grade debt issued in this year and last year was a total of $3.1 Trillion, almost half the size of the total IG market. High yield issuance was even more baffling, setting issuance records two years in a row amidst a debilitating epidemic.
Junk Bond Bonanza Fueling Stock Buybacks
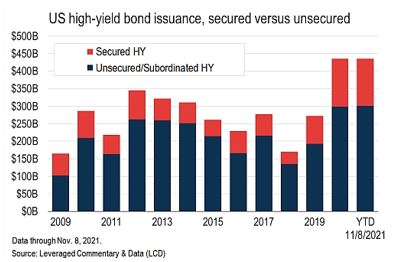
The effect of all this government largesse has had a profound impact on the stock market. The total market value of all stocks has risen from $34 Trillion to $53 Trillion; a whopping $19 Trillion (50%) increase from pre-pandemic levels. The IPO market has been red hot this year, with 1000 deals for the first time in history. Rock bottom interest rates and epic multiple expansion have driven investors into IPOs, as they clamor for excess returns in the most unsavory deals. U.S. junk bonds, we see new supply to plunge as much as 30% in 2022 as refinancings, the driver for almost 60% of issuance this year, will shrink because companies already capitalized on low yields and lengthened maturities. Likewise, a Fed in a hiking cycle should tighten financial conditions – shrink issuance.
Buybacks Driving S&P and Nasdaq Higher – On Leverage
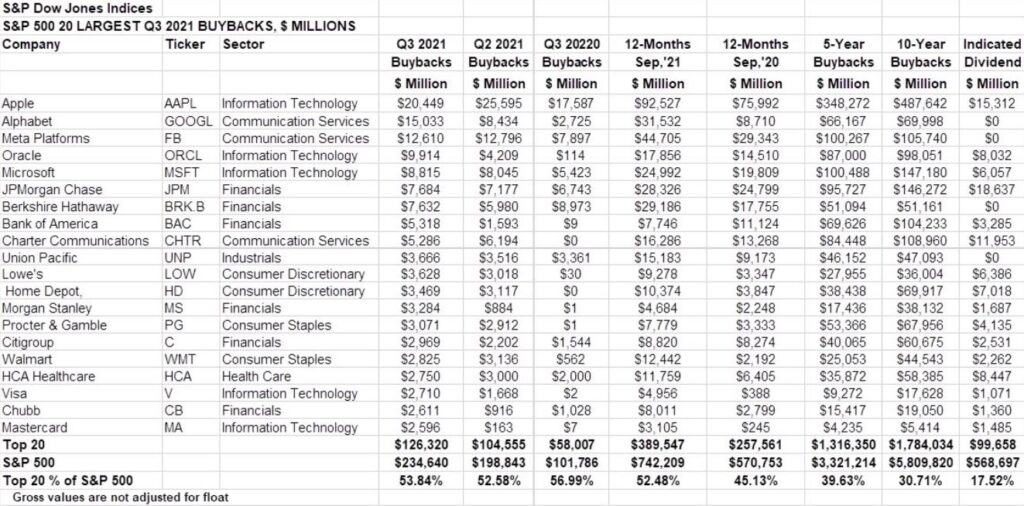
Congress wants to tax stock buybacks – the implications are sky-high as a colossal equity market bid comes from Fed-induced corporate bond sales- See above with @SamRo – he notes just 20 companies are responsible for half the stock buybacks – this is one enormous – central bank fueled – leveraged Ponzi is driving stock indexes (S&P 500 and Nasdaq) higher. Of course in Q1 – Q2 2020 when stocks were on sale – few companies were buying back stock. Per Fitch – U.S. dollar-denominated, investment-grade (IG), corporate bond volume, excluding financial institutions, supranationals, sovereigns, and agencies, tallied $705 billion through Dec. 16, 2021. We saw the second-highest issuance through the first 10 months of the year and are up 27% and 13%, from 2018’s and 2019’s respective levels. Volume is down 36% versus the record 2020 amount; though that gap could shrink by year’s end as the final two months of 2020’s issuance was well below 2021’s monthly average. The volume disparity between 2020 and 2021 relates to deal size. Last year, there were double the number of transactions done for $4 billion or more compared with this year (60 in 2020 versus 29 in 2021). Both years featured at least two $20 billion issuances, with AT&T Inc. and The Boeing Company driving 2020 while Verizon Communications Inc. and AT&T led 2021. Several prominent companies tapped the IG market in 2021, including Verizon, AT&T, Amazon.com Inc., Oracle Corp., Comcast Corp. and Apple Inc. These six issuers comprised 21% of the year’s total volume, with all completing bond transactions of $15 billion or more. In fact, the 10 largest issuers make up 29% of 2021’s volume, highlighting the market’s concentration.
The problem is – central banks are fueling unsustainable inequality.
Share of Total Net Worth held by the Top 1%
2021: 32.5%
2010s: 31.2%
2000s: 27.2%
1990s: 26.7%
1980s: 23.2%
*Since 2003, the Bottom 50% total net worth held has plunged from 39% to 30%. Federal Reserve data. For 20 years 1990-2010, the top 1% net worth held was range-bound 26-27% – since central bank aggression in balance sheet expansion in 2009, inequality has exploded higher.
The Great Heist at the Taxpayers Expense
This is all great if you own stocks, or when you are a Fortune 500 company issuing debt to repurchase your own stock, but neither the deluge in debt nor the record number of buybacks (at a run-rate of $1 Trillion this year) have done anything to bolster our country’s medical care or Americans’ health. More troubling even is reports showing outright theft of funds earmarked for pandemic emergency spending. The Wall Street Journal quoted the U.S. Secret Service who said that “some $100 billion has potentially been stolen from Covid-19 relief programs designed to help individuals and businesses harmed by the pandemic.” The main culprits are worldwide organized crime networks, who defrauded primarily the pandemic unemployment insurance program. On top of that, as much as 15% of the PPP loans ($76 billion out of $800 billion total) may have been fraudulent, according to the New York Times.
The Middle Class is in Pain
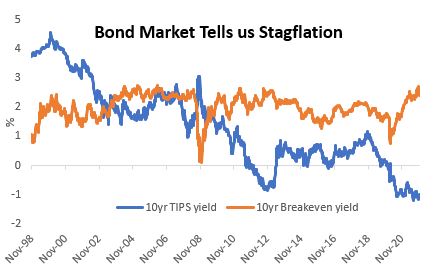
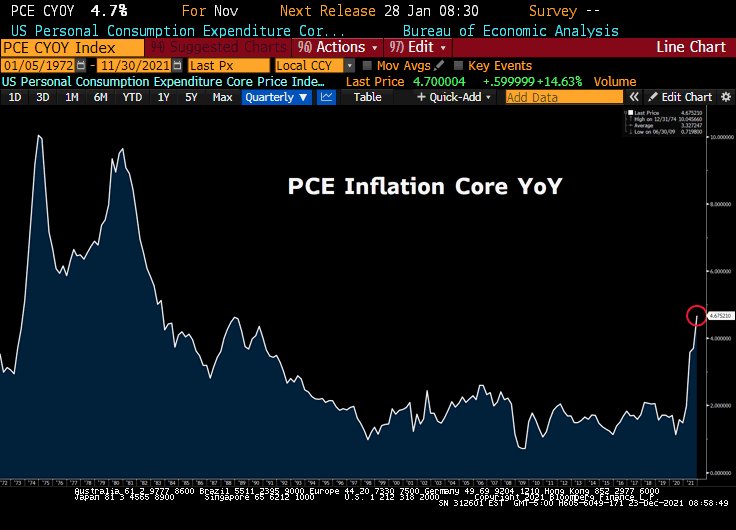
After $11 Trillion of emergency spending and support, the US healthcare system is just as inadequate as it was before the crisis, violent crime is rampant, drug overdoses have never been higher and the economy is showing signs of stagflation, as illustrated by the record spread between Treasury breakevens and TIPS yields¹. What these bond market metrics suggest is that the potential growth rate of the US economy has structurally declined since the pandemic (it already declined a lot since the “great financial crisis”) and that any growth future growth is coming from price increases. The bond market is telling us – a significant portion of future GDP growth is coming from price increases, but there is little real growth in the economy, which is why TIPS yields are -1.00%.
Consumers in Pain
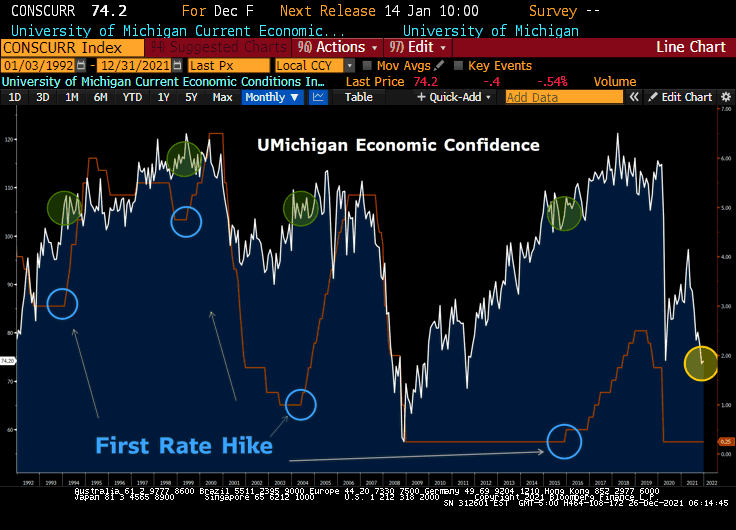 Since August – we have had THREE sub-80 readings from the University of Michigan Consumer Economic Confidence Data. Looking back over the last 30 years – it is HIGHLY unusual for the Fed to hike rates with consumers in this kind of pain. Inflation´s taxing powers over the consumer have already hiked rates 100bps for the Fed in our view – colossal demand destruction has taken place. These stagflationary conditions erode people’s real disposable income, making them worse off. Ultimately, most of the $11 Trillion ended up benefiting the top wealthiest Americans, by inflating the prices of assets such as bonds and stocks and lowering interest rates for borrowers with the highest credit rating. For the average citizen, this has been a very raw deal.
Loud Covid Narrative Hides Inconvenient Truths
We must look at the big picture. There is a high price from lockdowns and Covid human suppression / OUTSIDE of cases. The number one killer of Americans aged 18 to 45 is now fentanyl overdoses, with nearly 79,000 victims in the age range dying to them between 2020 and 2021.
Inflation is a Regressive Tax on the Middle Class
 TIPS: Treasury Inflation-Protected Securities: The principal of a TIPS increases with inflation and decreases with deflation, as measured by the Consumer Price Index. When a TIPS matures, you are paid the adjusted principal or original principal, whichever is greater. Breakeven yield is calculated by deducting TIPS yields from real yields. Breakeven rates derive the rate of inflation priced in by the bond market for applicable maturity (such as 10-year breakevens express the implied rate of inflation in the next 10 years).
Trillions of Fiscal and Monetary Support
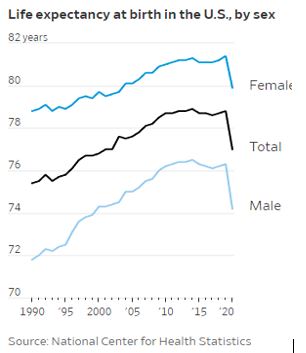
What is so painful is that not only is there no discernable improvement in the healthcare infrastructure to deal with the corona crisis, but other facets of America’s healthcare are now even worse off. The CDC reported this week that fentanyl is now the leading cause of death among teenagers. These drugs have killed more people between the ages of 18 to 45 than corona, car accidents, and suicides. Data from Families Against Fentanyl suggests that now one person dies from an overdose every 8.5 minutes. The pandemic has pushed drug abuse into overdrive as “the stress of the pandemic has led more people to use these types of drugs, according to experts.” The Census Bureau this week reported that America’s population grew at the lowest rate in history. In the year that ended July 1, the U.S. recorded only 148,000 more births than deaths, with the balance coming from net immigration. America’s life expectancy last year declined by an unprecedented 1.8 years to 77 years. Besides corona, increases in mortality from drug overdoses, heart disease, homicide and diabetes also decreased life expectancy. Violent crime especially has seen a dramatic increase in the last two years. CDC’s National Center for Health Statistics reported that homicide rates rose 30% between 2019 and 2020 and they continue to go up this year. At least 12 major U.S. cities have broken annual homicide records in 2021 — and there’s still three weeks to go in the year.
US Annual Population Growth
2021: 0.1%
2011: 0.8%
2001: 1.0%
1991: 1.2%
*America is dying – and it’s NOT just a Covid narrative. From 1999–2019, nearly 500,000 people died from an overdose involving any opioid, including prescription and illicit opioids -CDC data.
Don’t miss our next trade idea. Get on the Bear Traps Report Today, click hereInstitutional investors can join our live chat on Bloomberg, a groundbreaking venue, just email tatiana@thebeartrapsreport.com – Thank you.
Lawrence McDonald is the New York Times Bestselling Author of “A Colossal Failure of Common Sense” – The Lehman Brothers Inside Story – one of the best-selling business books in the world, now published in 12 languages – top 20 all-time at the CFA Institute.
https://www.wsj.com/articles/thefts-of-covid-19-relief-funds-total-at-least-100-billion-secret-service-says-11640202072?mod=newsviewer_click&adobe_mc=MCMID%3D51653117380132417033071163947615250798%7CMCORGID%3DCB68E4BA55144CAA0A4C98A5%2540AdobeOrg%7CTS%3D1640202483
https://www.kxxv.com/cdc-fentanyl-overdoses-now-leading-cause-of-death-for-americans-aged-18-to-45
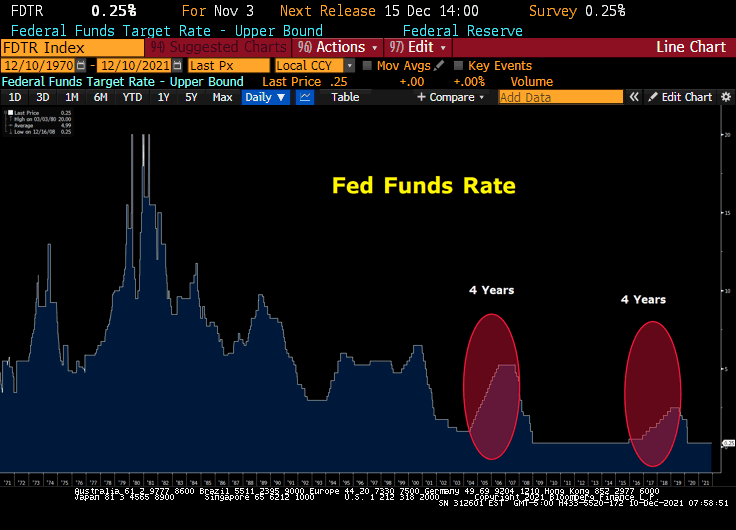 The bond market is telling us, the Fed´s ability to pull back accommodation over an extended period of time is HIGHLY limited. Nearly 71% of the U.S. Federal budget is interest spending and entitlement spending vs. 30% thirty years ago. Close to 14% of Americans are on Food Stamps today vs. near 3% in 2000. There are bills to pay, the Fed´s hands are tied.
 Value vs. Growth the Epic Final Days of this Battle – TSLA is Through key support – 20% off sale – Tesla TSLA is going through the recent lows pre-market – observation of the week – the 25-30x sales LARGE caps (NVDA – TSLA) – are playing CATCH UP with the COUNTLESS 40-100x sales garbage that is now trading 10-20x (ARKK names). So we have a washout in the Nasdaq with 300+ companies moving from 40-100x sales to 10-20x sales and NVDA still sits unched at 30x sales?? – Large-cap stretched names are playing catch up this week.
 Close to 20% off their highs – hot software names are in pain. The Nasdaq Composite Index is up roughly 15% year-to-date. However, when removing the 5 largest equities, the index is down close to -20% on the year! This shows how large the tail-risk to US equity markets is if the largest names are to see a significant pullback. This is one of the most top-heavy markets in history. As we stressed in January on Real Vision and CNBC –
