Don’t miss our next trade idea. Get on the Bear Traps Report Today, click here
June 2017
Since early 2017, the European Central Bank has purchased another $1T of assets, blowing their balance sheet up near $5T. Most of this capital has flown into government and corporate bonds with meaningful implication. Let us explore.
Each day that goes by, there are fewer and fewer bonds for investors to buy. The ugly side effects of this experiment are now oozing through bond markets around planet earth.
It was an all you can eat buffet. Back in 2017 with the ECB distorting global bond prices, Argentina found loads of buyers for an ultra-long dated – 100 year – bond. Today, with this pile of debt approaching 36 cents on the dollar, investors have been left holding the bag to the tune of a $2B loss. That’s nothing, senior secured lenders to Argentina at the IMF are sitting on $56B of capital that has just been lit on fire, while U.S. taxpayers are on the hook for $20B of that loss.
If you sit back and think about the current dynamic playing out in the global bond markets, you see a circular beast eating nearly everything in its path. Central banks have been preventing the cleansing process of the business cycle from functioning by buying assets, near $15T between the Fed, ECB, and BOJ. The good news is, trillions of dollars in new wealth has been created that needs a home, with the top 1% getting richer by the day. On the other hand, with fewer choices to buy, bonds with negative yields have climbed from $5T in September to $17T today. Bottom line, investors are being “shoe-horned” into places they just shouldn’t be.
Years Argentina has been in Default
2013-15
2000-04
1980-92
1955-65
1950-51
1890-93
1826-58
Amazing, with this track record, investors bought $15B of bonds in 2016-2017. This week, the Macri government in Argentina announced it will postpone paying $7B of short-term local debt for up to six months while pursuing a “voluntary reprofiling” of $50bn of longer-dated debt, the majority of which is owned by foreign investors. The government also said it plans to delay the repayment of loans already disbursed by the IMF. Argentine bonds plummeted to record lows on the news, with the once-popular “century bond” maturing in 2117 plunged near 36 cents on the dollar. The shorter-dated dollar debt coming due in 2021 fell below 50 cents on the dollar, pushing its yield to nearly 60%, per the FT.
A Tale of Two Countries
 The double-edged sword of duration is on stage here. Some investors like ultra-long maturities with low coupons because their prices rise dramatically when their yield falls. In the great race away from negative yields, over the last year, Austria’s long bond has doubled in value, while Silver is 32% higher, and gold up more than 29%.
Don’t miss our next trade idea. Get on the Bear Traps Report Today, click here
Have and Have Nots in U.S. Corporate Bonds
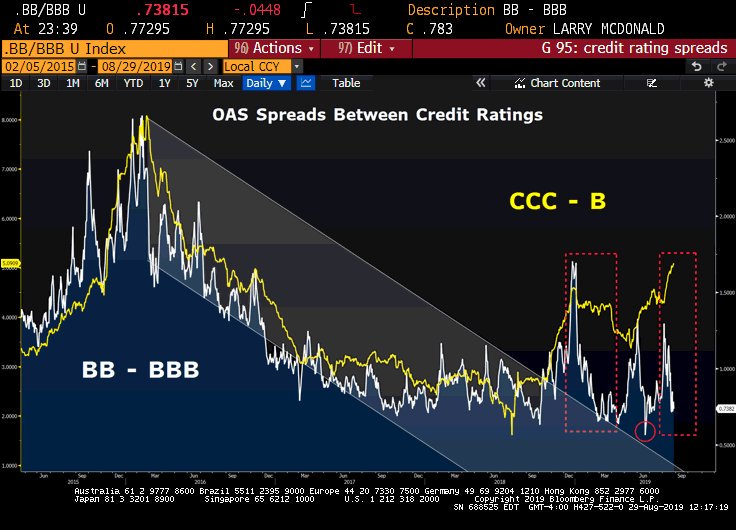 The junk of the junk, why has CCC-rated paper dramatically underperformed while capital is flying into BB credits in the U.S. In the middle of the ‘everything rally’ – one would expect beta-chasing to drive demand for the highest yield, worst rated high bonds. That’s NOT happening. To us, this is an important signal, we’re very close to the ugly credit saturation point. Even with colossal pressure from central banks to reach for yield, rising default risks are keeping investors away from CCCs. What does this mean for U.S. stocks? Pick up our next report, just click on the link below.
Don’t miss our next trade idea. Get on the Bear Traps Report Today, click here
 The 2s 10s US yield curve spread inverted for the first time since mid-2007 on Tuesday. Despite many other areas of the curve having inverted earlier this year (3-month / 10-year for example), the widely followed 2s / 10s curve had the media’s attention throughout the day and helped contribute to the significant equity sell-off. When coupled with slowing global growth and rising geopolitical tensions, markets ran-away in fear, from this classic recession indicator.