
*Our institutional client flatform includes; financial advisors, family offices, RIAs, CTAs, hedge funds, mutual funds, and pension funds.
Email tatiana@thebeartrapsreport.com to get on our live Bloomberg chat over the terminal, institutional investors only please, it’s a real value add.
Don’t miss our next trade idea. Get on the Bear Traps Report Today, click here
September 2, 2020: All-time highest VIX on a day with the S&P 500 touching the highest level ever.
Equity Market Volatility Divergence
Strange times indeed. This week we observed two spectacular divergences. First, single-name equity option activity relative to indices was near all-time, historic extremes. Second, Nasdaq volatility (VXN) traded at a multi-year premium to the CBOE VIX. What is going on here? This post is from August 28, the latest update is here.
Nasdaq Volatility Trading Very Rich to the S&P 500
 With the Nasdaq QQQs up close to 40% this year, there are lots of gains to protect. Nasdaq vol has been trading very expensive relative to the VIX. Investors are paying up for protection.
Climax Points
Think of bull and bear market capitulation climax points. At the end of a bear’s mauling, dozens if not hundreds of rallies have failed. Long, exhaustive bear markets break the hope and spirit of more and more investors – until the point of maximum capitulation. There is NO one left to sell, think March 2009. Each failed rally delivers deeper losses to the market participants and every one of the “fast money” tourists have run for the hills. All that’s left is an empty meadow, the genesis of a new bull market is born.
Now, let us think of the beast inside a great bull. Dozens if not hundreds of dips have been bought. With each victory, fast money rookies share their battle stories with more and more friends at cocktail parties. Tourists arrive, busload after busload empty into the market, it’s all good, “this is easy.” With each triumphant buy of the dip, investor confidence turns into a dark shade of hubris and more and more capital pours in. Why not, the mad mob is playing with the house’s money. Now think of 100 hedge funds, all up 3% for the month. Why not take 1% of those gains and buy calls on the largest, highest momentum equities. Worst case you end up 2% for the month, best case you deliver 5%, after all, you take home at least 20% of the profits. One conclusion, month-end (Aug 31) / quarter-end (Sept 30) is about to get very interesting.
August 2020
The first 20-ish days of the month were the quietest in a long time. If we look at ten-day, realized equity market volatility, it plunged to nearly 6 vol, 2020’s nadir. On the other hand, this week as month-end drew closer – we experienced two, 1% trading range days with close to forty handle swings in the S&P 500. For sure, someone is monetizing gains.
VIX Up – S&P Up
 On Wednesday and Thursday this week, the Chicago Board Options Exchange’s CBOE Volatility Index (VIX) was more than 5% higher each day, with the S&P 500 up both of those days. How rare is this? Very. We could only find ten days in the last decade with the S&P up 1% with the VIX closing higher. This is especially rare with the market at all-time highs. In a healthy bull market at its best levels, the VIX should be in the low teens, NOT the lows 20s.
Two Month vs. 8 Month VIX Futures Contracts
 One of our 21 Lehman Systemic Risk Indicators are found in the trading spread between the two and 8-month VIX futures options contracts. To keep this as simple as possible, all we are doing here is measuring the cost of protection. How much more expensive is buying short term vs. long term insurance? The above data is mindblowing. This week, the cost to buy the two-month VIX future reached nearly 5 handles more than the eight-month contract. Elephants leave footprints. When large hedge funds need or want to pay-up for short term protection from a market crash that is one thing, BUT the price they are paying this week is VERY extreme with a market at all-time highs. As you can see above, the 2-8 spread is wider today than nearly every financial panic in the last five years. In a healthy, “risk-on” (where risk is being put on) bull market – this spread should be in “contango” – the two-month VIX futures contract should be ALOT cheaper than the 8-month variety.
Paying Up for Upside Risk
Over the past few weeks, there has been a massive buyer in the market of Technology upside calls and call spreads across a basket of names including ADBE, AMZN, FB, CRM, MSFT, GOOGL, and NFLX. Our friends at Citadel calculate, over $1 BILLION of premium spent and upwards of $20B in notional through strike – this is arguably some of the largest single stock-flow we’ve seen in years, they noted. We agree someone is playing with House Money, and they’re rolling large.
“The average daily options contracts traded in NDX stocks to rise from ~4mm/day average in April to ~5.5mm/day average in August (a 38% jump in volume). Given this group of 7 stocks accounts for a ~40% weighting in the NDX, the outsized volatility buying in the single names is having an impact at the Index level. So why are Vols moving yesterday/today when this call buying has been taking place for weeks? Yesterday CRM, one of the names we have seen outsized flow, rallied 26% on earnings – a less than ideal outcome for those short volatility from all the call buying. As the street got trapped being short vol, other names in the basket saw 3-4 standard deviation moves higher as well – yesterday FB rallied 8% (a 3 standard deviation move), NFLX rallied 11% (a 4 standard deviation move), and ADBE rallied 9% (a 3 standard deviation move). The most natural place to hedge being short single name Tech volatility is through buying NDX volatility. As such, there has been a flood of NDX volatility buyers with NDX vols up about 4 vol points in 2 trading days. And if NDX volatility is going up, SPX volatility/VIX will eventually go up too.” Citadel
What are the conclusions? What does this tell us about the path forward? What other instances of this occurrence have we seen historically? Email tatiana@thebeartrapsreport.com for our full report.
 “The models are showing something unprecedented this morning, two storms make landfall within 24 to 36 hours in essentially the same spot.”
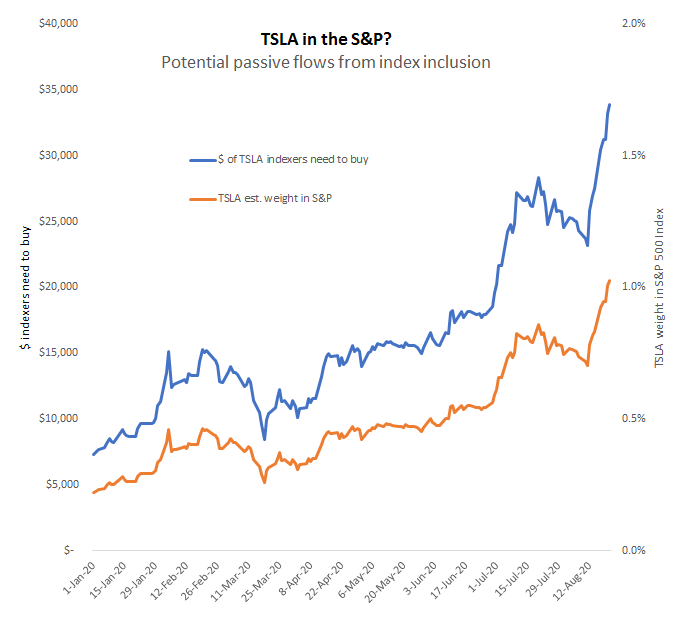 We believe it is likely that the Inclusion Committee at S&P waits until mid-September to announce the inclusion of Tesla in the S&P 500. This would coincide with the quarterly rebalance (Sep 21).
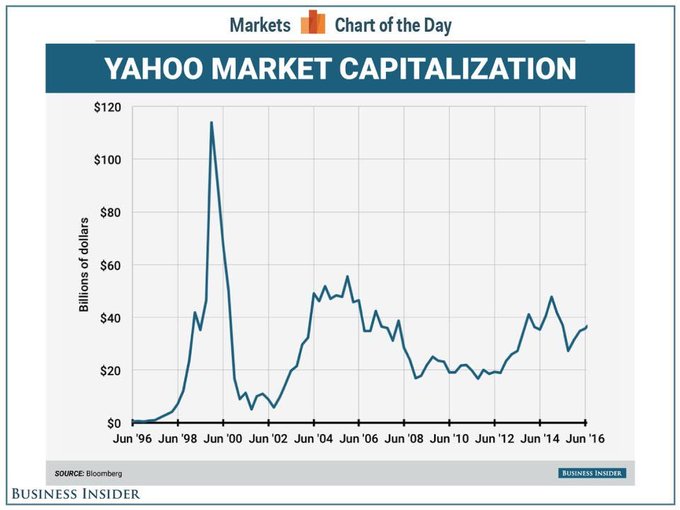 Yahoo was added to the S&P 5000 on December 7, 1999. Its market cap was nearly $92B – then it spent the next 15 years between $5B and $50B valuation.
 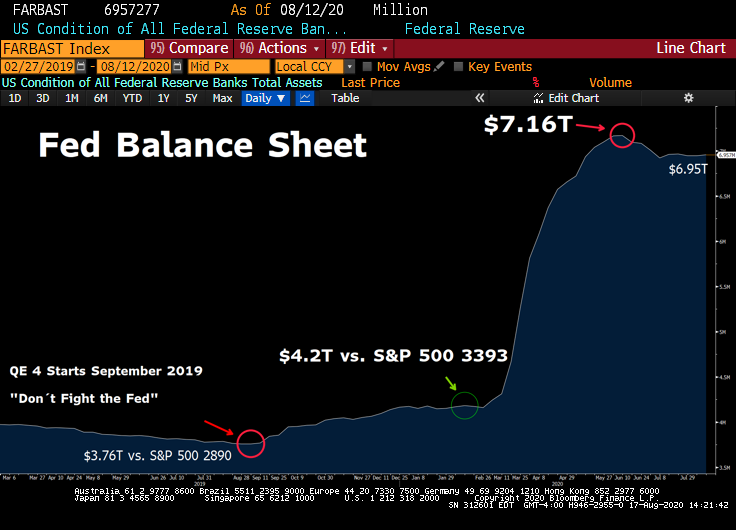 A: We keep hearing this is in relation to liquidity vs. securities held. So “securities held” are up LARGE (mortgage-backed securities, treasuries, corporate bonds, municipal bonds), but liquidity measures, swap – repo facilities are down a lot. So, the total balance sheet has come down from $7.169T on June 10, to $6.957T today. Above all, roll off of repos and $ swaps from CBs has been a drain on asset side fed balance sheet. These two things have largely happened in tandem as Fed has restored markets to a plethora of liquidity. Fed 84 day swap lines got up to $400b, that number is coming down a lot, and the same is the case for repo. The market can now handle both. As these things come out, Fed balance sheet will start moving higher again as the +$80b a month of UST purchases becomes a marginal driver. For now, PDCF, $ swap lines, repo etc. all the emergency measures that aren’t getting rolled in full and coming off b/s are taking the wind out of the growth of Fed asset side. The bottom line, real liquidity is being pulled from the system.
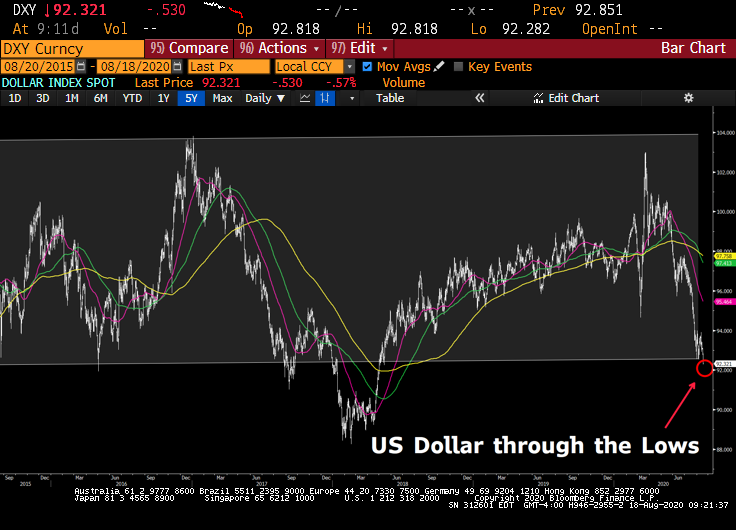
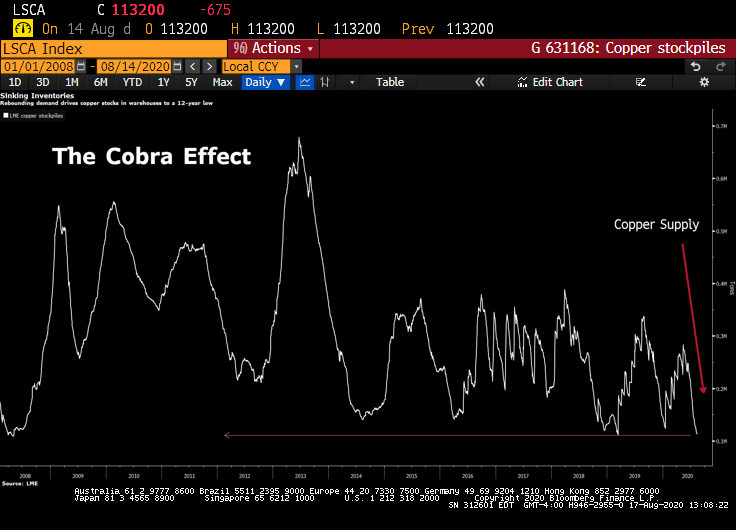 The London Metal Exchange’s global warehouse network is holding the least copper since 2008 in the latest sign of an economic recovery. The decline in inventories over the past few months coincides with record-breaking shipments of copper into China, where demand for the metal in the manufacturing sector has surged since lockdown restrictions were eased. Inventories tracked by the LME now stand at 110,000 tons, down 61% from this year’s peak, per Bloomberg.
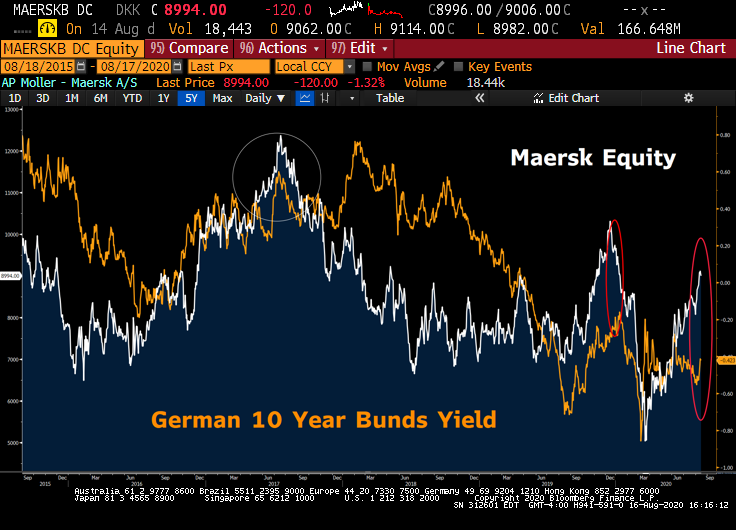 The last time MAERSK equity was near 9000, German bund yields were 20 to 60bps higher. As one of the world´s top exporters, German bond yields have maintained a strong correlation to shipping costs, until now.
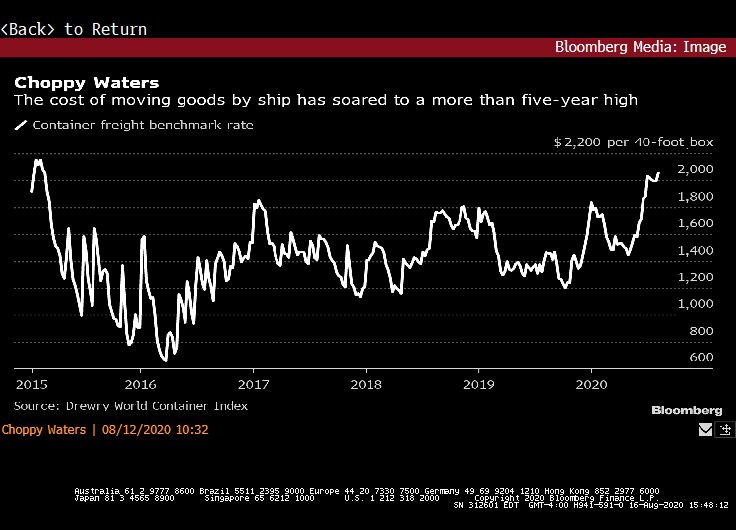 Capacity constraints have driven up rates for international shipments this year whether by sea, air or land, further complicating matters for supply-chain managers dealing with the effects of Covid-19 on their businesses. The cost of moving goods by ship has climbed 12% in 2020 to the highest since February 2015, according to the Drewry World Container Index. Ocean-liner rates have benefited from the industry being more disciplined with idle capacity, coupled with support from general rate increases and peak-season surcharges, per Bloomberg Intelligence. Must see our
  When CPI food makes a 2-3 standard deviation move, it´is hard to ignore. For weeks there was meaningful divergence. Commodities were screaming higher while bond yields were looking the other way, no cares. That all changed this week.
  What is interesting is – in Q2 2020, hard commodities led this move higher, and “softs” (agriculture plays) really started to play catch up in recent weeks –
  There are reports of up to 30% of China´s agricultural output could be at risk. China facing food shortage after months of flooding, infestations. Xi’s description of food waste as ‘shocking and distressing’ could portend looming food shortage. Per Asian news outlets, this is the second time that Xi has given instructions on China’s grains within a month, raising eyebrows among China watchers as a sign of a possible food crisis.
  Cloud and SaaS (software as a service) equities widely underperformed value equities such as Berkshire Hathaway this week. In our view, investors continue to realize they are not positioned correctly being overweight technology with rising inflation expectations. From the Tea “Austerity” Party in 2010 to an MMT fueled, junkie-juiced fiscal spending overdose in 2020? We’ve come a long way baby. Hard to process a $4 to $5 trillion Federal deficit under a Republican Administration without concluding that either inflation is around the corner or the dollar is going to substantially weaken or most likely both. The current inflation picture (August 2020) is meaningless. Markets are starting to price in the 5-10 year forward path.
  The GM vs. Netflix debate is the ULTIMATE “Stay at Home” vs. “Re-Open” conversation. Think of Netflix, no free cash flow, or real earnings. The company simply takes all incoming cash and builds a Capex funded content war chest. It’s a cash-burning inferno. Terminal Value (TV) is the present value of all future cash flows, with the assumption of perpetual stable growth in some cases. Terminal value is used in various financial tools such as the Gordon Growth Model, the discounted cash flow, and residual earnings computation. However, it is mostly used in discounted cash flow analyses. Any hint of inflation can DRAMATICALLY alter the company’s valuation built on a high terminal value element. If all the company’s value is found in the projected, long-term (5-10 year) future cash flows, and the probability of inflation rises 3-5 years out, those FUTURE cash flows are WORTH far LESS! To us, this is what’s shaking tech at its core, large tremors (
