Join our Larry McDonald on CNBC’s Trading Nation, Wednesday at 3:05pm ET
Pick up our latest report here:
Don’t miss our next trade idea. Get on the Bear Traps Report Today, click here
Breaking: *BLACKROCK 2Q LONG-TERM NET INFLOWS $93.5B VS $80.3B QTR AGO
– Assets under management $5.69 trillion, estimate $5.61 trillion
– 2Q iShares net inflows $73.76 billion vs $64.48 billion q/q
Lets look over a few important developments clients were talking about this week – focus was on the J.P. Morgan investor (quarterly) conference call. As the largest bank in the United States – it’s important to dig through the data, trends and themes found in the transcript below.
Our Takeaways
 The relationship between the Fed’s balance sheet and equity prices is clear – the question is, how will stocks react to central bank deleveraging?
As most investors know – Wall St. expects the Federal Reserve to initiate a reduction in their $4.4 trillion balance sheet this September. J.P. Morgan made some startling forecasts this week relative to the impact of the Fed’s planned actions.
Deposit Outflows
Federal Reserve deleveraging will lead to loss of deposits at banks, somewhere between 50%-66% of reduction. Looking forward, $1.5T Fed SOMA (balance sheet) reduction would result in $750B – $1T of deposit outflows from the banks.
From Marianne Lake, JPMorgan Chase & Co. – CFO and EVP
“The Fed is communicating clearly and has every intention to make this gradual and predictable, things can change, and we should just be prepared for that. Not to say that, that would have a particularly significant impact necessarily on JPMorgan but that, that would just be a downside risk, not a probability. So on the balance sheet, it’s still the case that we expect to start seeing normalization in the balance sheet in September. We’re still actually calling for the next rate hike in December; the market is calling for March of next year. And as we said, the communication has been pretty consistent and pretty clear across the Fed space, which is to say that it’s mostly priced into the market at this point as far as we can tell. And so based upon what we’ve understood, all things equal, we would see the balance sheet shrink about $1.5 trillion over about the next 4 years. So that would ultimately slow growth, not stop growth. If we saw $1.5 trillion come out of the Fed’s balance sheet, empirical evidence would suggest that we don’t see dollar-for-dollar reduction in deposits. So if you just pick a point between $500 billion and $1 trillion of deposit outflows, at our 10% market share, that would be about $75 billion over 4 years.”
Doing some work here is a necessity – the unintended consequences of central bank policy actions are many and will be disruptive. As new supply – U.S. treasuries which need to be sold to fund government spending – comes to market, without the FOMC there cash will pour out of the U.S. banks.
Money Flow into Stocks, Former Scared Money Coming Back
In the second quarter, JPM witnessed $8B leave deposits into stocks. We have not seen this type of shift into equities in a long time. This is a positive for BlackRock / Pimco’s of the world – as bank deposits shift into ETFs and asset management products, they are the big winners.
BlackRock, Pricing in Some Central Bank Love
 Over the last year the Federal Reserve has been buying $20 to $35B a month of Treasuries and Mortgage Backed Securities. As bonds mature, the Fed has been reinvesting the proceeds – QE (asset purchases) has been very much alive and well. As the Fed steps away from reinvestment – there will be more treasuries for investors to buy. J.P. Morgan is anticipating substantial bank deposit outflows, these assets should make their way over to the portfolio managers at companies like BlackRock. As you can see (top right above), just as the Fed signaled balance sheet reduction, BlackRock equity is up 17% since the March FOMC meeting. Over the same time, the XLF (Financial Select Sector SPDR Fund) is only 6% higher – BlackRock investors have been pricing in some central bank love.
Balance Sheet Winners
As the Fed takes DOWN their balance sheet – BlackRock and Pimco will be the net Treasury buyer. In other words, the Fed’s planned $1.5T reduction its balance sheet – a lot of these assets get reallocated over to BlackRock and Pimco, 20bps on $1.5T is real money.
J.P. Morgan CEO Jamie Dimon on Washington Policy’s Economic Overhang
“Since the Great Recession, okay, which is now 8 years old, we’ve been growing at 1.5% to 2% in spite of stupidity and political gridlock because the American business sector is powerful and strong and is going to grow regardless — when they wake up in the morning, they want to feed their kids, they want to buy a home, and they want to do things. It’s the same with American businesses. My — what I’m saying is that it would be much stronger growth had we made intelligent decisions and were there not gridlock. And thank you for pointing it out because I’m going to be a broken record until this gets done. We are unable to build bridges. We’re unable to build airports. Our inner city schoolkids and are not graduating. I was just in France. I was recently in Argentina. I was in Israel. I was in Ireland. We met with the Prime Minister of India and China. It’s amazing to me that every single one of those countries understands that practical policies that promote business and growth is good for the average citizens of those countries, for jobs and wages, and that somehow this great American free enterprise system, we no longer get it. And so my view is it — and corporate taxation is critical to that, by the way. We’ve been driving capital and bringing it overseas, which is why there’s $2 trillion sitting overseas, benefiting all these other countries and stuff like that. So if we don’t get our act together, we can still grow. I would say it’s unfortunate, but it’s hurting us. It’s hurting the body politic. It’s hurting the average American that we don’t have these right policies. And so no, in spite of gridlock, we’ll grow at — we can grow at 1.5% or 2%. I don’t buy the argument that we’re relegated to this forever; we’re not. And if this administration can make breakthroughs in taxes and infrastructure, regulatory reform — we have become the most — one of the most bureaucratic, confusing, litigious societies on the planet. It’s almost an embarrassment being an American citizen traveling around the world and listening to the stupid (expletive) we have to deal with in this country. And at one point, we all have to get our act together or we won’t do what we’re supposed to do for the average Americans. And unfortunately, people write about the thing like it’s for corporations. It’s not for corporations. Competitive taxes are important for business and business growth, which is important for jobs and wage growth. And honestly, we should be ringing that alarm bell, every single one of you, every time you talk to a client.”
Pick up our latest report here:
Don’t miss our next trade idea. Get on the Bear Traps Report Today, click here
J.P. Morgan CEO Jamie Dimon
Good morning, everyone. I’m going to take you through the earnings presentation, which is available on our website.
The firm reported record net income of $7 billion, EPS of $1.82 and a return on tangible common equity of 14% on revenue of $26.4 billion. Included in the result is a legal benefit of approximately $400 million after tax from a previously announced settlement involving the FDIC’s Washington Mutual receivership.
Other notable items, predominantly net reserve changes and legal expense, were a small net negative this quarter. So underlying adjusted performance was really strong. And highlights for the quarter include: average core loan growth of 8% year-on-year, reflecting continued growth across products; double-digit consumer deposit growth; strong card sales, up 15%, and merchant volume, up 12%; #1 Global IB fees, up 10%; and we delivered record net income in both Commercial Banking and in Asset & Wealth Management.
Some more details about the quarter. Revenue of $26.4 billion was up $1.2 billion or 5% year-on-year, with the increase predominantly in net interest income, up approximately $900 million, reflecting continued loan growth and the impact of higher rates. Fee revenue was up $300 million year-on-year, but adjusting for one-time items in both years, was down modestly, with lower Fixed Income Markets, Mortgage and Card revenues, all as guided, being offset by strong fee revenue growth across remaining businesses.
Pick up our latest report here:
Don’t miss our next trade idea. Get on the Bear Traps Report Today, click here
Adjusted expense of $14.4 billion was up a little less than $400 million year-on-year, with auto leases being the biggest driver, but also including the impact of the FDIC surcharge and broader growth being offset by lower compensation.
Credit costs of $1.2 billion were down $187 million year-on-year on [lower] reserve builds as a net reserve build in Consumer of a little over $250 million, driven by Card, was offset by a net release in Wholesale of a little under $250 million, driven by Energy.
Anticipating you may have questions, given the recent stress in oil prices, I would emphasize that we guided to expect reserve releases, given we started the year with $1.5 billion of energy-related reserves. And with oil prices having found a lower but seemingly stable level, we feel appropriately reserved.
Shifting to balance sheet and capital. We ended the quarter with binding fully phased-in CET1 of 12.5% under the standardized approach, with the improvement being primarily driven by capital generation, offset by net loan growth. We’ve been hovering around the inflection point under the Collins Floor for a while now and expect standardized to remain our binding constraint from here. Given that, we’ve replicated this page under standardized rules in the appendix for you to read.
Pick up our latest report here:
Don’t miss our next trade idea. Get on the Bear Traps Report Today, click here
Balance sheet, risk-weighted assets and SLR all remained relatively flat from the prior quarter. I would also note that we remain compliant with all liquidity requirements. We were pleased to announce growth repurchase capacity of up to $19.4 billion over the next 4 quarters. And the board announced its intention to increase common stock dividends 12% to $0.56 a share effective in the third quarter. In addition, we recently submitted our 2017 resolution plan, which we believe fully addresses outstanding regulatory feedback.
Consumer & Community Banking: CCB generated $2.2 billion of net income and an ROE of 16.5%. We continue to grow core loans, up 9% year-on-year, driven by strength in Mortgage, up 12%; Card and Business Banking were each up 8%; and auto loans and leases were also up 8%, driven by strong lease performance from our manufacturing partners.
Deposit growth continues to be strong, up 10% year-on-year, with household retention remaining at historically high levels. We saw improvement in our deposit margin, up 16 basis points. Sales growth in Card was very strong again this quarter, up 15%, as new accounts mature. And merchant processing volumes grew double digits, up 12%.
Revenue of $11.4 billion was flat year-on-year. But recall that last year included a net benefit of about $200 million, principally driven by the Visa Europe gain. So excluding that revenue, it was up modestly.
Consumer & Business Banking revenue was up 13% on both strong deposit growth and margin expansion. Mortgage revenue was down 26% as higher rates drove higher funding costs, which, together with lower MSR risk management and lower production margins, put pressure on mortgage revenue year-on-year. In addition, revenue included a reduction of approximately $75 million to net interest income related to capitalized interest on modified loans.
Pick up our latest report here:
Don’t miss our next trade idea. Get on the Bear Traps Report Today, click here
And Card, Commerce Solutions & Auto revenue was down 3%, but if you exclude the noncore items I mentioned, was up 2%, with NII growth on higher loan balances and higher auto lease income, predominantly offset by the continued impact of investments in Card new account acquisitions. Expense of $6.5 billion was up 8% year-on-year on higher auto lease depreciation, higher marketing expense and continued underlying business growth.
Credit Contagion
U.S. banks are witnessing a significant surge in credit card defaults – something we’re tacking closely.
Finally, on credit performance. Card Services drove higher net charge-offs year-on-year, but still within our guidance for the full year of less than 3%. Net reserve builds were around $250 million, building $350 million in Card, $50 million in Business Banking and $25 million in Auto, in part due to loan growth and in part higher loss rates in Card. This was partially offset by a release of $175 million in Mortgage, reflecting continued improvement in home prices and lower delinquencies.
To touch on consumer delinquency trends, in particular in Card, we are seeing some early signs of normalization, which are generally in line with our expectations and our credit risk appetite. And in Auto, our trends are relatively flat.
Corporate & Investment Bank: CIB reported net income of $2.7 billion on revenue of $8.9 billion and an ROE of 14.5%. In Banking, IB revenue of $1.7 billion was up 14% year-on-year, with strong performance across products but particular strength in DCM. We ranked #1 in Global IB fees and #1 in North America and EMEA. We were also #1 in ECM and DCM globally, in each case gaining share for the first half of this year.
Advisory fees were up 8%, benefiting from a large number of deals closed in this quarter. Equity underwriting fees were up 29%, better than the market, but relative to a weak prior year quarter. With a strong market backdrop and supportive valuations, we saw continued momentum in global issuance, especially IPOs. And debt underwriting fees were up 5% from a strong quarter last year, driven by the high flow volume of repricing and refinancing activity, even with fewer large acquisition financings.
In terms of the outlook, we expect IB fees in the second half of the year to be down year-on-year, given that we had the highest IB fees on record for a third quarter last year. That said, overall sentiment remains positive. ECM issuance is expected to continue, given the stable market backdrop. And the M&A backlog is healthy, with conditions remaining constructive for refinancing activity.
Pick up our latest report here:
Don’t miss our next trade idea. Get on the Bear Traps Report Today, click here
Treasury Services revenue of $1.1 billion was up 18%, driven by higher rates as well as operating deposit growth. Lending revenue of $373 million was up 35%, reflecting lower mark-to-market losses on hedges of accrual loans.
Moving on to Markets, total revenue was $4.8 billion, down 14% year-on-year. Fixed Income revenue was down 19%, with decent performance across products relative to a very strong second quarter last year, which was driven by higher levels of volatility and activity broadly, including as a result of Brexit. This quarter conversely can be characterized by a lack of idiosyncratic events resulting in sustained low volatility, reduced flows and continued credit spread tightening, all of which impacted activity levels in rates, credit trading and commodities.
Emerging market performance was relatively stronger on a weaker dollar and lower rates as well as some regional events. Equities revenue was down 1%. In derivatives, on the structured side, we did quite well and outperformed. And on the flow end, we held our own in a quiet and therefore challenging environment. Prime was a bright spot as we are realizing the benefit of the investments we’ve been consistently making.
Before I move on, I would also like to remind you that the third quarter of 2016 markets revenue was also a record since 2010. In fact, it was about $1 billion more than the average of the previous 5 years. And so while that isn’t guidance, it is context as this quarter has felt quiet, more like prior years.
Securities Services revenue of $982 million was up 8%, driven by higher rates and higher asset-based fees on higher market levels. And remember, the second quarter benefits from dividend seasonality. Finally, expense of $4.8 billion was down 5% year-on-year, driven by lower compensation expense and the comp-to-revenue ratio for the quarter was 28%.
A look at Commercial Banking. Another quarter of excellent performance with record revenue and net income and an ROE of 17%. Revenue grew 15%, driven by deposit NII as the rate environment continues to be favorable and on higher loan balances with spreads remaining steady. IB revenue was down due to the lack of large deal activity during the quarter, but underlying flow activity was solid across products as momentum continued and forward pipelines appear strong.
Pick up our latest report here:
Don’t miss our next trade idea. Get on the Bear Traps Report Today, click here
Expense of $790 million was up 8%, and we expect this to grow modestly in the second half as we continue to execute on the investments in bankers and technology that we outlined at Investor Day.
Loan balances were up 12% year-on-year and 3% quarter-on-quarter. C&I loans were up 4% sequentially, ahead of the industry, on broad-based growth across markets and within specialized industries. CRE saw a growth of 2%, in line with the industry, but below last year’s pace on reduced origination activity as we continue to be selective at this stage in the cycle. Finally, credit performance remained very strong with a net charge-off rate of 2 basis points.
Leaving the Commercial Bank and moving on to Asset & Wealth Management. Asset & Wealth Management reported record net income of $624 million, with pretax margin of 32% and an ROE of 27%. Revenue of $3.2 billion was up 9% year-on-year, driven primarily by higher market levels, but also strong banking results on higher deposit NII. Expense of $2.2 billion was up 4% year-on-year, driven by a combination of higher external fees and compensation on higher revenue.
This quarter, we saw net long-term inflows of $9 billion with positive flows across multi-asset, fixed income and alternatives being partially offset by outflows in equity products. We saw net liquidity outflows of $7 billion, largely due to specific client deal-related cash needs. Record AUM of $1.9 trillion and overall client assets of $2.6 trillion were both up 11% year-on-year on higher market levels. Deposits were flat year-on-year and down 5% sequentially, reflecting the beginning of balance migration into investment-related assets, as expected, and those balances remained with us. Finally, loan balances were up 9% year-on-year, driven by mortgage, up nearly 20%.
Corporate reported net income of $570 million, which includes the legal benefit I mentioned earlier of $645 million in revenue or $400 million after tax. And a reminder, this is the same $645 million that was publicly announced in August 2016 and represents partial reimbursement for costs that we have previously incurred and paid that remained the responsibility of the WaMu receivership.
Pick up our latest report here:
Don’t miss our next trade idea. Get on the Bear Traps Report Today, click here
Outlook: starting with the quarter, we guided second quarter NII (net interest income) to be up about $400 million from the first quarter, given the rate — the March rate hike, but you’ll see that the NII for the quarter increased by only $150 million. While we did fully realize the expected benefit of higher rates and continued growth, against that, we had the onetime $75 million mortgage adjustment as well as lower CIB market NII.
These effects, together with modest downward pressure from lower 10-year rates, with all other things equal, point to a full year number of closer to $4 billion up rather than the previous $4.5 billion, but with a potential to be higher if we continue to benefit from tailwinds of lower deposit reprice. So you will see we have adjusted the guidance, but it will be market-dependent. And any near-term forecast is sensitive to a number of factors, none of which changes our conviction that we will ultimately deliver $11 billion plus of incremental NII as rates normalize, and we are well on our way.
On expense, we continue to expect full year adjusted expense of $58 billion. Second quarter was in line with our expectation and our guidance at a little better than $14.5 billion, which is also where we expect the third quarter to come in.
Finally, we have revised our full year core loan growth down to 8% year-over-year, but a couple of comments. First, we are seeing slightly lower growth than we expected coming into the year, it is only modestly lower. And more importantly, we remain encouraged by the consistency and breadth of client demand across products.
Secondly, we noted that mortgage could be a big driver. And with a smaller market and a more competitive environment, fewer loans have met our hurdle rate. And of course, we remain appropriately focused on quality and not quantity of growth. And as such, loan growth is an outcome, not a target.
So to wrap up, we are very pleased with the firm’s performance this quarter, with all of our businesses showing broad strength. We maintained or improved leadership positions [above] delivering the benefits to both clients and shareholders of our operating model and our continued investments. We remain encouraged by the growth outlook for the global economy and expect continued solid growth here in the U.S., which positions us well going forward.
Pick up our latest report here:
Don’t miss our next trade idea. Get on the Bear Traps Report Today, click here


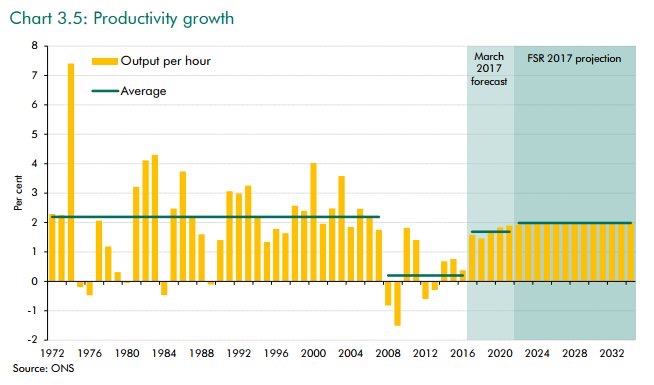 A picture says a thousand words – stubbornly low wage growth is being held back by an army of young people still sitting outside the labor force. Blaming the 2008 financial crisis for this dynamic is the biggest copout in modern economics. Just look at 2012-16 data, it’s clear this problem is structural NOT cyclical at this point.
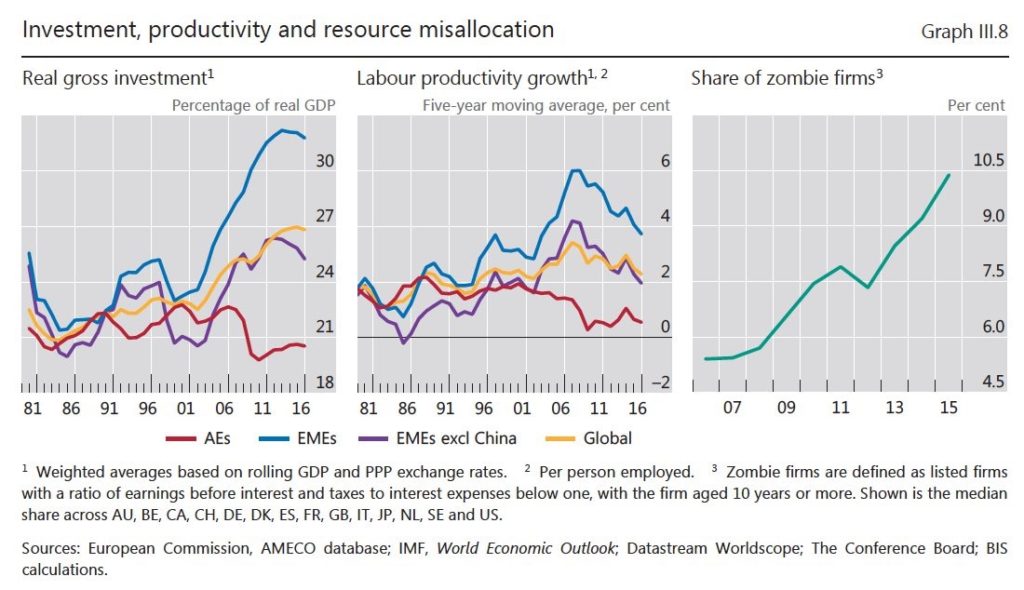 Lots of financial engineering – NOT enough real job creation. Low rates for too long has created “Zombie firms (top right above).” Zombie firms are defined as public companies with EBITDA (earnings before interest, taxes, depreciation and amortization) to interest expenses ratio below one.
 We have an index of our 21 Lehman Systemic Risk Indicators, the Chicago Fed’s Financial Conditions Index is similar above. Over much of the last five years – as financial conditions tightened, gold surged (see above). On the other hand, in 2017 we’ve witnessed a regime change. This year as the Fed has hiked rates twice – financial conditions eased – NOT tightened. As long as financial conditions are NOT stressed – Yellen’s Fed has runway on the hawkish side to pull back accommodation. Relationship to gold? A year ago today there were close to $15T of negative yielding bonds on earth – this number is now well below $7T today. As bond yields have surged – globally gold is far less attractive to hold – the macro impact on this metal has been profound.
 We must keep in mind, in February there was only a 17% probability of a Fed rate hike in March (according to Wall Street’s economists). This was before the Federal Open Market Committee (FOMC ) began shifting market expectations and ultimately tightened (hiked rates) in March. Rule #1, more often than NOT – Wall St. gets the Fed wrong. Today, the entire street has their eye on September SOMA reduction – rate hikes are (near) unanimously a December issue in terms of street expectations. Our Bear Traps Report research team meticulously measures the breath of crowded trades on Wall St. – very often this is where alpha is found, going the other way.
 In Reflation Trade Revival mode, wheat is trading like Tesla equity. The September wheat futures contract (MWU7) is up 50% since May 15th, 2017. Energy stocks are as under-owned as any sector in the last decade relative to growth. As a result, we’re seeing a colossal sector rotation back into value names (commodity sector equities) as cash hemorrhaging out of big tech (FAANG stocks).
