Join our Larry McDonald on CNBC’s Trading Nation, Wednesday at 3:05pm ET.
Pick up our latest report here:
Don’t miss our next trade idea. Get on the Bear Traps Report Today, click here
 Here’s our interview with the Swiss business newspaper Finanz und Wirtschaft.
Larry McDonald, Editor of the Bear Traps Report, predicts a full-blown crisis in the emerging markets and outlines why this also could offer some promising opportunities for investors. Keep in mind, McDonald is NO perma-Bear, The Bear Traps Report with Larry McDonald; Capitulation Climax in Energy – August 18, 2017-2.
See the latest on The Bear Traps Report with Larry McDonald; Late Cycle Mojo in Energy – March 28, 2018_4
His book has been published in 12 languages, over 650,000 copies sold.
Pressure on emerging markets has been rising for months. For the past decade, a river of easy money rushed into developing countries. Now, that trend is reversing. Rising interest rates and trade wars are creating havoc. The Turkish lira and the Argentine peso have crashed. China’s stock market is stuck in a bear market. For Larry McDonald, that’s only the beginning of a full-blown crisis. The renowned editor of the macro research platform Bear Traps Report knows what he’s talking about. As a former distressed bond trader at Lehman Brothers, he experienced the emergence of the 2008/09 financial crisis at the center of the storm. Now, his biggest concerns revolve around the massive debt binge which took place in the emerging markets. He warns that mega-cap tech stocks like Apple, Amazon and Google will be the most vulnerable when the crisis spreads to the financial markets of the developed world.
Mr. McDonald, as a former bond trader at Lehman Brothers you were one of the early voices (profits of over $120m) warning of the subprime mortgage crisis. Where do you spot the most dangerous risks in the financial markets today?
China on Steroids Now Facing Tariffs
 In our view, the new subprime risk is found in the emerging market’s embedded leverage. There is a lot of concern about emerging markets debt, especially about the amount of Dollar denominated debt. For instance, the Chinese banking system is $44 trillion in size. That’s almost three times the US banking system and the Chinese economy is already weakening. Total global debt (sovereign, corporate and household) has surged by nearly 75% since Lehman’s failure ten years ago, per the McKinsey Global Institute. The great enablers, Central Banks have blood on their hands in my view.
Tariffs and Leverage
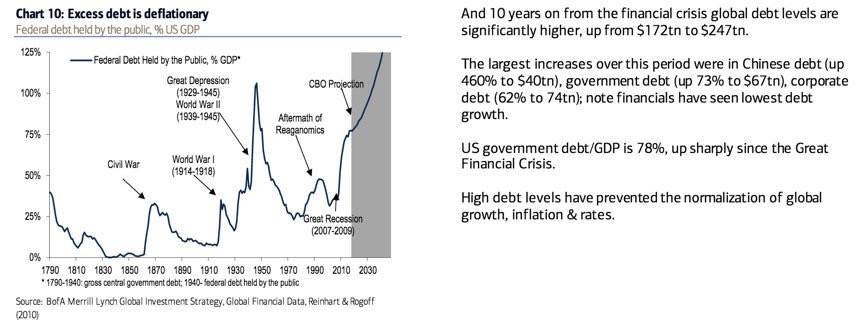
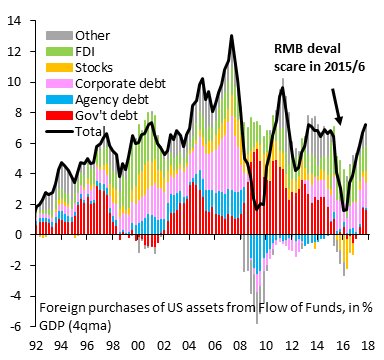
Since Lehman, government debt in China is 73% higher to near $40 trillion, with corporate debt and shadow leverage surging 65% to $75 trillion, per BofA above. We’re at the point where, if China keeps growing at 6-8% per year, that growth has to come from somewhere. G8 developed market countries (like the US) have finally figured out they’re holding the bag, they want that growth back. So, you have a highly leveraged situation where you’re putting tariffs on. I don’t think the Trump administration is aware of how dangerous this is. When you pull cash flows (tariff impact) from a highly leveraged entity, bad things happen.
China Manufacturing Leverage Panic
Manufacturing is under substantial stress. After a multi-year rally, plunging revenue and sharply declining profit growth led to a poor showing in the latest Beige Book in China. Manufacturing’s deteriorating sentiment has taken place before any meaningful American tariffs have been imposed. Without a trade deal, this situation will likely get worse. The pace of borrowing is near 42% percent of firms, that’s the highest since 2012. It sure smells a lot like panic indeed. China fiscal and monetary stimulus is on the way, but so far we have NOT seen it in the data.
Why is this situation so dangerous?
 It’s not just China. It’s Turkey, it’s India’s banking system*, it’s Brazil, it’s all these countries which have issued so much debt. Since Lehman, there are trillions and trillions of new Dollar and Euro denominated debt issued globally and now it’s starting to come into a massive default cycle. Ten years after Lehman’s failure, global debt levels have surged from $170 trillion to $250 trillion, per BofA. At the end of the day, the Federal Reserve and the European Central Bank are going to get the blame because they have been far too accommodative. In the U.S., corporate credit quality is in the worst shape.
India Credit Risk on the Rise
 *India’s banking system’s overhang of (near $400B in our view) bad loans is another full-blown crisis that stymies growth and shows no signs of an early resolution.
Pick up our latest report here:
Don’t miss our next trade idea. Get on the Bear Traps Report Today, click here
What could trigger this wave of defaults?
The Dollar plays a key part. It’s like a global wrecking ball: when the Dollar moves up and emerging markets currencies drop their interest costs are exponentially more difficult to pay off. In the case of Turkey, the currency is down around 40% against the Dollar this year. So, if you’re a Turkish company and the interest payment was 1 million Dollars per quarter you are looking now at a payment of 1.4 million Dollars per quarter.
Emerging Markets, Taking a Beating
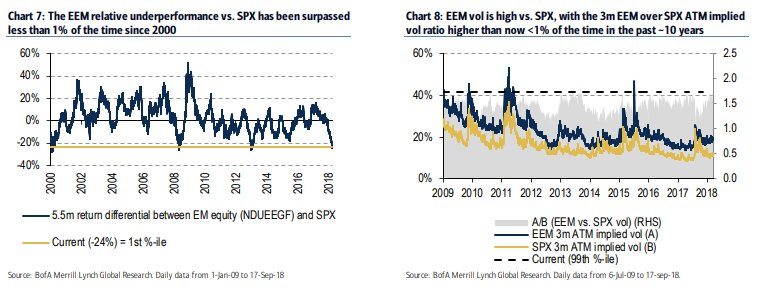
There has NEVER been this much capital hiding out in the USA.
Global Surge in Bond Yields in 2018
Turkey: 11.59% to 20.30% +871
Russia: 7.73% to 8.71% +117
Italy: 1.74% to 2.83% +112
India: 7.16% to 8.08% +92
Brazil: 10.94% to 11.78% +84
China: 3.44% to 3.69% +35
Canada: 2.09% to 2.43% +34
US: 2.80% to 3.06% +26
Germany: 0.30% to 0.46% +16
Move in basis points, Bloomberg terminal data
How dangerous is this for the global financial system?
When we talk about financial conditions we’re talking about the tightness of credit and the speed of the tightening of credit. Right now, financial conditions globally are tightening at the fastest pace since 2015 when we had the Chinese currency devaluation. At the Bear Traps Report, we also measure currency volatility and credit default spreads on emerging market banks versus US banks. In this area, we’re looking for divergences. Our Index of 21 Lehman Systemic Risk Indicators is rising at the fastest pace since 2011. For example, during a healthy “risk on” period, when everybody is taking risk, you typically don’t see divergences in credit quality globally. In contrast to that, in a market that’s about to turn “risk off” many times you see dramatic credit divergences ahead of it. Right now, the credit quality of European and Asian banks is substantially weakening relative to US banks, NOT a good sign at all.
Yield: Bonds vs. Stocks, Far More Competitive
US 10 year Treasury vs. S&P 500 Dividend
2018: +1.30%*
2016: -0.84%**
*Fresh seven-year high yield advantage for bonds, Bloomberg data
**July 1st 2016, post-Brexit rush into bonds
As bond yields rise, future cash flows thrown off by FAANGs are far less attractive. During the February bond yield surge, FAANGs dropped 12-14%.
What does this mean for investors?
Today, everybody in the US is hiding out in FAANG stocks like Facebook (FB), Apple, Amazon, Netflix (NFLX), Google and Microsoft (MSFT). That’s really concerning because there are more than six hundred ETFs which own 8 stocks – far too much wealth is concentrated in just a handful of stocks. The thinking is that the FAANGs are a safe investment because the US has decoupled from the rest of the world. But what’s happening is that the more money goes into passive investments the more these FAANG stocks get pumped up. For instance, think about the QQQ ETF which is based on the Nasdaq 100 Index. If a billion Dollars goes into the QQQ ETF than close to 400 million Dollars MUST BE squeezed into the FAANGs. That’s insane.
Pick up our latest report here:
Don’t miss our next trade idea. Get on the Bear Traps Report Today, click here
Why?
Ten years ago, we were lectured again and again that the emerging markets had decoupled from the US and that our money was safe in emerging markets. That’s because as opposed to the developed markets like the United States, the so-called BRIC countries Brazil, Russia, India and China were growing at 8 or 9%. So, they were considered to be safe places to invest. The thinking was that their growth is so powerful that even if the US goes into recession the global economy is going to be OK. Literally, every single TV program, magazine, and newspaper were preaching this garbage.
But as a matter of fact, economic growth in the emerging markets was quite impressive over the last decade.
True, but the EEM iShares MSCI Emerging Markets ETF lost 60% of its value from 2008-2009. It’s ironic that today, basically the exact same story is being pitched to investors again. But now, the U.S. is the safe place and has “decoupled” from the rest of the world. So, there is safety in these FAANG stocks, the story goes. But that’s complete garbage. All these ETFs are a bit like shadow banks. They are like the CDOs on the eve of the financial crisis. There are so many people in them that there is not going to be enough liquidity when things turn bad. We saw this when Facebook dropped $122 billion in one day. That has never happened before. No one stock has EVER wiped out that much wealth in one day, not even during the financial crisis, not even during the dotcom era. Our models point to this event as a large tremor BEFORE the quake.
How bad is it going to get?
 We are going to see this across all the FAANG stocks. It’s going to get really ugly and it’s probably going to happen in the next six to nine months. It’s going to be close to a 20% drawdown for the entire US stock market. But the FAANGs, these crowded stocks, are going to drop 30 to 40%.
The last big stock market crash in the US happened ten years ago. What goes through your mind when you think back at the failure of Lehman Brothers?
Thanks to central bankers around the world, asset prices in the U.S. are pumped up on steroid levels. People blame Wall Street for the financial crisis of 2008. That’s fine. But the largest misconception has to do with the central banks. The Lehman senior management team never ever would have taken that much risk if the Federal Reserve was aggressively raising rates. In 1994, the Fed pre-emotively raised rates 50bps (0.50%). A surprise move like this might have prevented much of the aggressive risk-taking that brought Lehman down. Central bankers have put us in such a bad place and now they have done the same thing again. If you look around the world, overall there is around $45 trillion of new debt* that wasn’t on the planet ten years ago (thanks to central bankers).
*tradeable debt in the public markets NOT private, Bloomberg Barclays Credit Agg data.
Pick up our latest report here:
Don’t miss our next trade idea. Get on the Bear Traps Report Today, click here
What exactly happened at Lehman in the time leading up to the financial crisis?
I remember being on the trading floor in 2006 and 2007 and they were telling us, “take more risks, take more risks.” So, I was asking one of the senior guys, “why are they telling us to take more risks?” He said, “the Fed had kept interest rates super low for almost three years and then raised rates very slowly with too much visibility going forward.” This was the reason why the Lehman managers were going around and giving us orders to take more risk. They were doing it because the Fed had laid out an obnoxiously transparent policy path. But here’s the key: There is a beast in the market and in capitalism in general. So, the Fed gave the capitalist beast far too much visibility on monetary policy. In other words, when monetary policy is so visible it creates more risk-taking. And that’s happening again today. The central banks have created a dynamic where if things are starting to soften they are trying to contain the risk (see February 2016). But each time all they’re accomplishing is a build up of more risk.
How did the fall of Lehman Brothers change Wall Street?
There were so many bad apples on Wall Street at that time, but Lehman gets a crazy amount of the blame. Other banks were even more screwed up. For instance, Citi and Merrill Lynch were a total disaster, their bad assets were 6x Lehman’s. So, the most important change is that the major banks are much less leveraged today. Also, there are more people working at hedge funds, mutual funds and other asset management firms than there are people working at banks. This means there has been a transfer of talent from the banks over to money management firms.
Where do you spot the biggest risks in the global financial system in case of another crisis?
A lot of banks are exposed globally to this emerging market debt. Deutsche Bank (DB) could go down, but they had like ten years to prepare for this. So, it’s probably going to be financial institutions in Asia, Australia, and Canada which will get into trouble. But it’s not going to be one big Lehman situation. It’s going to be much more of a spread-out globally.
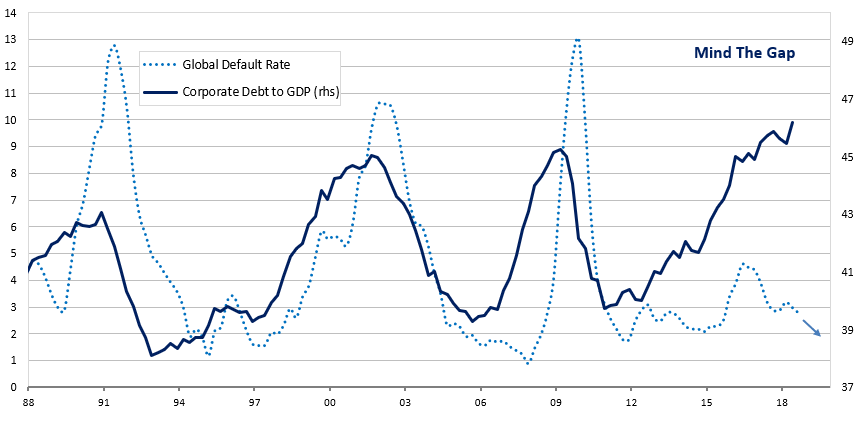
Junk Bond Orgy is Long in the Tooth
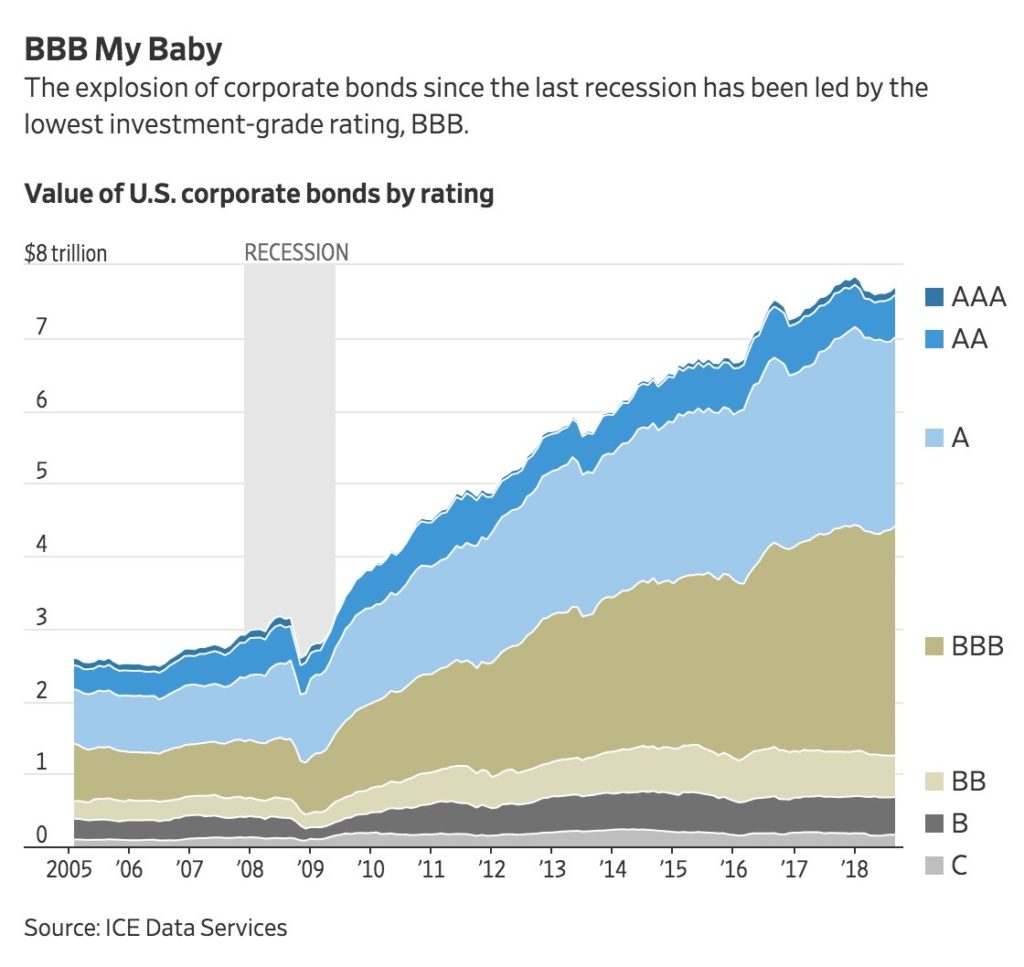 The Great Risk Transfer: Over the last ten years, all the risk has been transferred from the large US investment banks like Lehman, over to corporate (companies, BBBs above) and sovereign (government) balance sheets.
US – Near Junk Rated – Corporate Bond Debt Binge
2018: $3.1T
2008: $0.5T
Ice Data, Bloomberg
Maturity Wall Beware
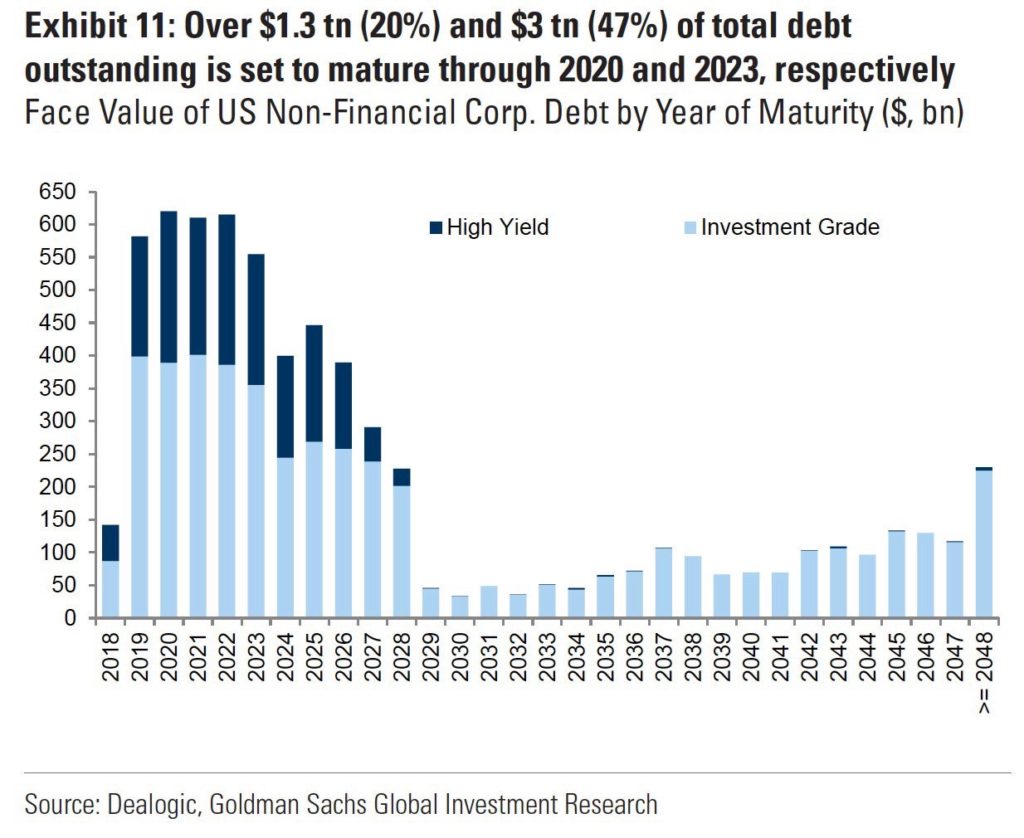 While the White House is playing games with tariffs and the global economy, $1.3 trillion of US corporate debt is coming due in the next two years. McDonald HAS NEVER seen a maturity wall of redemptions of this colossal magnitude.
How come?
Over the last hundred years inside financial markets, we’ve found in each crisis there’s a transformation into another serpent, a far different beast. In the 1970’s it was runaway commodity prices, a real energy crisis. In the 1980’s, it was Savings and Loans. The 1990’s brought us a currency crisis in Mexico, sovereign credit defaults (Russia) and the dot-com blow up. By 2008, a full-blown subprime mortgage crisis was upon us. At that time, the small banks were fine, but the big banks got into trouble. So, each financial crisis is followed by a metamorphosis into another beast and the next crisis is going to look much more like the one in 1998. It’s not going to look like anything like 2008.
Pick up our latest report here:
Don’t miss our next trade idea. Get on the Bear Traps Report Today, click here
What could this mean for a global financial hub like Switzerland?
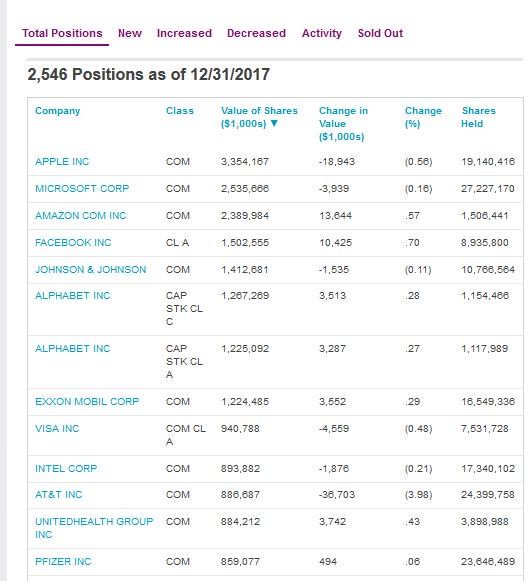 Right now, the most leveraged organization on earth might be the Swiss National Bank. They own all these FAANG stocks and it’s really concerning because the people of Switzerland are going to lose a lot of money when this crowded trade blows up. Just look at how much of that central bank’s money is in equities. It’s obscene. They don’t understand. In the last five years, $2 trillion has gone into passive asset management and there’s an untested liquidity mechanism when people head for the exits. A lot of that money has to go into the FAANGs. So, the Swiss National Bank has made a lot of money because of this passive revolution. They probably think they’re really smart. But they’re just benefiting from this move here in the United States where so much money has gone into passive strategies. Now, the Swiss National Bank is sitting on all these profits and they are going to look like complete imbeciles when the FAANGs blow up.


 As the Fed continues their quest for higher rates, something happened on the way to the next rate hike. – regional bank shares entered a “correction” this week. The BKX Index above is 10.6% off it’s January highs and flat since late November. BB&T Corp, M&T Bank, and PNC Financial topped out in late-February and are now under “death cross” formations.
 With mortgage rates at 84-month highs, the ITB iShares U.S. Home Construction ETF is 24% off its highs, in a deep bear market. At the same time, global oil prices have surged from $26 to $80 a barrel since 2016. Oil’s plunge created a massive $1.8T or 2.2% of global GDP income transfer between oil consumers and oil producers between 2014 and 2016, NOW that’s being reversed with major implications. Consumers globally are dealing with higher bond yields, higher oil prices and in many cases MUCH weaker local currencies in emerging markets. The global consumption DRAG is something we have NOT seen since at least 2008.
 The trade war impact on China’s economy is now coming into focus. The official and Caixin manufacturing PMIs both are in plunge mode, missing expectations in September. The latter falling to 50 — the threshold separating improving and deteriorating conditions, Bloomberg reported. The declines were broad-based across major components. Most notably, new export orders registered sharp drops, signaling the crunch from U.S. tariffs on $50 billion in Chinese goods over July and August, followed by another $200 billion in late September. The non-manufacturing sector was among a few bright spots. The private survey showed growth in the factory sector stalled after 15 months of expansion, with export orders falling the fastest in over two years, while an official survey confirmed a further manufacturing weakening. Taken together, the business activity gauges – the first major readings on China’s economy for September – confirm consensus views that the world’s second-largest economy is continuing to cool, which is likely to prompt Chinese policymakers to roll out more growth-support measures in coming months.
 Average hourly earnings jumped by 2.9 percent, above the 2.7 percent increase expected. The unemployment rate held near a generational low of 3.9 percent. The wage growth was the highest since April 2009.
 Average hourly earnings rose 2.9 percent for the month on an annualized basis, while nonfarm payrolls grew by 201,000. Economists surveyed by Reuters had been expecting earnings to rise 2.7 percent, payrolls to increase by 191,000 and the jobless level to decline one-tenth of a point to 3.8 percent.
