Q3 GDP; What You Need to Know

2016: Annual Real GDP Growing 1.9%

Q4: 2.5% (says NY Fed)
Q3: 3.2%
Q2: 1.4%
Q1: 0.9%

U.S. Economy, Growth in Decline Since 1981

nominal-gdpNominal GDP growth in the U.S. has been in sharp decline since the early 1980s.  Economic growth without inflation adjustments; 14% in 1981, 7% in 2005 to 2.8% in 2016.  Market’s hope President elect Trump can change this decay.

Q3 Real GDP was revised higher to 3.2% q/q with real final sales now 2.7% vs. 2.3% vs. the advance estimate. This points to decently strong momentum. However, given the move in the Dollar and interest rates since Q3, Q4 will likely not be as strong.

To get our reports on where the U.S. Dollar and the U.S. economy is headed, join us.

The increase in GDP was largely due to the increase in consumer spending.  Much of this spending was in the  household services sector, notably on housing and utilities. The upward revision was heavily weighted by increase in consumer spending.

Don’t miss our next trade idea. Get on the Bear Traps Report Today, click here

Exports of goods was pretty strong. However considering the Dollar strength and the EM weakness that has ensued, exports will taper off. Exports have been a large part of the GDP uptick since Q2, a reversion in a later revision or Q4 is likely. This will take the headline number back below 3%.

image-68

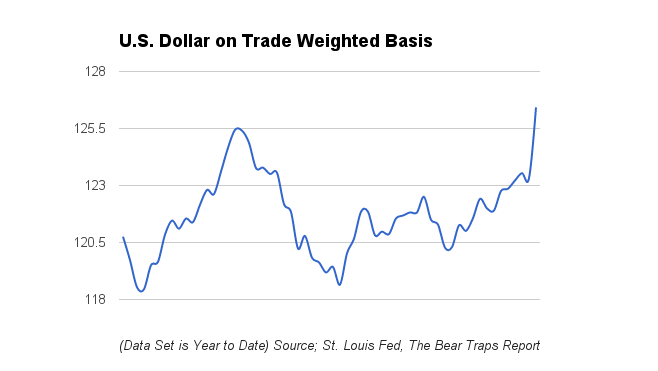
The recent rip in the Dollar since the election will put tremendous pressure on U.S. exports in the coming months. Over 40% of the earnings U.S. companies in the S&P 500 receive, come from overseas. 

To get our reports on where the U.S. Dollar and the U.S. economy is headed, join us.

Not all was positive, housing investment and state and local government spending declined.

image-65-1

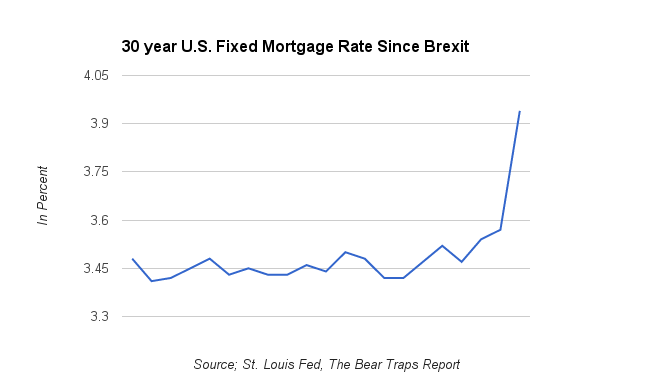
Tighter financial conditions that have developed since the election will certainly weigh on growth in the coming quarters.

Overall we are in a similar state. An acceleration in private inventory investment, exports and federal government spending along with smaller decreases in state/local government spending and a deceleration in nonresidential fixed investment.

Don’t miss our next trade idea. Get on the Bear Traps Report Today, click here
Facebooktwittergoogle_plusredditlinkedintumblrmail

Facebooktwitterrssyoutube

Reagan vs Trump

Our friend John Authors of the Financial Times made the point below that stocks are far more expensive today during the Trump run than during Reagan’s era.

Stocks: Price to Earnings On Inauguration Day*

Reagan: 8.2x
Trump: 26.5x

*Cyclically adjusted PE ratio

Don’t miss our next trade idea. Get on the Bear Traps Report Today, click here

Companies: Cash as a % of Equity Market Capitalization

Non Japan Asia: 23%
Japan: 21%
EA: 18%
LatAm: 17%
Europe ex UK: 13%
World: 13%
UK: 13%
US: 9%

Thomson Reuters, Bloomberg

As you can see above, U.S. companies are rich in equity market capitalization and poor in cash on comparison. 

Just four months ago the Street lectured us; bond yields are heading below 1%. Now, with treasury yields ripping higher, up almost 100 bps since Brexit, the Street says Trump’s fiscal policy and the coming inflation will lead yields higher. In the longer term this may come to fruition, but as we saw in 1980, yields ripped going into a Reagan presidency, only to revert lower in the recession that followed in the same year as his inauguration.

Honest question.  If a cold winter nearly knocks a delicate U.S. economy into recession, what will a one percent spike in interest rates result in?

As you can see here below, the Reagan yield spike was met with recession, that ultimately reversed yields lower.

image-74
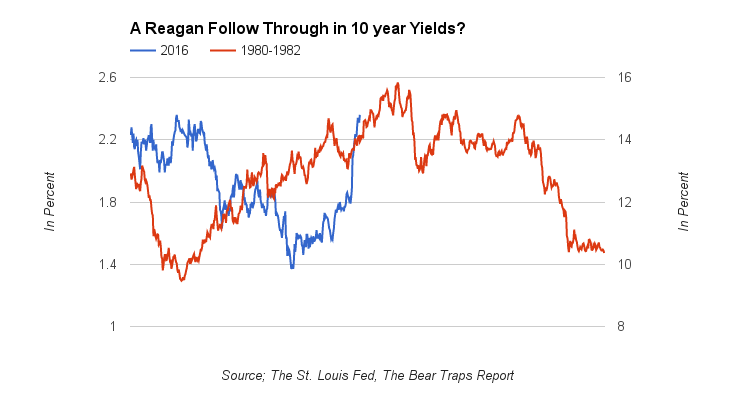
It was 1980, the U.S. 10 year Treasury bond yield bottomed out 9.5% in June, by February 1981 yields were 12.7% and nearly 16% by September of that year. The (November 1980) Reagan election brought with it a colossal yield spike, like today inflation was a key concern. However, in the middle of 1981 a recession sent yields much lower to the 10.5% level by November 1982.  The paradigm shifted, Reagan’s growth message was halted by a surge in bond yields, the economy reverted back into recession. Ten-year bond yields went down to around 13% by the end of 1981. By the end of 1982, yields had returned to their June lows of 10%.

Investor Psychology 1980-1982

  1. Student body left, “Reagan’s growth message and tax cuts will lead to inflation.”  Bond yields surged.

2.  Student body right, “Oh no, bond yields are higher, credit conditions have tightened, leading us into recession” (nearly 6% yield surge from June 1980 to September 1981).

Don’t miss our next trade idea. Get on the Bear Traps Report Today, click here

Trump Impact: As Interest Rates Have Surged, So Have Financial Conditions

gs-fin-con-vs-sp

As you can see above, financial conditions have risen prior to the last two substantial S&P 500 plunges lower.  Trump’s election has brought a nearly 100bps surge in interest rates and a nearly 6% spike in the U.S. dollar.  There’s over $13T of new debt globally that’s tied to the dollar as well as 40% of S&P 500 companies with high exports outside the U.S.

Different Fiscal Circumstances 

image-72

In this chart we see, the debt loads the Reagan presidency inherited vs. the debt situation that Trump will have to deal with when he assumes office. The interest rate story is obviously radically different with longer end rates at 2.5%, vs 12% in 1980, however, this will affect how much leeway Trump has with his spending plans in a way it did not for Reagan.

To get our reports on where yields and the economy is headed, join us.

U.S. Real GDP

us-gdp
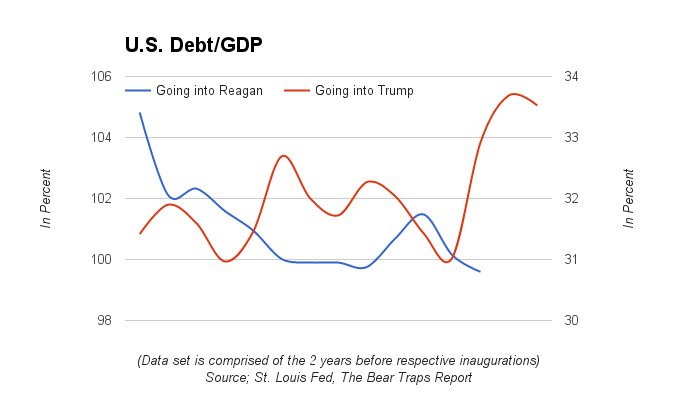
As yields surged 1980 into 1981, U.S. GDP plummeted.  This is what we are seeing  now, the tightening of the financial conditions is setting the seeds for the next recession. 

Yields Eventually Fell Off
reagan-recessionFollowing the financial tightening the economy experienced, a recession ensued. This eventually led to the collapse in rates which saw the 10 year yield lower than it was before Reagan’s election victory. 

Facebooktwittergoogle_plusredditlinkedintumblrmail

Facebooktwitterrssyoutube

Another Saudi Curve Ball

Just as we head into the all important OPEC Meeting, some feel Saudi Arabia has once again declared a war on oil prices.

OPEC officials failed to resolve internal differences that stand in the way of an agreement to cut oil production, while Russia dimmed the prospects for a broader deal to revive prices by saying it’s not planning to attend crucial talks on Wednesday.

With just one day left before ministers from the Organization of Petroleum Exporting Countries meet to finalize the first decline in production in eight years, the foundations for a deal were looking increasingly shaky on Tuesday, Bloomberg noted.

OPEC deal failure may push oil prices below $40/bbl, Algerian state news agency APS said Saturday, citing Algerian Energy Minister Noureddine Boutarfa after meeting with Iranian counterpart in Tehran this weekend.

Oil companies around the world have together added $490 billion to their market value this year as crude prices recovered. That’s the biggest gain since 2010 and follows a $1.7 trillion loss in value in the equity market cap.

Don’t miss our next trade idea. Get on the Bear Traps Report Today, click here

Click here for our latest report on the investment ideas in the Oil patch.

Late last week, the Saudi’s released a tactical letter while at the same time turned up pressure on some OPEC members (Iran and Iraq).

Saudi Arabia told the producer group it will not attend talks on Monday with non-OPEC producers to discuss limiting supply, as it wants to focus on having consensus within the organization first.

On the eve of the 171st Ordinary OPEC Meeting to take place on November 30 in Vienna of Austria, in classic fashion the Saudi’s have thrown another curve ball the global oil production leaders.  Just as the world’s major producers and exporters of crude oil are preparing to adopt one of the most historic decisions on freezing oil prices, Saudis seem to have reneged on earlier promises.

oil-output

Eight years of an easy money gravy train (courtesy of mad central bankers) has provided leverage which has turned supply – demand oil market relationships upside down.  Low cost debt has funded non-OPEC oil production globally, the surge has been colossal.  The Saudi’s have done anything and everything they could to increase production, maintain market share.

Oil debts are so HIGH globally that the cheating factor is equally elevated, this has thoroughly annoyed the Saudi’s.

The Vienna meeting was supposed to include plans to discuss the contribution that producers outside OPEC will make to a proposed supply-limiting agreement. OPEC oil ministers meet on Wednesday in an effort to finalize their deal.

Hopes were high that OPEC  would cement a preliminary September agreement in Algeria that would reduce its production to between 32.5 million and 33 million barrels per day, its first supply curb since 2008.


Don’t miss our next trade idea. Get on the Bear Traps Report Today, click here

Click here for our latest report on the Gold Miners.

Facebooktwittergoogle_plusredditlinkedintumblrmail

Facebooktwitterrssyoutube

Janet Yellen on Capital Hill; 3 things you need to know

Janet Yellen took to the hill today to testify on the state of the U.S. economy. Given the President Elect’s rhetoric about the current Chair of the Fed, the market was looking for hints about her future. What we did find out is that she will stay on her post for the entirety of her term, meaning she will not be resigning in 2017. Trump has the ability not to confirm her after her term has ended in January 2018.  This will be a critical move for markets as volatility at the Fed, the markets best friend, will have a significant impact on the global economy and markets.

Click here to get our latest on Fed policy and political decision making from the new Trump administration.

From an economic perspective, Yellen’s testimony was largely in line with what the market had expected. Yellen reiterated that the committees stance, which they affirmed in November,  are still on track for a rate hike this year. Yellen said the economy has continued to improve since the November meeting and that a rate hike will be coming “relatively soon.”

Don’t miss our next trade idea. Get on the Bear Traps Report Today, click here

However not all is well as the unintended consequences of Fed action continue to weigh on markets. The Global wrecking ball that is the U.S. Dollar, has continued its ascent today as the December hike now looks like a formality.  Emerging markets, developed markets that need Dollar funding and U.S. exporters, have all taken notice.

To get our report and the Dollar’s rise and its massive global consequences, join us here.

dxy1

Don’t miss our next trade idea. Get on the Bear Traps Report Today, click here
Facebooktwittergoogle_plusredditlinkedintumblrmail

Facebooktwitterrssyoutube

BOJ Maintains The Cap

The Bank of Japan wasted no time signaling their intent of maintaining “yield curve control.”  While the world’s bond yields have risen dramatically over the past few months, Japanese yields have barely moved. However, at the beginning of this week, the BOJ Chairman’s first test arrived as the 10 year bonds went over the 0% cap rate. jgb1

Click here to get our latest on the Bank of Japan and what it means for bond and equity markets.

Don’t miss our next trade idea. Get on the Bear Traps Report Today, click here


With the BOJ signaling a harder cap than the market expected, we expect this to have significant repercussions for the rest of the worlds bond market.

Click here to get our latest on the Bank of Japan and what it means for bond and equity markets.

30s

Facebooktwittergoogle_plusredditlinkedintumblrmail

Facebooktwitterrssyoutube

Fed in Handcuffs

Don’t miss our next trade idea. Get on the Bear Traps Report Today, click here

Click here for our latest report.

Colossal Losses, Impact of Fed Rate Hike in the Market

One of the most popular bond indices, the Barclay’s U.S. Aggregate, has a market value of $17.9 trillion today. This compares to a market value of $8.3 trillion at the time of the last Fed rate hike on June 29, 2006. A look around the world is an eye opener; the Barclay’s Global Aggregate has a market value of $47.2 trillion versus $21.9 trillion on June 29, 2006.

Some of this is already priced in of course, but the quick and dirty calculation tells you that for the U.S. Agg, a 25bps hike has 2.53x the impact of a 2006 era move and for the Global Agg, the impact is around 2.36x a 2006 era move in terms of the value of immediately re-priced assets. This gives the adage ”interest rates up, bond prices down” profound new meaning.

Put another way, the amount of losses by global bond investors in percentage terms for a given hike in rates is around 2.5x as powerful as it was the last time the Fed hiked rates over nine years ago. So might 25bps act a bit more like 62.5bps? When will we find out?

Don’t miss our next trade idea. Get on the Bear Traps Report Today, click here

Click here for our latest report.

 
Facebooktwittergoogle_plusredditlinkedintumblrmail

Facebooktwitterrssyoutube

Gold’s Negative Yield Drag

Don’t miss our next trade idea. Get on the Bear Traps Report Today, click here

Click here for our latest report on the Gold Miners.


Negative Yielding Bonds vs Gold

November: $8.7T vs. $1225
October: $9.6T vs. $1265
September: $12.4T vs. $1350
Bloomberg data

The market value of the world’s negative-yielding bonds plunged 14 percent last week to $8.7 trillion as investors dumped government debt at a record clip after Donald Trump’s upset win stoked speculation that his ambitious fiscal plan would flood the market with new Treasuries and boost inflation, Bloomberg reported.

Don’t miss our next trade idea. Get on the Bear Traps Report Today, click here

Click here for our latest report.

As more bonds on earth move into positive yield territory, the demand for gold drops sharply.  Many investors would rather hold gold than a government bond with negative yield.  The $1.4 trillion decline from Nov. 4 in the total amount of debt certain to lose money if held to maturity was fueled mostly by increased government-bond yields following the U.S. presidential election. The Bloomberg Barclays index of the prices for such debt worldwide fell 3.2 percent last week, the biggest decline since at least 2000, as far back as the data goes.

Don’t miss our next trade idea. Get on the Bear Traps Report Today, click here

Click here for our latest report.

Facebooktwittergoogle_plusredditlinkedintumblrmail

Facebooktwitterrssyoutube