Breaking Point

“Yesterday, the U.S. 10 year treasury bond hit our long held 1.40% target.  A sea of bond bears has become an ocean of bulls.   Brexit’s risk to the global economy has created an opportunity for those willing to step in and short bonds in the face of a large group of clowns rushing to the exits (abandoning their long held bearish bond positions).”

Bear Traps Report

July 6, 2016

The Fed is playing a very dangerous game.  They will do anything to protect their beloved Hillary Clinton’s 2016 election hopes, but in doing so they risk financial instability.  When you get too close to the edge one often gets burnt.   Colossal stakes are on the line.  The 10 year U.S. Treasury hit a yield of 1.63% this week, a seller’s panic has begun.  As long term bond bulls we turned bearish in late June, recommended our clients SELL bonds.

Pick up our latest ideas here:
A Warning from Jackson Hole 

Friday morning, in classic fashion our favorite “labor market” economist in Janet Yellen talked up the U.S. economy.   Yellen reiterated her belief that the U.S. is nearing full employment and meeting their goals.  Heading toward the 2016 election, the Fed’s cheerleading has become a double edged sword.  Central bankers have been talking up the U.S. economy, but in doing so they risk waking up the beast within global equity markets.

Over the last year, every time the Fed has tried to raise rates stock market volatility has surged dramatically.  There’s over $10T of debt globally tied to the U.S. dollar, commodities and emerging markets.   As the Fed has kept rates near zero for eight years the easy money gravy train has exploded in size.  Every second they’ve kept interest rates too low for too long, capital has oozed into places it just shouldn’t be.  As the Fed tries to exit the “lower bound” the U.S. dollar surges along with systemic credit risk.  As we said in January, “the Fed will NOT hike rates this year, but they will try (and fail) to get one in. ” It’s the beast in the market that will stop them once again.

Don’t miss our next trade idea.  Get on the Bear Traps Report Today, click here

Bloom Dollar

The global wrecking ball that is the U.S. dollar surged Friday.  After over two months of public silence about her views, Yellen pointed to “continued solid performance of the labor market.” 

VIX Range New

The Fed chair also emphasized the “case for an increase in the federal funds rate has strengthened in recent months” in her speech Friday to central bankers and economists in Jackson Hole, Wyoming.  Complacency had taken control over equity markets globally this summer.  Friday we witnessed a rare surge in volatility, for the first time in months the VIX traded in a 23% range.

us 10s breakout

U.S. ten year Treasuries hit 1.63% today, the highest mark in 3 months. 

Just as the very last bond bear turned bull, Treasuries now in the throes of the most significant sell off this year

“We’re reasonably close to what is thought of as full employment.  The inflation rate this year is higher than last year’s.  It’s still not up to 2 percent. But it’s been growing.”

Stanley Fischer

WIRP SeptFed fund futures have shifted from a 13% chance of a rate CUT in (post Brexit low) to a 43% chance of a rate HIKE in September.

Pick up our latest ideas here:
Facebooktwittergoogle_plusredditlinkedintumblrmail

Facebooktwitterrssyoutube

Breaking: Fed’s Fischer Hints at a Hike

“For the rest of the year, we think global credit risk will veto the Fed’s policy path (no hikes) and therefore, gold and the gold miners are going to do very, very well in that environment in 2016.”

Bear Traps Report’s Larry McDonald, January 2016 on CNBC

Aspen Institute in Aspen, Colorado on Sunday

Don’t miss our next trade idea.  Get on the Bear Traps Report Today, click here

Today, Federal Reserve Vice Chairman Stanley Fischer said the U.S. economy moving ever so near to the central bank’s objectives and he expects growth to pick up in the future.

As a key member of Janet Yellen’s inner circle Stan Fischer’s words carry 10x the weight of non voting, regional Fed bank presidents.

Air Pocket

Considering over 3000 current Dow (Dow Jones Industrial Average) points are supported by the easy money Fed gravy train, we recommend keeping yours eyes and ears on him.

Gold vs Dollar

The Bloomberg dollar index is off 3% over the last 20 days while gold has been stuck in a trading range.

Don’t miss our next trade idea.  Get on the Bear Traps Report Today, click here

“We are close to our targets..  Looking ahead, I expect GDP growth to pick up in coming quarters, as investment recovers from a surprisingly weak patch and the drag from past dollar appreciation diminishes.”

Stanley Fischer

Over 547,000 new jobs have been created in June and July, so why is the Fed so cautious on the 2016 rate hike?

Fed’s Fischer

U.S. Job Market:  “remarkably resilient”
U.S. GDP Growth: “mediocre at best.”

Fischer trying to balance out is speech here.

December Rate Hike vs Bloomberg Dollar Index*

Today: 52% vs 1166
Month Ago: 43% vs 1198

*weaker dollar with higher rate hike probability

Bloomberg data

We’re witnessing a remarkable divergence between the U.S. dollar and Fed Fund Futures.  The dollar has plunged 3% over the last 20 days while the futures market is pricing in a much higher chance of a December Fed rate hike.

Don’t miss our next trade idea.  Get on the Bear Traps Report Today, click here

Fischer Balancing Hawkish Comments with Dovish Concern

“A 1.25 percentage point slowdown in productivity growth is a massive change, one that, if it were to persist, would have wide-ranging consequences for employment, wage growth, and economic policy more broadly,”

Stan Fischer

Fed Fund Futures vs Fed Dots*

Effective Fed Funds

Today: 0.40%
2017: 0.65% v 1.60%
2018: 0.78% v 2.36%

*Fed’s projections on rates

Bloomberg data

The futures market is giving the Fed the Rodney Danderfield, “no respect”.  Traders are pricing in just one rate hike between now and the end of 2018.  On the other hand, the Fed dots are pointing to seven rate hikes over the same time frame.  This disconnect cannot stay this wide, it’s unsustainable.

Fed officials next meet Sept. 20-21.   We will listen closely for additional clues on timing when Fed Chair Janet Yellen speaks Aug. 26 at an annual in Jackson Hole, Wyoming.

Don’t miss our next trade idea.  Get on the Bear Traps Report Today, click here


Facebooktwittergoogle_plusredditlinkedintumblrmail

Facebooktwitterrssyoutube

A Valley Full of Bulls

From the Bear Traps Report in February:
“Today, we see bears everywhere… we want to put money to work where we see the most compelling risk / reward.  We think oil and the energy names are becoming attractive again. It’s time to buy fear.”
 
– Bear Traps February 11, 2016 (WTI – oil touched $26.05 that day)
 
Pick up our latest ideas here:


In recent years sell side dealers like Goldman, Bank of America and Citibank have been aggregating their client holdings data from their respective prime brokerage units.

After a look under the hood, they analyze the data to come up with themes and trends.  We spend a lot of time reading street research and developing our own conclusions, most of all looking for crowded trades.  Since late 2013, the one investment strategy that’s been very successful has been found in determining in what moments too many investors are crowded on “one side of the boat”.  With rates near zero globally, returns have become harder and harder to come by, the net result is a lot of clowns stuffed into one corner of the market reaching for alpha.

Phone Booth

“In the first six week of Q3, funds raised equity market exposure sharply, bringing net leverage near 12-month highs through a combination of record call option buying, longer net futures exposure, and short covering in addition to adding leverage in their favorite long stocks.”

Goldman Sachs

With the market at all time highs we’re seeing a significant amount of chasing.  Those who didn’t have the courage or the wisdom to buy the Brexit fear lows are piling into stocks at the fastest level in over a year.    We’re seeing surge in net long exposure to 65%, approaching the highest levels in 12 months.

S&P 500

Today: 2183 (Net Long Exposure 65%)
Feb Lows: 1810 (Net Long Exposure 47%)

Goldman, Citi, BofA data

In February, net long exposure was below 50%, the hills were full or bears.  One by one, as the timid bulls came out of hiding, the market has surged higher and higher.

The Herd is Levering Up

In recent weeks, on top of adding leverage through cash equities, call option volume rose to record levels, hedge fund S&P 500 futures exposures climbed by $15 billion.

Shorts Carted Out

We often hear “this is the most hated bull market of all time.”

This is absolutely not true!  A look at the S&P 500 shows share of equity market capitalization “held short” is at 12 month lows.  If fact, shorts are 20% lower since September and have come down 16% since the February lows.  Lets NOT kid ourselves, many shorts have taken their ball and gone home.

Everyone Wants to BUY Calls, You Can’t Give Away Puts

Put Call

One thing we stress to subscribers is DON’T over trade.  Over the last 3 years if you sat in the boat and waited for real fear, then put money to work, you’re likely doing better than the market.   Of course, this is easier said then done.  The Put-Call Ratio has been a solid buy signal.  We recommended subscribers buy both the Brexit and China devaluation panic.  One reason why is found in the put call ratio.  Since late 2013, if you bought stocks while everyone is buying puts you have done very well.

Don’t miss our next trade idea.  Get on the Bear Traps Report Today, click here


Facebooktwittergoogle_plusredditlinkedintumblrmail

Facebooktwitterrssyoutube

A Tale of Two Cities

A Tale of Two Cities

Don’t miss our next trade idea.  Get on the Bear Traps Report Today, click here

As the S&P 500 rages higher with reckless abandon, U.S. consumer confidence sits in fear.  Central banks are kissing stocks while hanging the little guy out to dry.

A Very Strange Divergence

Consumer ConfidenceThe University of Michigan’s consumer sentiment for the United States came in at 90.4 in August 2016 from 90 in July but well below market expectations of 91.5, preliminary figures. Consumer expectations improved firmly while current conditions deteriorated. Consumer Confidence in the United States averaged 85.92 from 1952 until 2016, reaching an all time high of 111.40 in January of 2000 and a record low of 51.70 in May of 1980. Consumer Confidence in the United States is reported by the University of Michigan.

U.S. equities and the consumer have been tied at the hip until now…

What does this mean for stocks?  Join us here:

Don’t miss our next trade idea.  Get on the Bear Traps Report Today, click here


Facebooktwittergoogle_plusredditlinkedintumblrmail

Facebooktwitterrssyoutube

Warning Signs

Don’t miss our next trade idea.  Get on the Bear Traps Report Today, click here

Interesting Divergence

From the July Highs

Dow Jones Industrial Average: Unched
Dow Jones Transportation Average: -3.0%
General Electric: -5.5%

Bloomberg

Don’t miss our next trade idea.  Get on the Bear Traps Report Today, click here

There were a lot of happy faces last week when the Dow and S&P 500 got back on record highs, but hold the high fives.

Both General Electric and the Dow Jones Transportation Average have NOT confirmed the celebration.  Even more challenging, the CBOE Volatility Index is 4.5% ABOVE this month’s low, another NONE confirmation.

DOW GE TranniesYears ago, back in our Morgan Stanley days Barton Biggs warned us of the “GE – Transports non-confirmation omen.”  It’s a classic sign that unsustainable factors are holding up stock prices, not solid fundamentals.  We have an equity market positioned on a loose clay foundation with NO sign of bedrock.

Our 21 Lehman Systemic Risk Indicators are telling us something, pick them up here, click on this link:

Don’t miss our next trade idea.  Get on the Bear Traps Report Today, click here

VIX Now Up 9% off this Month’s Low

VIX 15 Day

Spread between UX2 (2 month VIX Future) and UX8 (8 month VIX Future) back out at 4.64, widest since November 2013. LOTS of vol sellers out there on a lazy August Monday.  The curve is crazy steep, rich contango.

Core PPI Plunge

The Labor Department said on Friday its producer price index for final demand dropped 0.4 percent last month, the first decline since March and the largest since September 2015. It increased 0.5 percent in June.

CORE PPI

In the 12 months through July, the PPI slipped 0.2 percent after rising 0.3 percent in the 12 months through June. Economists polled by Reuters had forecast the PPI edging up 0.1 percent last month and gaining 0.2 percent from a year ago

Facebooktwittergoogle_plusredditlinkedintumblrmail

Facebooktwitterrssyoutube

Political Risk and the Revenge of Joe Lunch Pail

“Whenever you find yourself on the side of the majority, it’s time to pause and reflect.”

Mark Twain


We are NOT making a political opinion here, we are managing risk.

In managing 2016 election risk, there really is only one definitive thing we’ve learned.  The U.S. media has been absolutely clueless in terms their handle on the will of the American people so far.  For over 12 months, they’ve called Donald Trump “done” well over 50,000 times.  Like group therapy, they sit around Manhattan cocktail parties trying to convince themselves the wicked witch is dead, only to be disappointed again and again.


“If everyone is thinking alike, then somebody isn’t thinking.”

General George S. Patton


Sign up for our political risk updates, get our Election 2016 Playbook, click on this link below:

Don’t miss our next trade idea.  Get on the Bear Traps Report Today, click here

We are NOT making a political opinion here, we are managing risk.

Managing expectations, determining how much is priced in to every trade is the key to finding the best entry point in any investment.  The Brexit drama was a classic example of this powerful political dynamic’s market impact.

Middle Class
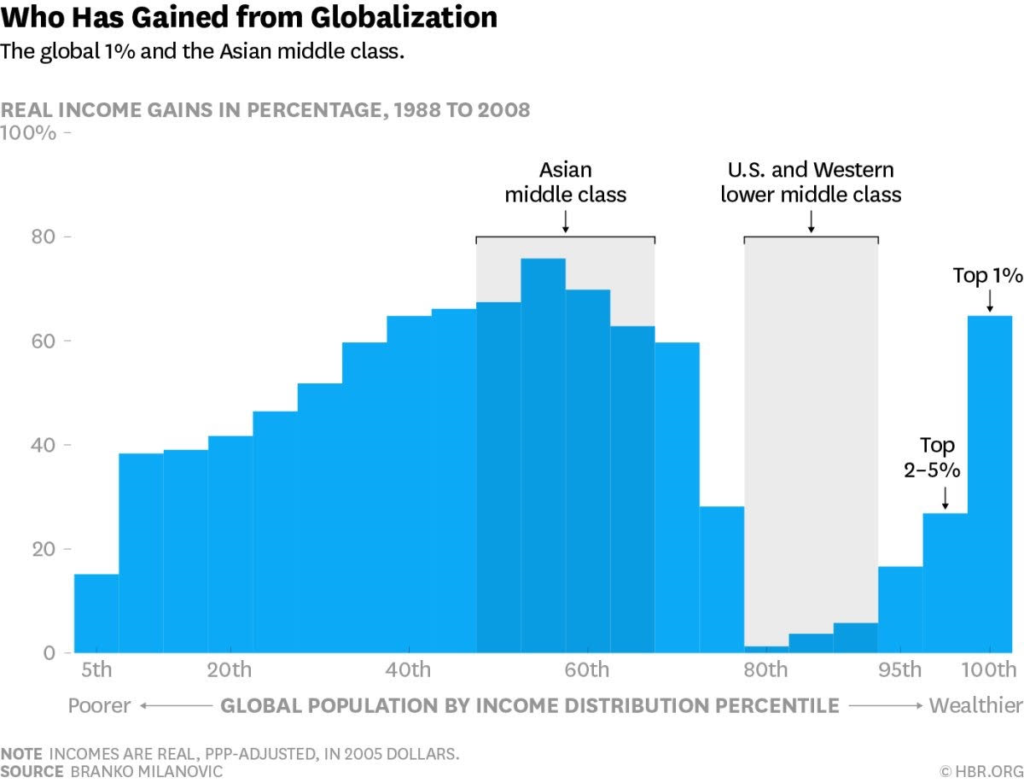
Instead of listening to 2000 journalists lecture us on how the 2016 election is all over, lets manage risk.  Where’s the most attractive risk – reward in this year’s election cycle?   What’s priced in and Not priced in?  Should the VIX (the CBOE stock market volatility index) really be under 12 one hundred days before this election?  All you need to know is up in this chart above.  We call it the “revenge of Joe lunch pail.”  Just like middle-class families in the countryside of England in June (Brexit vote), there are so many working class Americans who have had it with globalization, political correctness and elitist media telling them how to vote.   They are tired of living in fear.  All they know is their incomes and jobs have moved to Asia, terror and U.S. racial tensions are on the rise.  It’s pure common sense.  Whether right or wrong, Donald Trump has tapped into a powerful political vein running across America.  It DOES NOT MATTER whether Mr. Trump has an effective plan that will work, Joe Lunch Pail is just VERY HAPPY someone is finally listening to him.

“70% of middle class households saw their income drop over the last decade. This compares to declining incomes in just 2% to 9% of households the previous 12 years.”

McKinsey Research, August 2016

Don’t miss our next trade idea.  Get on the Bear Traps Report Today, click here

Brexit Lessons, Is Anyone Listening?

According to a study conducted by the Bear Traps team, heading into the Brexit over 95% of London based journalists believed the “remain” would succeed.  Across the pond, all the group therapy did was get markets WAY offsides in terms of risk heading into the Brexit referendum.  Mr. Market was lectured and lectured and lectured by clueless London based journalists.  This crowd spent more time tweeting  their like minded ideas to eachother, than actually driving across the countryside and trying to determine what the people actually wanted out of the referendum.

income
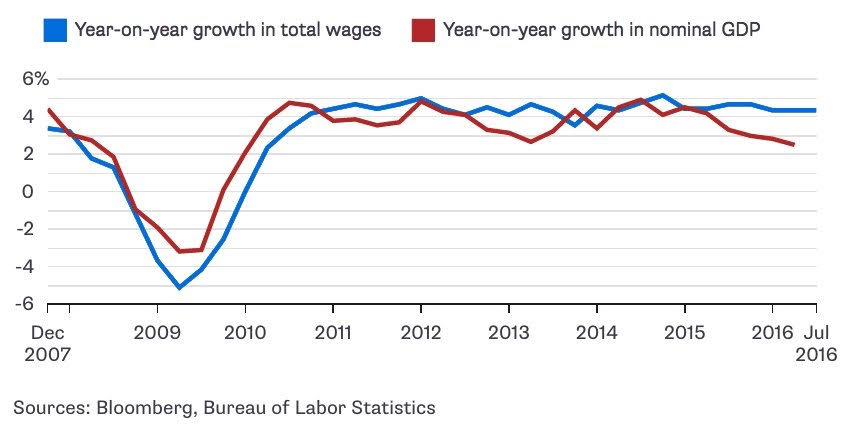
Joe Lunch Pail is hurting, his family has been dealing with flat to declining income going on 6 years.  As much as the U.S. media wants to get off this topic and focus on their perception of Trump’s flaws, they are ignoring the elephant in the room.  The U.S. media regime is making the same mistake the BBC made in London during the pre-Brexit risk analysis.  Far too many people priced the risk of Brexit at unrealistically low levels, we know what happened next.  There are eight million people in London, 50m outside the city.  London votes 8-1 to remain, but people across the countryside voted 3-1 to leave.  The only problem, no one listened to the butcher, the baker, the candlestick maker.  Lets NOT make the same mistake they did, we MUST learn from history, not repeat it.

We are NOT making a political opinion here, we are managing risk.

Voter turnout

2012 – 2016

GOP +50%
DEM -15%

This is a freight train running down hill, tough to stop.

Last 30 Days of “Islamic Terror”

Countries: 22
Attacks: 141
Killed: 1165
Injured: 1803

Religion of Peace data

Rising Rust Belt Risk

Joe Lunch Pail is paying more attention to the rising terror threat than the media’s obsession with a Kahn – Trump war of words.

Rust BeltYou wont find this chart in the main stream media, but unemployment is sharply on the rise in the Rust Belt, especially in Ohio and Pennsylvania. 

The odds of Donald Trump becoming president must be analyzed relative to current expectations, the bar is VERY low.   The Market has NOT priced in a surprise Trump surge.  However, since extreme geo-political tragedies have become near common events, Trump has clearly boosted his chances by taking an aggressive stance on addressing these issues. The Rust Belt (Indiana, Illinois, Michigan, Ohio and Pennsylvania) region of the U.S. has been especially hit by much economic hardship, racial tensions and social unrest. In 2012, Obama won by 64 electoral votes, the sum of the votes of these four states is 64. It is also interesting to note that since then 3/4 of this states have elected Republican governors.

File_001 (21)
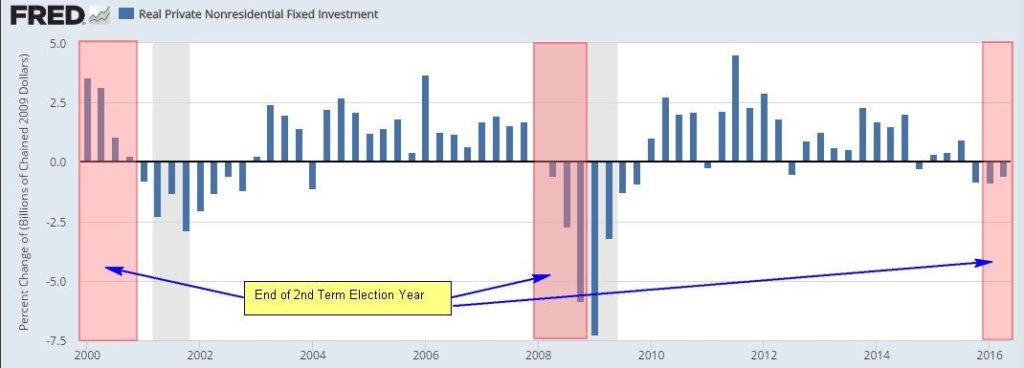
Two term Presidential elections and recessions have a lot in common.

2008-16 GOP Momentum

Democrats Seats Lost

Senate: -13

House: -69

Governorships: -11

State Legislative Chambers: -30

Get our Full Report here with Investment Ideas, Political Risk Strategies:

Don’t miss our next trade idea.  Get on the Bear Traps Report Today, click here
Facebooktwittergoogle_plusredditlinkedintumblrmail

Facebooktwitterrssyoutube

What’s the Junk Bond Market Telling Us about the Global Reach for Yield?

One ugly side effect found in the colossal ramp up in global quantitative easing (government bond buying) is in the disconnect between oil and high yield bonds.  Credit risk is clearly rising but U.S. junk bond yields remain suppressed as international yield seekers have come to America with open check books.

What are the implications?  Reach out to us here:

Don’t miss our next trade idea.  Get on the Bear Traps Report Today, click here


Oil and Junk Bonds

image (3)
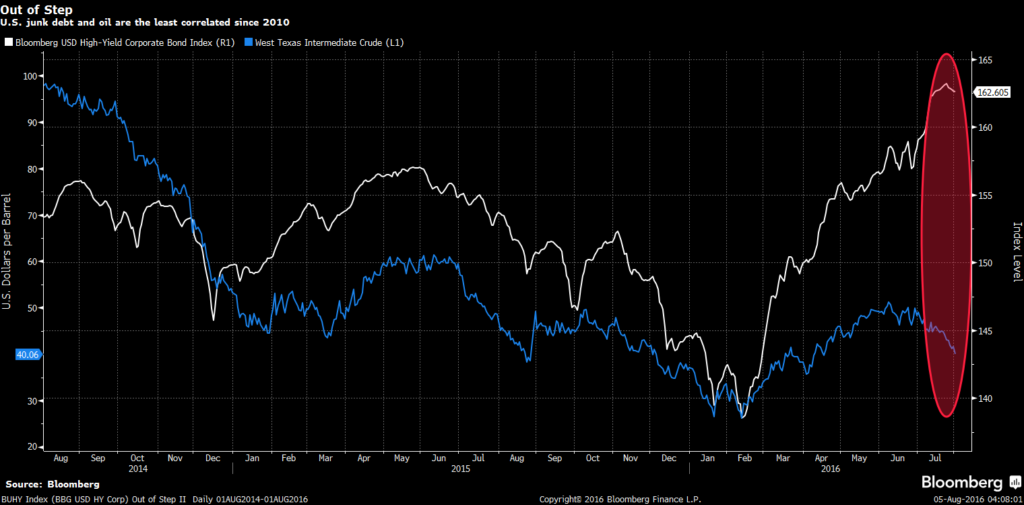
Oil in blue, junk bonds in white are singing a classic warning sign for us all.  The disconnect is eerie.  As long as desperate insurance companies in Tokyo and Frankfurt have an unending thirst for yield, U.S. junk will be mispriced.  Short Junk Now.

Japan vs  Germany

German 10s Japan 10sGerman and Japan 10 year bonds, married at -0.08%, a true global growth story.

In the end, central banks will be viewed as capital destruction vehicles.   Far too much debt as been sold at ridiculously high prices.  Bonds are more expensive today than internet stocks in 1999, sell Mortimer sell!

File_000 (43)

Get on our latest report here:

Don’t miss our next trade idea.  Get on the Bear Traps Report Today, click here
Facebooktwittergoogle_plusredditlinkedintumblrmail

Facebooktwitterrssyoutube