Russian Equities, Pricing In Trump Goodwill

We’re just back from Moscow, join our Larry McDonald on CNBC’s Closing Bell today at 3:10pm.

Don’t miss our next trade idea. Get on the Bear Traps Report Today, click here

Where are bond yields going with debt on the rise?  Click here for our latest report.

Russian Ruble has been the Top Preforming Emerging Market Currency in Q4 2016 ruble-bbdxy

Republican Donald Trump won U.S. elections on Nov. 8 with a promise to improve ties with Russia, holding out the possibility of easing sanctions imposed after Moscow’s 2014 annexation of Crimea from Ukraine.   The ruble has been the big winner, dramatic outperformance. 

We visited Russia (Moscow) this month.  Russians are very excited about the prospects of the incoming Trump administration.  The 70 year relationship between NATO – USA – Saudi Arabia is coming to an end, Russia will be the big winner.

Big catalyst for Russian equity’s in 2017 will be rate cuts as inflation has finally gotten under control this year. Real rates are far too high and will come down.  Russia’s bonds are attractive as well, falling inflation will bring 150-200 basis points in official interest rate cuts next year. That will keep inflation-adjusted bond yields at among the highest in the world.

RSX (equities) are still 63% off their 2008 highs.  Inflows in December are the best in three years.

Click below for our full report:

Don’t miss our next trade idea. Get on the Bear Traps Report Today, click here

Facebooktwittergoogle_plusredditlinkedintumblrmail

Facebooktwitterrssyoutube

Trump, U.S. Trade and Secular Stagnation

Join our Larry McDonald on CNBC’s Trading Nation, Wednesday at 2:20pm.

Over the last week U.S. financial media went on a typical “scare and click” campaign against President-elect Donald Trump’s foreign trade counsel, led by University of California Irvine professor Peter Navarro.  Over the last 15 months its now very clear media outlets have used drama and scare tactics in an effort to drive traffic to their websites.  Donald Trump has been a savior in terms of giving many financially strapped media players a boogieman to throw around, in an effort to collect eyeballs of course.

“This is a negative trade message, and we should be concerned” as the appointment will disturb China-U.S. trade relations, said He Weiwen, deputy director of the Beijing-based Center for China and Globalization.  “If there’s a trade war breaking out between China and the U.S., both would be affected, but the U.S. side would lose more.”  Bloomberg reported Weiwen’s comments.

“Trump’s tariffs will make almost everything more expensive — and maybe cost you your job.”

Money.Mic’s Emily Singer

US Personal Consumption Expenditure Core Price Index YoY

core-pce

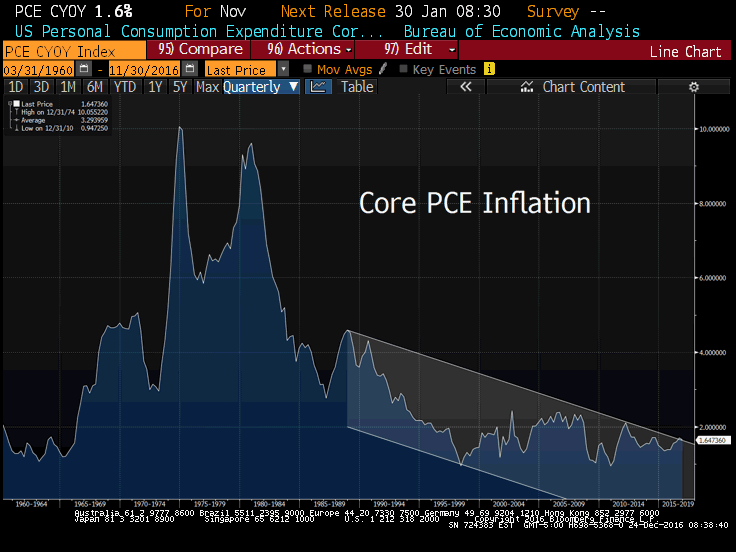
With the exception of March 2012, core PCE inflation has not been above 2% since September 2008.  The Fed sees core PCE greater than 2% as early as a year from now.  As you can see above, secular stagnation has placed core PCE inflation is a multi year secular down trend.  As we head towards a Trump Presidency, markets are pricing in aggressive trade tariffs fired at China.  Cheap goods imported into the USA have been a benefit to the U.S. consumer, but a detriment to the U.S. manufacturing base.  Any interruption in terms of trade tariffs will result in higher prices of goods.

U.S. Treasuries’ Yield vs. Inflation Expectations

U.S. 5yr 5yr Forward Breakeven vs the 10 Year Bond Yield

5-yr-vs-10s-inflation

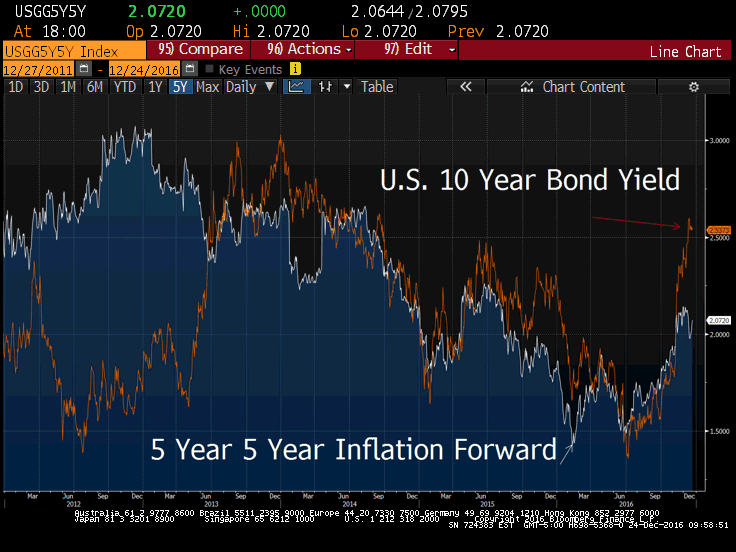
There are many methods of varying complexity that investors and policymakers use to estimate the level of expected inflation, but one relatively straightforward method is to examine the “breakeven” inflation rate which is the difference in interest rates between Treasuries and TIPS.  This method has the advantage of being determined by market prices, so it reflects the views of investors who have money on the line.

The Road Ahead

“Trump will impose countervailing tariffs not just on China, but on any American trade partner that cheats on its trade deals using practices such as currency manipulation and illegal export subsidies. Such tariffs are not protectionist but rather defensive — and consistent with actions taken by American presidents from George Washington to Ronald Reagan. Indeed, one of the first bills Washington signed was a tariff, which Alexander Hamilton justified as a necessary defense against a mercantilist Europe.”

Peter Navarro, 2016

A recently released study written by Wilbur Ross and Peter Navarro dives into the underlying issues behind secular stagnation.  The assumed, incoming protectionist trade stance of the Trump administration has been well advertised.  Negative press coverage of Trump’s potential trade policies out numbers positive  8-1, a review by the Bear Traps Report shows.  In our view, the media is far too focused on trade tail risk, and not enough focused on trade deal upside for the U.S. economy.  In reality, why does a shot (40% trade tariff) actually have to be fired?  The meltdown trade scenario has been well advertised by CNN, MSNBC and the Huffington Post.

China’s economy is in its 7th year of lower year over year GDP contraction.   Their banking system is the most highly leveraged on earth, they are in no position to take big trade risks.  They likely do a deal.

China Trade

A leading economist with a doctorate from Harvard, Navarro has spent much of his career criticizing China. Over a career of more than two decades, he has written books and directed a documentary on the U.S.-China trade relationship that helped form the backbone of the Trump campaign message on a pivotal election issue that played to globalization fears.

“export licenses had formerly been more difficult to obtain in some industries than others, their removal may have led to a surge in Chinese exports and subsequent decline in U.S. manufacturing employment in the industries where licensing was most binding.”

Ross – Navarro, 2016

Secular stagnation is a condition of negligible or no economic growth in a market-based economy. When per capita income stays at relatively high levels,  the percentage of savings is likely to start exceeding the percentage of longer-term investments in, for example, infrastructure and education, that are necessary to sustain future economic growth. The absence of such investments (and consequently of the economic growth) leads to declining levels of per capita income (and consequently of per capita savings). With the reduced percentage savings rate converging with the reduced investment rate, economic growth comes to a standstill – ie, it stagnates. In a free economy, consumers anticipating secular stagnation, might transfer their savings to more attractive-looking foreign countries. This would lead to a devaluation of their domestic currency, which would potentially boost their exports, assuming that the country did have goods or services that could be exported.

Persistent low growth, especially in Europe, has been attributed by some to secular stagnation initiated by stronger European economies, such as Germany, in the past few years.

Ross and Navarro are quite explicit in their introduction that  trade deficits have been a critical inhibiter of economic growth.  Simply states, key contributor to GDP has been the lag in net exports.  Another element is that he uses trade deficit reduction and trade policy reforms is for the revenue offset of substantial tax cuts. As a whole we found the paper to be EXTREMELY trade hawkish, a firm defensive trade position is coming to the White House.

Don’t miss our next trade idea. Get on the Bear Traps Report Today, click here

Where are bond yields going with debt on the rise?  Click here for our latest report.

Secular Stagnation

GDP in Decline since the Late 70s

nominal-gdp2

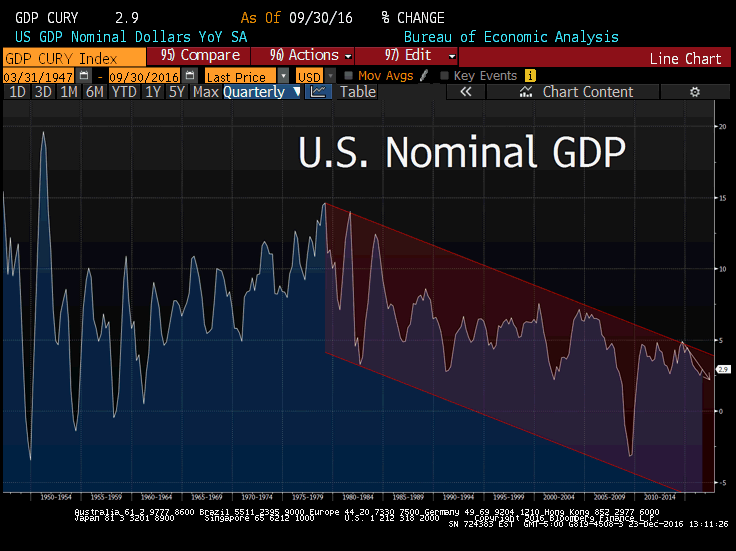
U.S. nominal GDP is in a long term secular decline, the Trump administration hopes to reverse the impact of secular stagnation.

“There is nothing inevitable about poorly negotiated trade deals, over-regulation, and an excessive tax burden – this is a politician-made malaise. Therefore, nothing about the “new normal” is permanent. ”

Ross – Navarro, 2016

The New Normal

Ross and Navarro point out, from 1947 to 2001, the nominal US gross domestic product (GDP) grew at an annual, rate of 3.5% a year.  However, from 2002 to today, that average has fallen to 1.9%.  This loss of 1.6% real GDP growth points annually represents a 45% reduction of the US growth rate from its historic, pre-2002 norm. Just why did the US growth rate fall so dramatically?

Over the last eight years, the U.S. didn’t achieve one year of year over year +3% growth.  That has not happened in nearly 100 years.

U.S. Real Year over Year Annual GDP

2016: 1.9%
2015: 2.6%
2014: 2.4%
2013: 1.7%
2012: 2.2%
2011: 1.6%
2010: 2.5%
2009: -2.8%
2008: -0.3%
2007: 1.8%
2006: 2.7%
2005: 3.3%
2004: 3.8%
2003: 2.8%
2002: 1.8%
2001: 1.0%
2000: 4.1%
1999: 4.7%
1998: 4.5%
1997: 4.5%
1996: 3.8%
1995: 2.7%
1994: 4.0%
1993: 2.7%
1992: 3.6%

  • Above 3% year over year growth is in blue

Bloomberg, CBO data

Don’t miss our next trade idea. Get on the Bear Traps Report Today, click here

Where are bond yields going with debt on the rise?  Click here for our latest report.

Many left-of-center economists – and the Obama Administration – have described this era of slower growth as the “new normal.” They blame this plunge at least in part on demographic shifts such as a declining labor force participation rate and the movement of “baby boomers” into retirement. This view of America’s economic malaise is incomplete – and unnecessarily defeatist. It ignores the significant roles higher taxes and increased regulation have played in inhibiting US economic growth since the turn of the 21st century as well as our ability to fix the problems.

trade-def
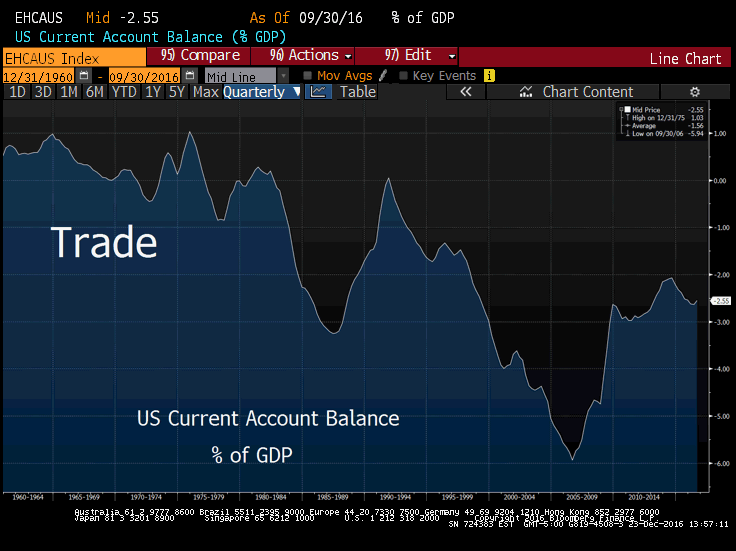
As a % of GDP, the U.S. trade deficit is still in a long term secular down trend.

This new normal argument also ignores the self-inflicted negative impacts from poorly negotiated trade deals and the failure to enforce them. One need look no further than the lengthy list of transgressions detailed in the National Trade Estimate for examples. These bad deals include most notably NAFTA, China’s entry into the World Trade Organization in 2001 – a critical catalyst for America’s slow growth plunge – and most recently Hillary Clinton’s debilitating 2012 South Korea trade deal.

To view the rest of this report, trade winners and losers in 2017, click here:


Don’t miss our next trade idea. Get on the Bear Traps Report Today, click here
Facebooktwittergoogle_plusredditlinkedintumblrmail

Facebooktwitterrssyoutube

Bitcoin Gaining on Gold

Don’t miss our next trade idea. Get on the Bear Traps Report Today, click here

Where are bond yields going with debt on the rise?  Click here for our latest report.

The Surge
Bitcoin prices have skyrocketed this year as crypto-currency has been a direct beneficiary of Chinese capital outflows.

Having analyzed the flow data, it is fairly obvious to us that the heaviest volume is coming from China. Remember, that as of 2013,  Chinese regulators have designated Bitcoin as a commodity and not currency, which makes it more difficult for the foreign exchange regulators.

As the Chinese fear continued domestic currency weakness, they have loaded up on alternatives such as Bitcoin.

btc-v-cnh
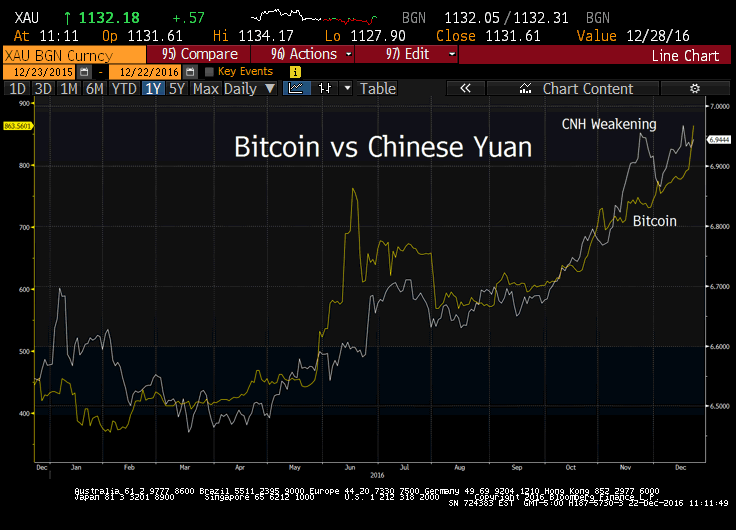
The correlation is staggering. Bitcoin seems to be the valve in which the Chinese are expressing their domestic currency concerns. As we see above, weakness in the Yuan has a very high correlation to rising Bitcoin prices.

Leaving Gold Behind

gold-bitcoinAfter many years of underperformance, Bitcoin is chasing gold in the world of alternative currencies.

The Bitcoin – Blockchain Connection

In 2017, Blockchain technology is poised to bring efficiencies to several applications from medical records to smart contracts. One application in particular that has been generating a lot of discussion is blockchain’s potential to bypass the current system of processors and intermediaries deliver real-time payments. This development could solve low-income consumer problems such as overdraft fees.

Under the current system, the Federal Reserve processes debit card transactions once at the end of each day, checks can take 2-5 days to clear, and credit card fees are taken from merchants and divided among banks, issuers, processors, and consumers. Initiatives such as the Fed’s Faster Payments Task Force aim to allow real time payments in a fast and secure manner that eliminates the need for many of the middlemen in the current system.

Don’t miss our next trade idea. Get on the Bear Traps Report Today, click here

Click here for our latest report on Blockchain

Facebooktwittergoogle_plusredditlinkedintumblrmail

Facebooktwitterrssyoutube

Groundhog Day

Don’t miss our next trade idea. Get on the Bear Traps Report Today, click here

Where are bond yields going with debt on the rise?  Click here for our latest report.
*FED OFFICIALS SEE THREE 2017 RATE HIKES VS TWO IN SEPT. DOTS
*FED RAISES RATES BY 25 BPS, REPEATS GRADUAL POLICY PATH PLAN
*FED: POLICY SUPPORTING `SOME FURTHER STRENGTHENING’ ON GOALS
*YELLEN: THERE MAY BE SOME ADDITIONAL SLACK IN LABOR MARKETS
*YELLEN: FISCAL BOOST NOT OBVIOUSLY NEEDED FOR FULL EMPLOYMENT
*EMERGING MARKET CURRENCIES CONTINUE PLUNGE AGAINST THE DOLLAR

Global Credit Explosion, Debt Denominated in US Dollars*

2016: $52T
2010: $31T
2005: $22T
BIS data

“Credit risk on the heels of China’s aggressive currency devaluation will veto the Fed’s desired policy path in 2016.  They must pull out the fire hose, kill their planned 2016 (4) rate hikes and talk down the dollar.  The winners? Gold, Emerging Markets and Oil.”

The Bear Traps Report, February 2016


Don’t miss our next trade idea. Get on the Bear Traps Report Today, click here

Where are bond yields going with debt on the rise?  Click here for our latest report.

Once Again, the Fed is Staring Down the Barrel of a Run Away Dollar

Currency Pain Since US Election

Japan -14.3%
Turkey -11.4%
Mexico -10.8%
Argentina -6.6%
Brazil -6.6%
Europe -6.4%
S Africa -5.8%
Korea -4.1%
Indonesia -2.5%
India -2.0%
China -1.9%*
Russia +3.3%

Bloomberg

*China is the big loser since the election, global populism is NOT China’s friend.  Competitive currency devaluations above are stealing billions in trade dollars from China.  The U.S. dollar’s surge has ugly side effects.

Easy Money Fed policy has enticed countries and companies around the world to borrow in dollars. We have witnessed a colossal leverage expansion. A substantially stronger dollar makes these debts even larger, much harder to repay. As we witnessed in February, credit risk vetoed the Fed’s desired policy path, their goal of four rate hikes in 2016. This “chicken out” by the Fed was almost entirely dollar driven, or what we call “handcuffs.”

dxy-new-3
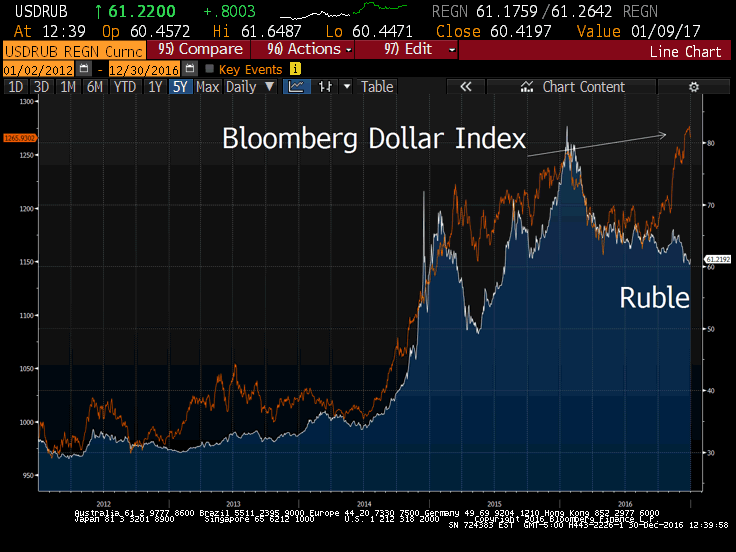
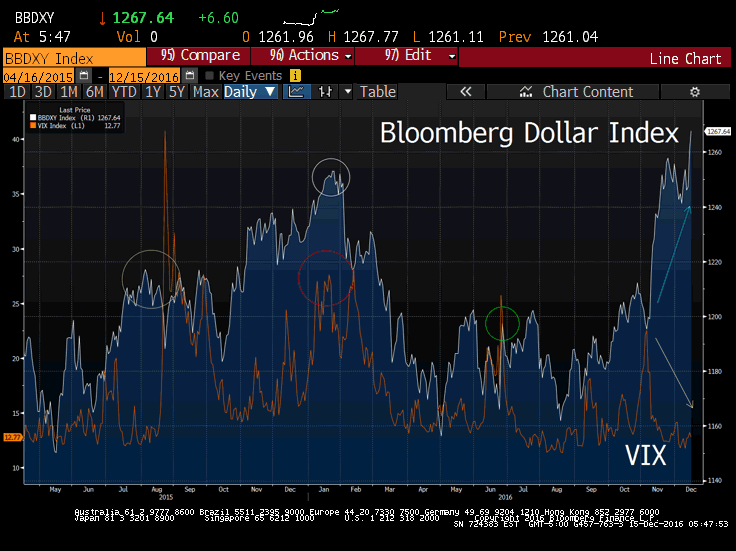
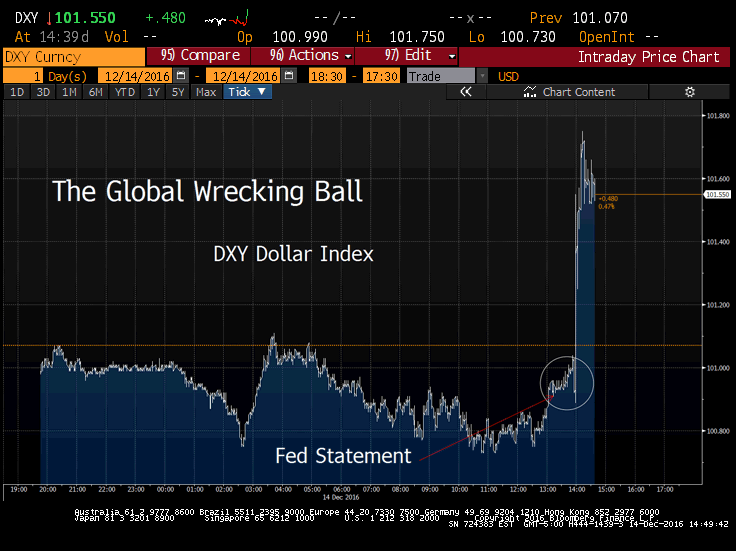
The Dollar trades at elevated levels, something the global economy will struggle with. The effects of Dollar’s double edged sword will be felt in Q1 2017. Bottom Line: markets are underappreciating (have mis-priced) the short term economic risks tied to the dollar’s surge coupled with the backup in rates.

Don’t miss our next trade idea. Get on the Bear Traps Report Today, click here

Where are bond yields going with debt on the rise?  Click here for our latest report.

Emerging Market Currencies in Pain

bbdxy-vs-gs

Breakouts in the Bloomberg Dollar Index have been associated with surges in U.S. equity market volatility as financial conditions have tightened globally.   The above divergence is highly unsustainable.

Don’t miss our next trade idea. Get on the Bear Traps Report Today, click here

Where are bond yields going with debt on the rise?  Click here for our latest report.

Concerned or NOT Concerned, Federal Reserve

“The Committee continues to closely monitor inflation indicators and global economic and financial developments.”

December 14, 2016 Fed Statement

“However, global economic and financial developments continue to pose risk.”

March 16, 2016 Fed Statement

S&P 500 and the Fed’s “Concern”

concerned-of-not

Over the last 18 months we’ve witnessed a humorous disconnect between the Fed’s “concerned” and “NOT concerned” position on global credit and currency risk tied to financial conditions. When the Fed expressed “concern” we were typically near market bottoms, while their position of “not concerned” were always close to near term market highs.

Fed on Global Economic Risks

March 2016: concerned (market bottom)
Dec 2015: not concerned (market high)
Sept 2015: concerned
July 2015: not concerned (market high)

Fed Calling for Nearly 16 Rate Hikes Back in 2014

Year End 2017 FOMC Forecast

dots-new-2

Back in 2014 the Fed was calling for nearly 16 rate hikes by the end of next year, but so far we’ve only seen two.  As they try and play “catch up” in an effort to save face, the big loser is China.  There’s a PRICE to pay for eight years of zero interest rate policy, it is NOT free!

Bloomberg Dollar Index and the VIX

bbdxy-and-vix

The last time the Bloomberg dollar index was this high the VIX was above 25.  Of course China accelerated their currency devaluation in retaliation to the run away dollar from August 2015 – February 2016.  Today, we have President elect Trump blasting China and U.S. “One China” diplomacy in Tweets while the dollar is ripping in their face as well.   Bottom line: both the Fed and Trump are letting China have it, a financially painful double team.  Yellen’s hawkish tone is a slap in the face to China, talking up rate hikes only strengthens the dollar, hurts China’s competitive position in the global economy.  How will they respond???

From August to February 2015-16, China was trying to teach the White House and Treasury a lesson:

“Let your currency surge too quickly and we’ll deval our currency too quickly and upset global capital markets in an election year”

China’s Behind the Scenes Message to Washington, January 2016

One Steep VIX Futures Curve

ux2-ux8

If you model up the spread between the 2 month VIX future and the 8 month relative to currency risk (Bloomberg Dollar Index) BBDXY, vol looks the cheapest going back 18 months. Deep contago in the VIX futures curve makes ZERO sense with EM currencies in flames, thanks Janet.

After China accelerated their currency devaluation Aug – Feb, the S&P plunged 14% in an election year.  Next, the Fed pulled out the firehose and started talking down the dollar, killing their planned beloved four rake hikes.  It’s Groundhog Day just without a U.S. election in 2017.

We do have election cycles in Italy, Netherlands, France and Germany : )  More to come….

Don’t miss our next trade idea. Get on the Bear Traps Report Today, click here

Where are bond yields going with debt on the rise?  Click here for our latest report.

Facebooktwittergoogle_plusredditlinkedintumblrmail

Facebooktwitterrssyoutube

Saudi Minister says they will cut production BELOW level agreed with OPEC

*TRUMP SAID TO PICK TILLERSON ( AS SECRETARY OF STATE): NBC NEWS

Don’t miss our next trade idea. Get on the Bear Traps Report Today, click here

Where are bond yields going with debt on the rise?  Click here for our latest report.

Exxon Mobil Corp. Chief Executive Officer Rex Tillerson has emerged as the leading candidate for secretary of state in President-elect Donald Trump’s administration, according to two people familiar with the matter.

Mitt Romney, who was the 2012 Republican nominee for president and a critic of Trump during this year’s campaign, remains on the short list of candidates, according to the people, who has asked for anonymity because the discussions are private. Trump has said he will make an announcement next week. – Bloomberg

*SAUDI MINISTER SAYS COUNTRY TO CUT BELOW LEVEL AGREED WITH OPEC

*IRAN OIL MINISTER SAYS NON-OPEC WILL CUT BY ABOUT 600K B/D

*SAUDI CUT BELOW 10 MLN B/D WOULD BE LOWEST SINCE FEB. 2015

*SAUDI ARABIA’S FALIH: POSSIBLE THAT DEAL MAY END IN MID-2017

Don’t miss our next trade idea. Get on the Bear Traps Report Today, click here

Where are bond yields going with debt on the rise?  Click here for our latest report.

Khalid Al-Falih says at press conference in Vienna that country will cut substantially from Jan. 1.

Saudi Arabia agreed to production limit of 10.058 mln bld,
a cut of 486,000 b/d from Oct. levels.

Russia and several other non-OPEC nations pledged to curb oil production next year at a meeting in Vienna, joining forces with the Organization of Petroleum Exporting Countries to end a global glut that’s crashed oil prices and shaken energy-rich economies.

The pact — the first between the two sides in 15 years — involves a reduction of 558,000 barrels a day from non-OPEC countries starting in January, Iraq Oil Minister Jabbar Al-Luaibi said on Saturday after the meeting ended.

The agreement represents the strongest effort yet by oil-rich countries, from giants such as Saudi Arabia and Russia to tiny producers including Bolivia and Equatorial Guinea, to end a market share war that has shaken investors, hit energy companies and damaged economies. – Bloomberg

Facebooktwittergoogle_plusredditlinkedintumblrmail

Facebooktwitterrssyoutube

Deals and Debt Load in Trump 2017

Don’t miss our next trade idea. Get on the Bear Traps Report Today, click here

Breaking: Third Quarter GDP in at 3.5%

Annual GDP growing 1.9%

Q4: 2.6%*
Q3: 3.5%
Q2: 1.4%
Q1: 0.9%

*Per Atlanta Fed from Dec 16, 2016

Where are bond yields going with debt on the rise?  Click here for our latest report.
Yesterday, the lame duck Congress was able to avoid the annual government shutdown risk surge, there were less games – more action.  Ultimately, the big showdown is next year at the start of Donald Trump’s presidency.

Trump Tax and Foreign Policy: Winners and Losers

Stocks, Bonds, Currencies and Commodities Since the Election*

Russell: 21%
Russia: 18%
Brent: 17%
Copper: 14%
Mexico: 8%
S&P 500: 8%
EuroStoxx 600: 6%
Brazil: 5%
Nasdaq 100: 5%
Emerging Markets: 5%
China: 4%
Dollar DXY: +4%
FANG Stocks: 0%
Treasuries: +65bps in yield, US 10 year
Gold: -9%

*Bloomberg data, from the November lows near election day, FANG = Facebook, Amazon, Netflix, Google

*SENATE PASSES STOPGAP U.S. SPENDING BILL, AVERTS FUNDING LAPSE

The Senate passed 63 to 36 a stopgap spending bill, funding the government through April 28, averting a shutdown but putting off a long list of decisions on bills to finance the rest of the fiscal year through October.

That lawmakers are heading toward a potentially time-consuming fight over spending in the spring that could test the limits of newfound Republican unity with Trump and eat up valuable time, delaying other legislative priorities.

Don’t miss our next trade idea. Get on the Bear Traps Report Today, click here

Click here for our latest report.

Today’s Federal Budget Deficit is Substantially Greater than those Found in the Bush and Clinton Economic Recoveries

deficit

The deficit as percentage of GDP has come down considerably over the Obama years. Of course, when Obama took over the White House the economy was in a recession.  Naturally government deficits rise and GDP falls in economic downturns, which makes this number more negative (-10.2% in 2009 above).  However, over the Obama years deficits have been lower as the recovery took hold.  Trump and his aggressive pro-growth plans will likely reverse that trend, until the growth follow through offsets it.  We’ll see a return to supply side economics in the years to come, Trump wants to use tax cuts to stimulate growth.
Percentage of US Government spending on entitlements and debt
interest payments:

2015: 71%
1965: 26%
CBO

In 8 years of the Obama administration, the U.S. didn’t achieve one year of year over year +3% growth.  That has not happened in nearly 100 years.

U.S. Real Year over Year Annual GDP

2016: 1.8%
2015: 2.6%
2014: 2.4%
2013: 1.7%
2012: 2.2%
2011: 1.6%
2010: 2.5%
2009: -2.8%
2008: -0.3%
2007: 1.8%
2006: 2.7%
2005: 3.3%
2004: 3.8%
2003: 2.8%
2002: 1.8%
2001: 1.0%
2000: 4.1%
1999: 4.7%
1998: 4.5%
1997: 4.5%
1996: 3.8%
1995: 2.7%
1994: 4.0%
1993: 2.7%
1992: 3.6%

  • Above 3% year over year growth is in blue

Bloomberg, CBO data

Don’t miss our next trade idea. Get on the Bear Traps Report Today, click here

Where are bond yields going with debt on the rise?  Click here for our latest report.


nation-debt
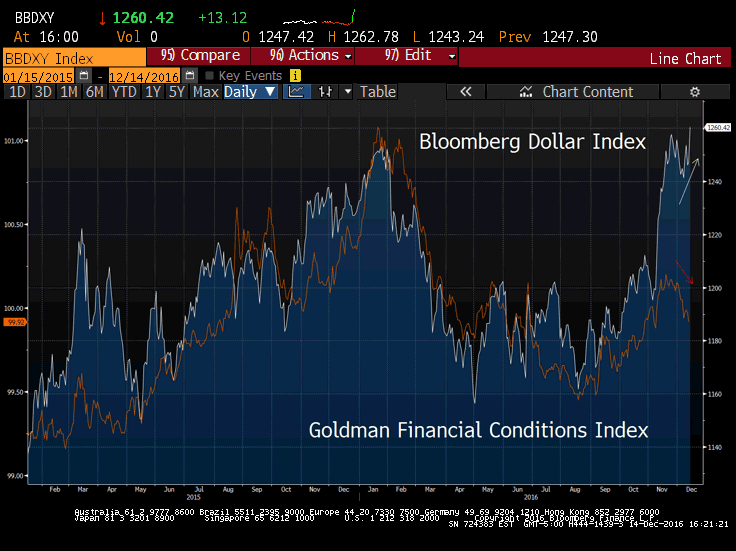
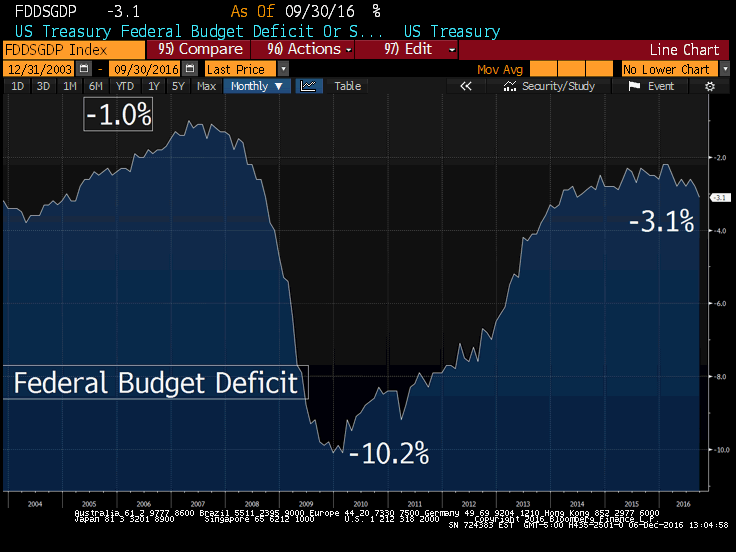
The Trump administration and Congress of 2017 have a colossal collection of goals for their first 100 days; a) filing and (Congress) approving Cabinet posts, b) a Supreme Court vacancy, c) corporate and individual tax reform, d) replace and repeal of Obamacare and reversing a long list of regulations issued by the outgoing Obama administration in its final months. Adding the need to fund the entire federal government makes all of those objectives even more difficult.  As you can see above, the Federal deficit is near unsustainable proportions.  The U.S. needs far more than 1.7% GDP growth to support this debt load.

U.S. Federal Spending as a % of GDP

16: 35%
10: 33%
00: 29%
90: 32%
80: 30%
70: 29%
60: 23%
50: 19%
40: 14%

Arthur Brooks, CBO, Treasury data

“The Federal Reserve’s decision to raise interest rates is a warning sign to government budget watchers. The combination of rising debt levels and rates will lead to soaring interest payments, putting a strain on U.S. purse strings. A measure known as net interest costs — which balances what the government receives in interest payments against what it pays on debt — is already set to nearly triple by 2026, to $712 billion, or 2.6 percent of gross domestic product, according to the Congressional Budget Office forecasts from August. That figure soars to nearly 6 percent of GDP by 2056.”

Bloomberg, December 2016

Tax Reform and Side Effects

Front and center, corporate tax reform tied to infrastructure, will be priority number one in our view. The prospect of tax reform and a lower rate have already played a big role in equity market returns. The Russell 2000 is up 17% year-to-date and 11% since the election. The S&P 500 is only up 8% year-to-date and 3.1% since the election. Many mega-cap S&P companies have already used tax shelters such as Ireland, which has a corporate tax rate of 12.5% (vs 38% in the U.S.). The market is now rewarding companies who will see the biggest nominal effective change in the reduction of their corporate tax rate.
FANG stocks, who have been famous for using other countries as a base in order to pay less in taxes, have been punished relative to domestic retailers and energy companies who have very high effective tax rates.

See the report below, click on the link.

Don’t miss our next trade idea. Get on the Bear Traps Report Today, click here

Click here for our latest report.


Facebooktwittergoogle_plusredditlinkedintumblrmail

Facebooktwitterrssyoutube

Heading into the Fed Meeting, Mortgage Rates Surge Most since 2013

Mortgage rates went up for the ninth time in 10 weeks. The good news is that they aren’t rising as fast as they were a few weeks ago.
The Federal Reserve’s monetary policy committee is scheduled to meet next week, and mortgage rates usually don’t move much in the week preceding a Fed meeting. The Fed is expected to raise a short-term interest rate by a quarter of a percentage point. Economists and mortgage bankers say that the increase already has been “baked into” mortgage rates.
Economic Fallout from Mortgage Rate Surge?

mbs-rates

The benchmark 30-year fixed-rate mortgage rose this week to 4.15% from 4.13%, according to Bankrate’s weekly survey of large lenders. A year ago, it was 4.06%. Four weeks ago, the rate was 3.73%.  We’re focused on the follow on impact; home builders and prices, regional banks and the U.S, consumer. 

Pick up our latest report on interest rates, sectors for 2017 here:


Don’t miss our next trade idea. Get on the Bear Traps Report Today, click here

Click here for our latest report.


Facebooktwittergoogle_plusredditlinkedintumblrmail

Facebooktwitterrssyoutube