
Join our Larry McDonald on CNBC’s Trading Nation, Wednesday at 3:05pm ET
Pick up our latest note here:
Don’t miss our next trade idea. Get on the Bear Traps Report Today, click hereUpdated 4/5/17 at 7:10AM ET
In his just released annual letter to shareholders, the CEO of the largest bank in America repeats a warning heard in recent months across this great land.
“It is Clear that Something is Wrong with the U.S.”
When a political novice wins the U.S. Presidential Election with 84% of U.S. counties (2623 of 3112), it’s important to dig deeper than Russian hacking, there’s far more here than meets the eye.
“It is understandable why so many are angry at the leaders of America’s institutions, including businesses, schools and governments. This can understandably lead to disenchantment with trade, globalization and even our free enterprise system, which for so many people seems not to have worked.”
Jamie Dimon, CEO J.P. Morgan
U.S. Credit Deterioration is Picking Up Steam, Fastest Since Lehman
Hardly anyone has noticed, but in the fourth quarter of 2016 there was a surge in financial stress across America, a shift in financial conditions that may have had a hand in the election outcome.
Am I more Likely to Default on a Loan Payment in the Next 12 Months*
Age 35-46 Years Old: 21% vs. 16%
Age 21-36 Years Old: 37% vs 24%
*Data looking at Q4 2016 vs Q4 2015
UBS Evidence Lab
The cycle is turning, right before our very eyes. In recent months, we’ve found a substantial amount of evidence in capital markets pointing to credit formation reaching a saturation point.
December 2016, a Turning Point
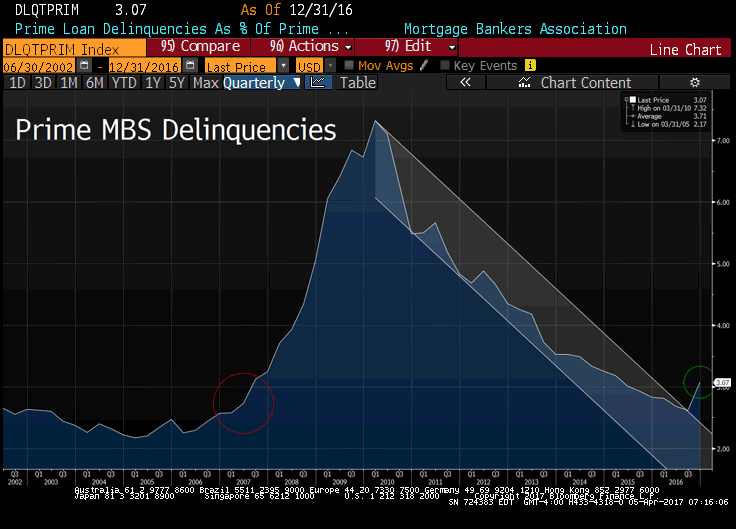
If you look at high quality prime loans, there’s more evidence of a credit event in December 2016. Across the board in consumer credit we witnessed spikes in credit card charge offs, auto loans gone bad, sour commercial real estate, student loans and an uptick (above) in Prime Mortgage Delinquencies.
We’re seeing surging defaults in commercial real estate securitization pools, credit card receivables and even prime auto loans. The icing on the credit cake is margin debt’s historic rise. Equity bears have been talking up this leverage class since 2014, but this time there’s far more collateral evidence of easy credit “saturation.”
Credit Rolling Over Faster than anytime Since Lehman Brothers
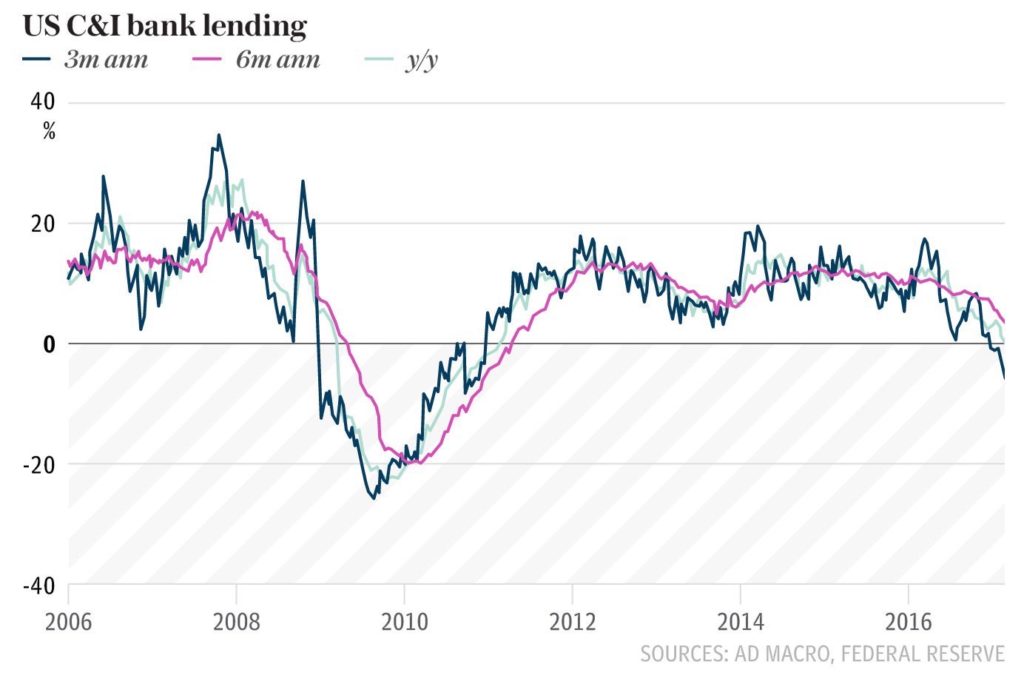
Every day, December 2016 is looking more and more like December of 2007. The credit deterioration has been sharp and swift. After auto loans, credit card receivables and commercial real estate; Commercial and Industrial loans is another area we have our eye on. This $2T segment of the U.S. financial system hit an air pocket during the last three months of 2016 with non-residential property financing in a 5.5% plunge, a rate of change to the downside not seen since 2008. Special thanks to the Telegraph for this chart.
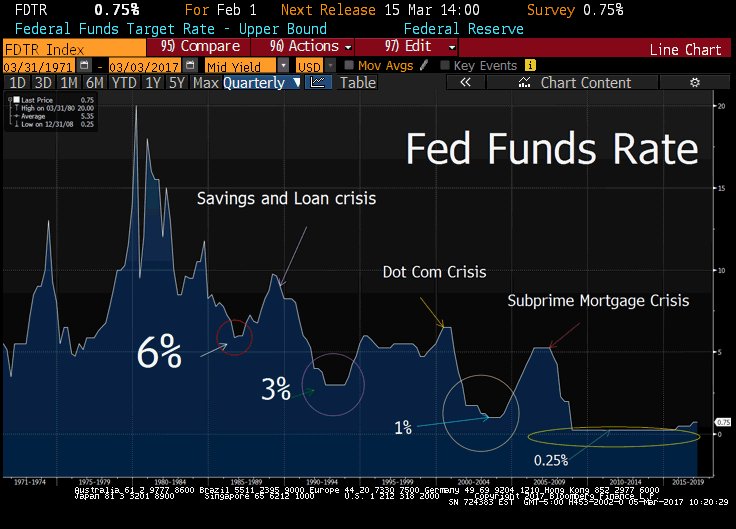
Corporate lending is in meaningful contraction as the U.S. Federal Reserve has finally initiated their rate hiking cycle. The Fed hiked rates for the third time in two years in March. Once again, central bankers are smoking in the dynamite shed, they’ve waited far too long to raise rates. They’re clearly tightening monetary policy into ugly credit deterioration.
Listen to Economists or Data?
In many spots around the economy, data is rolling over but the survey sentiment remains strong?
“While the Fed is worried about the economy overheating, bank loans and leases continue to slowdown on a year over year basis. Part of the reason we think the economy is actually losing steam is because of this precipitous fall in lending (credit contraction) over the past year.”
The Bear Traps Report, March 10, 2017
Equity market’s hopes are pinned high on a economic shot of adrenalin from Washington, but a fumble (Paul Ryan’s Health Care Repeal and Replace failure) up on Capitol Hill has fiscal stimulus well over a year away in our view. This is looking more and more like a bridge too far.
Pick up our latest note here:
Don’t miss our next trade idea. Get on the Bear Traps Report Today, click hereAtlanta Fed Q1 GDP Forecast in the Month of March
2017: 1.0%
2016: 0.6%
2015: 0.2%
2014: 0.7%
Do you think there’s a seasonal GDP problem here with the Atlanta Fed reading? For sure, Q1 has consistently been an under-performer over the last four years.
As bond bulls in a sea of bears in 2015, we made a stand. Back then, Wall Street (consensus estimate from economists) was calling for ten Fed rate hikes in 2016-17. We argued, because of the colossal debt build 2006-2015, a small 25bps hike has the destructive power of three interest rate hikes.
One Hike = Three Hikes
“One of the most popular bond indices, the Barclay’s U.S. Aggregate, has a market value of $17.9 trillion today. This compares to a market value of $8.3 trillion at the time of the last Fed rate hike on June 29, 2006. A look around the world is an eye opener; the Barclay’s Global Aggregate has a market value of $42.2 trillion versus $21.9 trillion on June 29, 2006. Some of this is already priced in of course, but the quick and dirty calculation tells you that for the U.S. Agg, a 25bps hike has 2.53x the impact of a 2006 era move and for the Global Agg, the impact is around 2.36x a 2006 era move in terms of the value of immediately repriced assets. This gives the adage “interest rates up, bond prices down” profound new meaning. Put another way, the amount of losses by global bond investors in percentage terms for a given hike in rates is around 2.5x as powerful as it was the last time the Fed hiked rates over nine years ago. So might 25bps act a bit more like 62.5bps. We’re bond bulls, NOT bears, Wall St. has rate hikes wrong.”
Quote from The Bear Traps Report, September 2015
Pick up our latest note here:
Don’t miss our next trade idea. Get on the Bear Traps Report Today, click hereM1 Money Supply Growth Rolls BEFORE Recessions
Chart 1970-2017
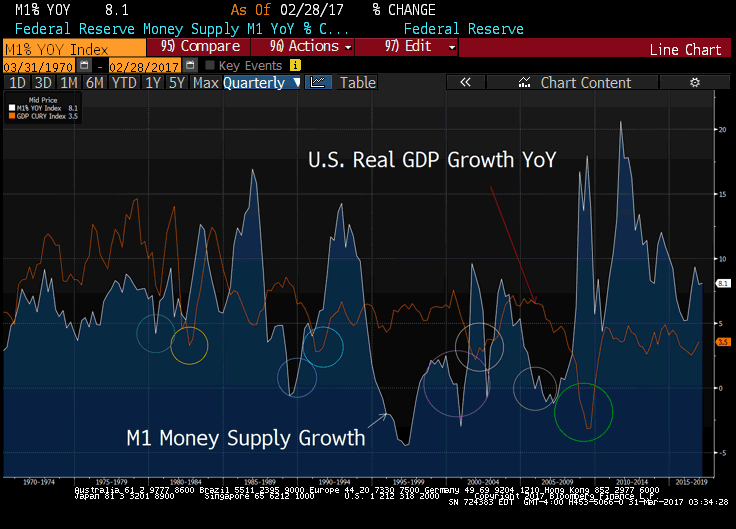
Above, the red line and circles represent recessions and the white line shows us M1 money supply growth. As banks pullback from lending M1 contracts, typically out in front of recessions. As you can see above, M1 has been trending lower since October’s 10.8% growth rate, to 8.1% in February. The good news is we’re far from the real danger zone for M1 growth. Ahead of the 2008, 2000 and 1990 recessions, each time M1 was negative 6-9 months prior to real economic stress. On the other hand, the U.S. economy heading in that direction, our model will be focused here in the months to come.
Stocks and Borrowed Cash: Margin Debt Surged to 58-Year High at Trump Rally’s Peak
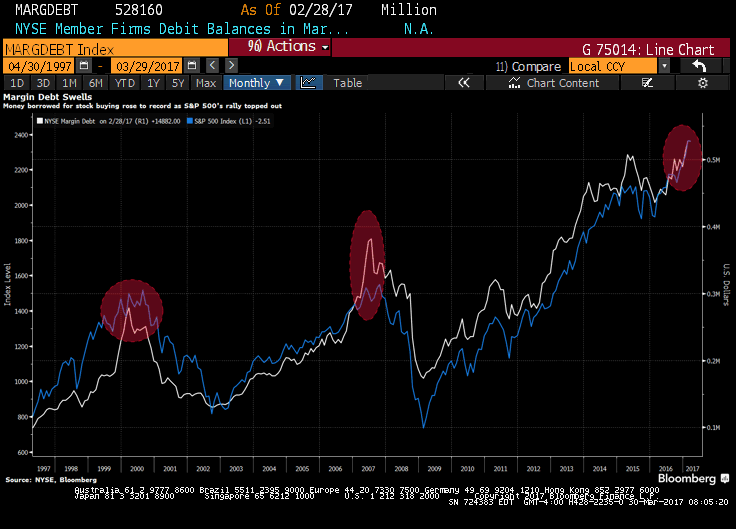 “A record $530 billion was extended as credit by brokerages for stock buying at the end of February as the post-election rally peaked, according to data released Wednesday by the New York Stock Exchange. While some investors interpret such speculative buying as signals of imminent market reversals, Michael Shaoul, chief executive officer of Marketfield Asset Management, says that’s not the case. He notes that the current pace in equity credit growth is nowhere near where it was in 2000, and the cost to borrow only slightly exceeds the 1.97 percent yield that S&P 500 companies offer as dividends.”
Bloomberg
Pick up our NY Times bestseller here:
Stocks Bought with Borrowed Money
March 2017: $530B*
2007: $390B
2000: $285B
*58 year high
Bloomberg data
Pick up our latest note here:
Don’t miss our next trade idea. Get on the Bear Traps Report Today, click herePick up our latest report here:
Don’t miss our next trade idea. Get on the Bear Traps Report Today, click hereConsumer Credit Deterioration and Subprime Auto Loan Defaults touch highest level since Financial Crisis
U.S. subprime auto lenders are losing money on car loans at the highest rate since the aftermath of the 2008 financial crisis as more borrowers fall behind on payments, according to S&P Global Ratings. Losses for the loans, annualized, were 9.1% in January from 8.5% in December and 7.9% in the first month of last year, S&P data released March 10, 2017.
Motor Vehicle Loans Owned & Securitized
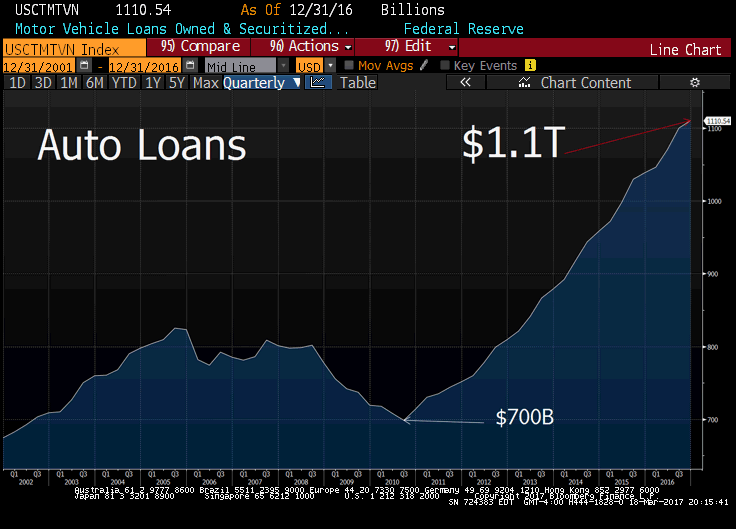 So, lets get this straight. We have an economy near full employment in what every economist on Wall St. calls a strong jobs market, with surging auto loan defaults? This is moral hazard gone bad, the Fed has kept interest rates so low for so long – the net result? We have an ugly, smelly pile of bad loans on our hands. In 2006, clueless economists lectured us “we cannot have a surge in home mortgage defaults with the labor market as strong as it is.” That was their “blind spot.” Trying to manage risk while looking at stale, traditional economic metrics, it’s pathetic.
Supply of Automobiles at 30 Year High, Outside 2008-9 Recession
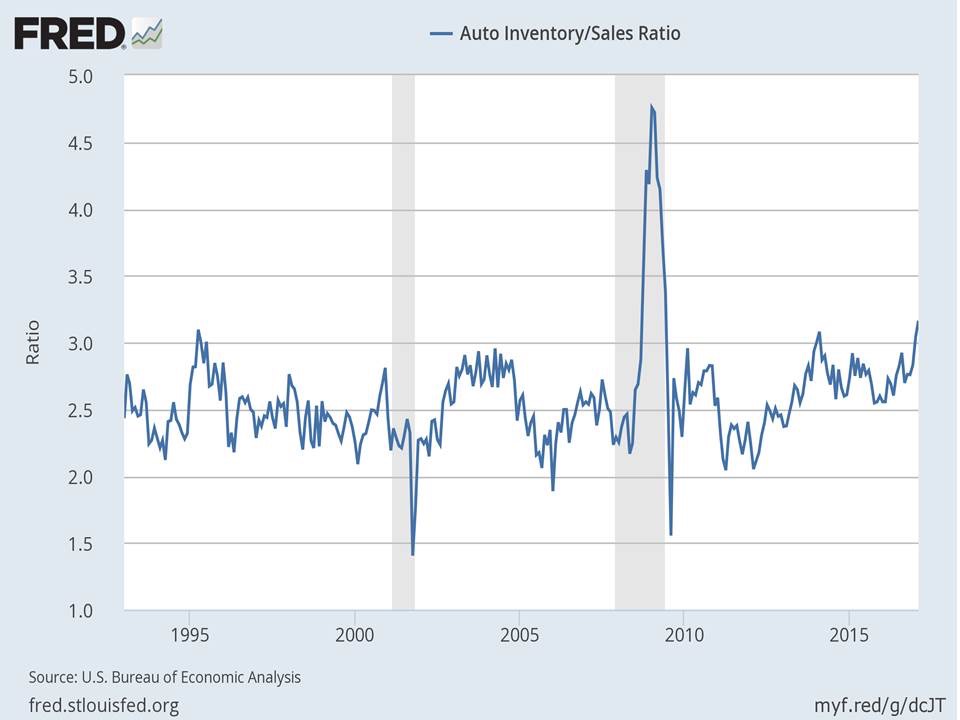
This is an eye opener, record supply level vs sales. It speaks to credit market saturation, sellers simply cannot find more “qualified” buyers. They’re reaching deeper into the risk spectrum.
Deleveraging Since the Financial Crisis? It’s Leverage on Leverage
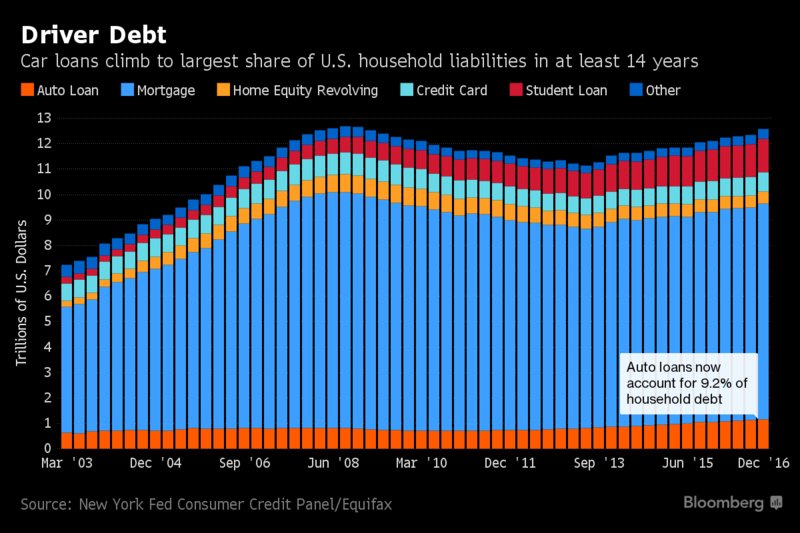
U.S. auto loans in the fourth quarter reached about 9.2% of all household debt, the highest share in data going back more than a decade. the average amount used to finance a new-car loan also reached a record $29,469, according to Bloomberg. To support sales growth and keep monthly car payments affordable, lenders have been lengthening the terms of loans to consumers — in many cases as long as seven years. It’s pure comedy, an asset that depreciates faster than a summer vacation is receiving longest term financing ever?!
The Great Enabler that is the Federal Reserve
As central banks suppress the natural level of the cost of capital, a moral hazard oozes through capital markets. The bottom line, money ends up in places it just shouldn’t be as investors reach and reach and reach for yield. Interest rates should be used to price risk, today the risk-pricing mechanism hasn’t simply collapsed, it’s toxic.
Ally Pain, Ally Financial Inc.
“As you’ve heard from many lenders, we’re closely watching the environment, and we’ve seen some more noticeable shifts recently…
Consumer losses have also been drifting higher, and most notably in lower credit tiers. You’ve heard back from others as well. We have seen some additional deterioration in the first quarter, and we believe that the delayed tax refunds may have had an impact here.”
Jeffery Brown, Ally Financial CEO, March 21, 2017
U.S. Credit Card Delinquencies
2016: +9%
2015: -9%
2014: -15%
2013: -21%
2012: -30%
2011: -38%
2010: -11%
2009: +38%
2008: +30%
2007: +6%
Four quarter, rolling % change
Thomson Reuters Data
Nearly $1.3T of Subprime Debt in the USA
Here’s the Breakdown
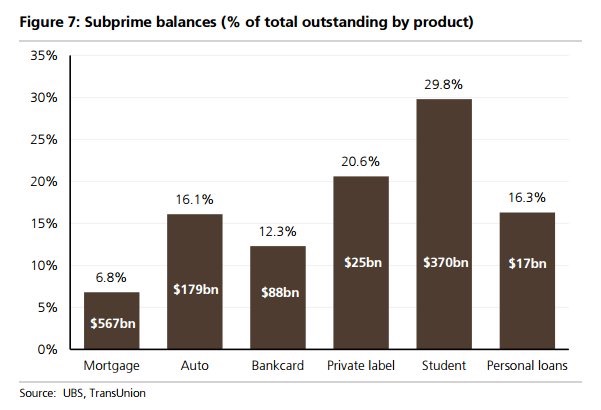 We’ve come full circle since “A Colossal Failure of Common Sense” (our 2009-10 global best selling book, now published in 12 languages). Over the last 100 years, after each financial crisis there’s a spectacular metamorphosis. It’s a transformation into another serpent, another beast and it’s powerfully depicted above. The mortgage market has “found religion,” only 6.8% of financing for new homes is subprime. Flowing down hill (thanks to Central Banks – Ben and Janet), the water has simply found its way to another location. Nearly nine years after Lehman’s failure, we’re seeing a substantial increase in risky lending in places like student loans, credit card and auto loans.
Q4 Data, U.S. Credit Card Charge-off Quarterly
2016: $8.5B
2015: $6.6B
2014: $6.5B
2013: $6.9B
2012: $7.8B
Fitch, Fed data
Once again, credit card delinquencies should NOT be going up with the economy at full employment. Any first year economist out of college can tell you that, BUT they are. At some point when the Fed’s easy money policy reaches the saturation level in the economy, even with a decent jobs market, credit quality deteriorates. This is clearly happening now in our view.
Defaults on Student Loans
2016: 4.2m
2015: 3.6m
2014: 2.9m
Roughly 1.1. million borrowers entered default on their Direct Loans, a type of federal student loan, last year, about the same as the previous year, according to an analysis of publicly available government student loan data by Rohit Chopra, a senior fellow at the Consumer Federal of America, a network of more than 250 nonprofit consumer groups. Overall, there were 4.2 million borrowers in default in 2016, up 17% from 3.6 million the year before, as some borrowers exited default while others remained in the red. – Marketwatch data
Non-Housing U.S. Consumer Debt Load*
2017: $3.8T
2007: $2.5T
*Auto, credit card, student loans, other
NY Fed, Equifax Data
From Our Friend Chris Whalen
An early voice heading into the 2008 credit crisis, Chris Whalen is a man to listen to. He’s one of the best bank credit analysts from Wall St. We recap a section of his blog “Citigroup: Canary in the Coal Mine” below.
Credit Divergence: Citi vs JP Morgan
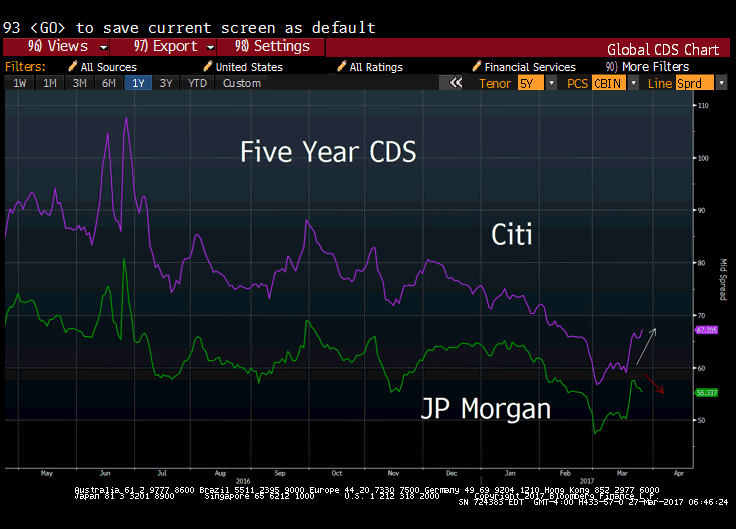
“Even today, the relatively elevated credit profile of Citi’s customer base is reflected in a gross loan charge-off profile that at 126bp at the end of 2016 is more than a standard deviation higher than the average for the large bank peer group. Loss given default (LGD) for Citi is almost 80%, again far higher than large cap asset peers like JPMorgan (NYSE:JPM) and Bank of America (NYSE:BAC). Indeed, Citi in credit terms is really more comparable to below-prime lenders such as CapitalOne (NYSE:COF) and HSBC (NYSE:HSBC). The 126bp of default reported by Citi in 2016 maps out to roughly a “BB” credit profile for its portfolio, again reflecting a deliberate business model choice that has selected a below-prime business as the bank’s model. COF, by comparison, reported 265bp of gross defaults at year-end 2016, roughly a “B” credit profile. COF’s loan loss rate is more than three standard deviations above the large bank peer group with an LGD of 77%, according to the TBS Bank Monitor. Of note, COF showed a risk-adjusted return on capital of just 1.6% at year end ‘16 while Citi reported a RAROC of 3.8%. Since the nominal cost of capital for most large banks is well into double digits, you may be wondering why these banks are still here. Indeed, most large banks don’t earn their cost of capital, either in nominal or risk adjusted terms. But it is only when you look at these banks based on RAROC that you understand that the big zombie banks are perennial value destroyers. Smaller regional and community banks, by comparison, routinely earn double digit real, risk-adjusted returns on capital.”
From our friend Chris Whalen
Back to Auto Loans, Prime Starting to Creep Higher
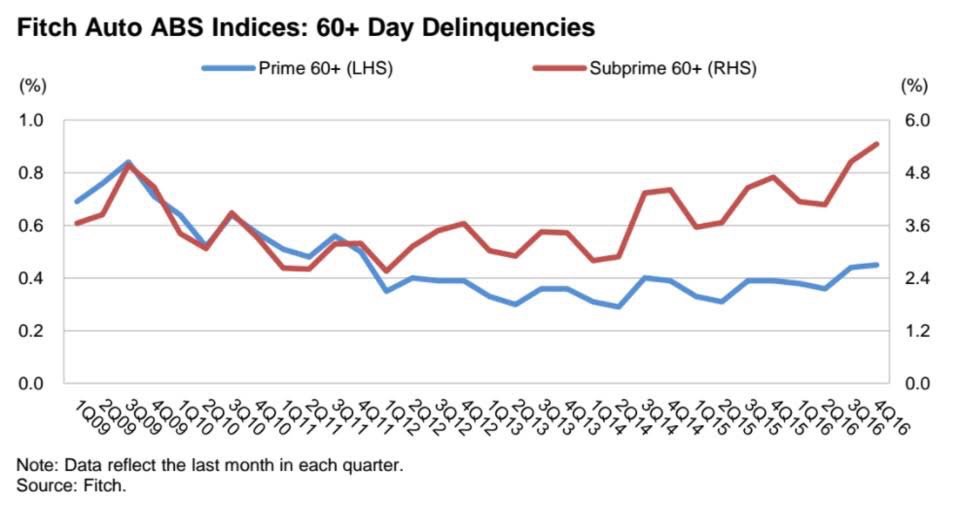
The final stage of credit deterioration’s saturation point is found in the shift over to “prime” or high quality borrowers.
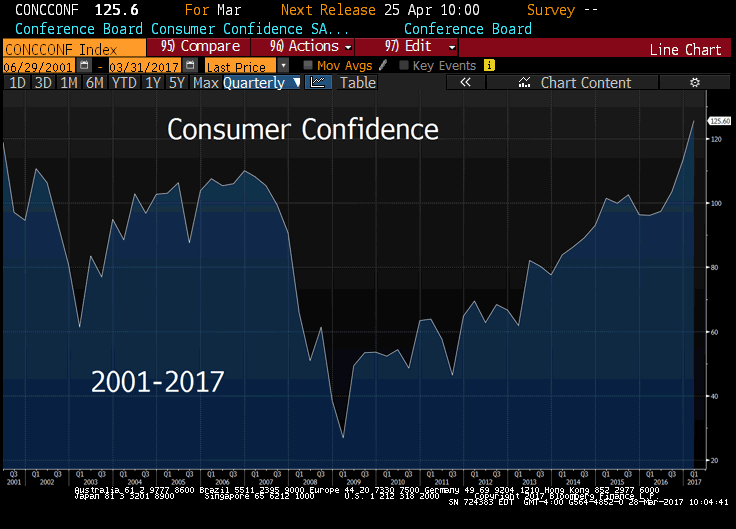 We’ve heard so much about record low approval rating for the Trump White House, but Consumers are singing a different tune.
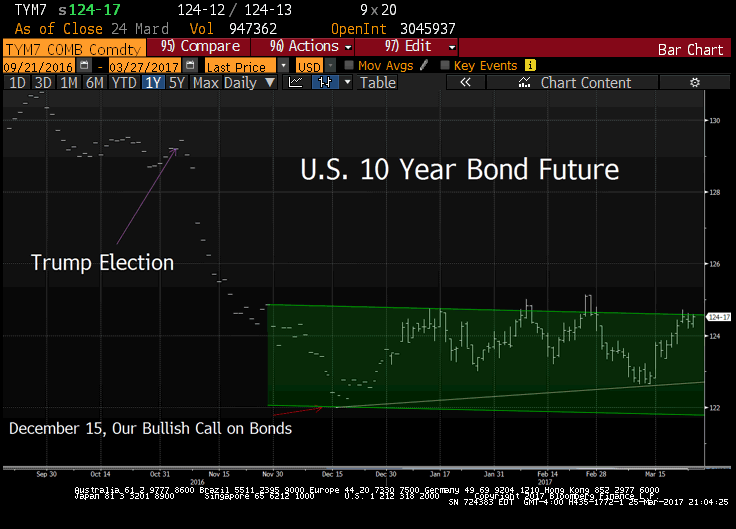
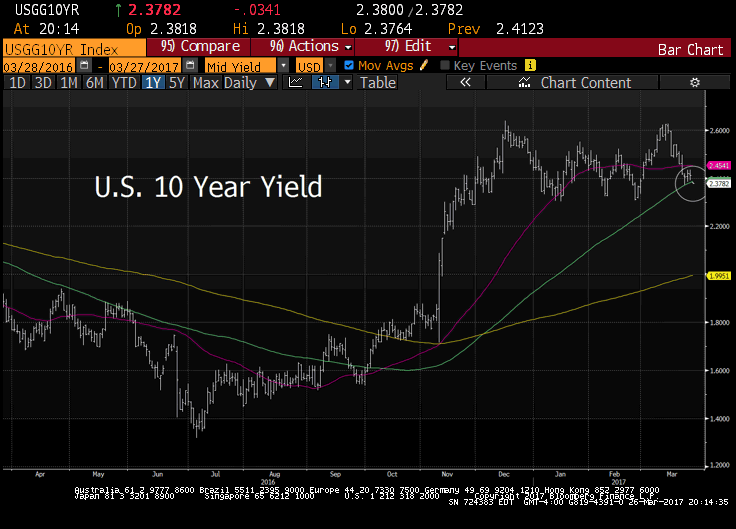 U.S. 10 year Treasury yield is through its hundred day moving average (see the green line above), the first time since October 4, 2016.
 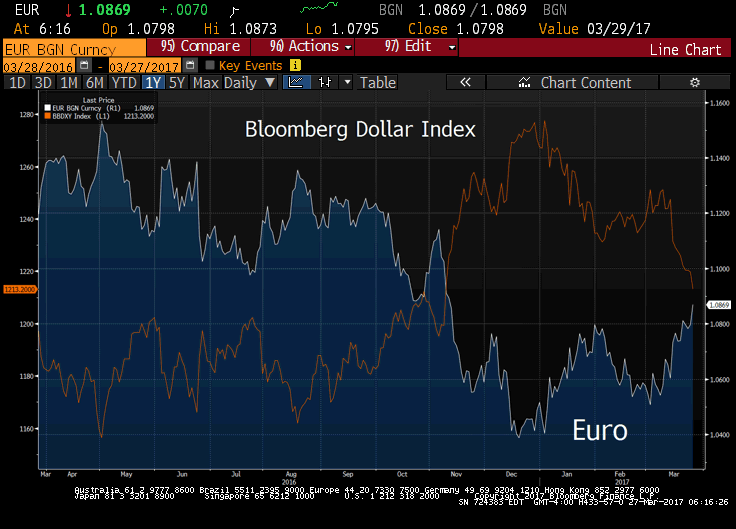 Wall St. was confident in December, they argued the ECB is in the middle of a $2.5T asset purchase program, while the Fed is hiking rates 3-4x, stay long the dollar. Wrong again. The dollar is at the same level is was during the week of the election of President Trump, it has given back all its gains.
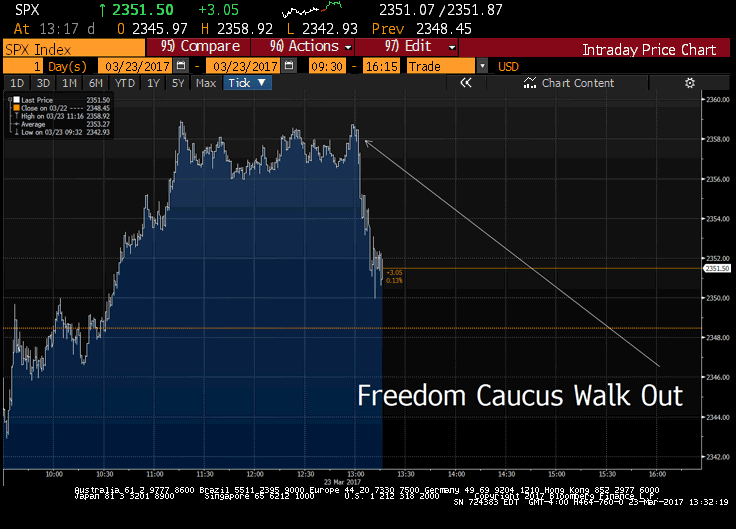 *FREEDOM CAUCUS MEMBERS SAY NO DEAL MADE: THE HILL
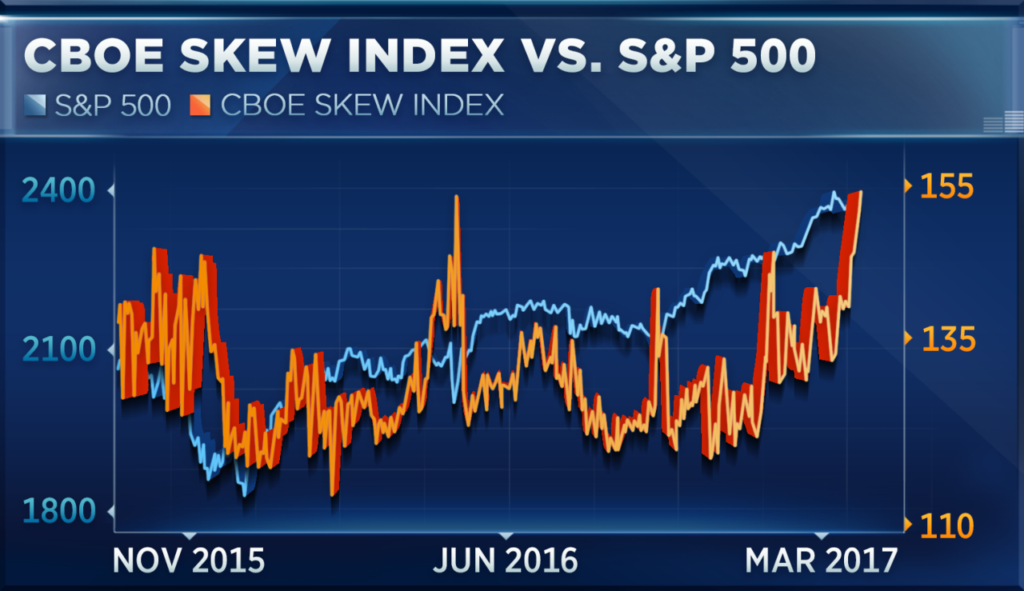
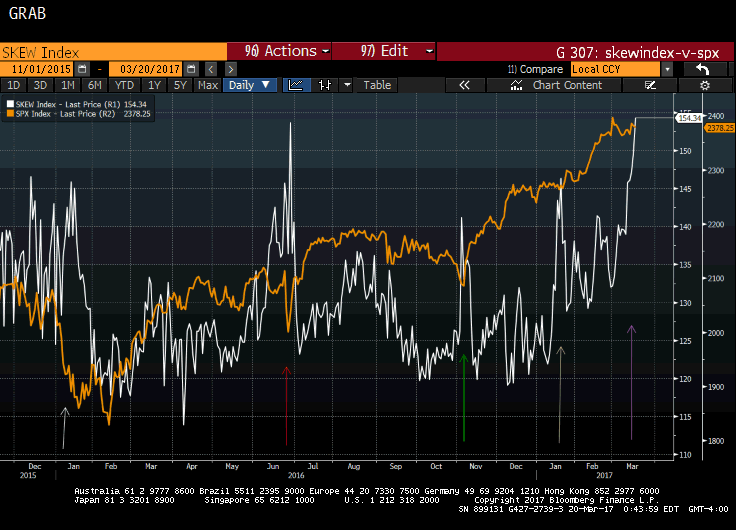 The Skew index as a measure of the slope of the implied volatility curve is as much a function of low implied volatility as it is a demand for cheap downside hedges given the low absolute premium. Note from attached chart over the last 15 months, SKEW index spikes (above) have tended to occur at interim market pull backs.
 The very soft University of Michigan 5-10 year inflation expectations gave long term bonds a bid today. Number came in at 2.2% for March vs 2.5% from February. It’s now at the lowest level since the recording began. While this survey data point does not have the biggest sample size, it does speak to longer term inflationary pressures being overstated.
