Join our Larry McDonald on CNBC’s Trading Nation, Wednesday at 3:05pm ET
1933 Industries

Pick up our latest report on China here:
Don’t miss our next trade idea. Get on the Bear Traps Report Today, click here
“It’s Checkmate Mr. Powell – There’s far too much leverage globally and domestically, as we stressed in August and September — a 25bps rate hike acts more like 75bps. With $62T of GDP outside the USA, $18T inside, U.S. economic data plays second fiddle to global credit risk, it’s that simple. U.S. economists are smoking in the dynamite shed with expectations of three to four more hikes. They were JUST AS clueless in 2015 and 2016 when they lectured us on eight rate hikes. The Fed ultimately delivered just two in those years. If the Fed plays tough guy now, equities will crash, and then they’ll be forced to cave and CUT rates! It’s checkmate, Mr. Powell. Our major concern centers around the Fed NOT shifting dovish enough. Markets now have high expectations of relief from the Fed, so they MUST deliver. We think equities rally nicely initially but then FADE hard on a Fed leaving the beast inside the market unsatisfied.”
The Bear Traps Report, December 15, 2018
Q2 2019, is it Q3 2018 in Reverse?
The beast inside the market is entering an inverse period of what occurred in the third quarter of 2018, as we look down the road ahead the implications are daunting. In Q3 2018, the global economy was effectively seeing a meaningful slowdown in growth while central bankers around the world continued to insist on “normalization” and tightening monetary policy. Fast forward to Q2 2019, there are numerous ‘green shoots’ coming to visit the global economy (positive signs) with a growth slowdown beginning to bottom, while central bankers have already thrown in the towel. Let’s take a look.
Monetary Policy Divergence to an Extreme
 It’s kind of a mind-blower. Since 2014, the European Central Bank has been in accommodation mode to the tune of a $2.7T bond-buying spree (see above) found in their colossal balance sheet expansion. At the same time in the U.S., the Federal Reserve has hiked rates nine times, eight since the 2016 election and REDUCED its balance sheet by $500B. Is the U.S. economy that much stronger than Europe’s? Clearly, there’s $62T of GDP OUTSIDE the U.S. and $18T inside – so Fed rate hikes tend to do a number on the global economy which feeds back to Europe in a negative way, which then comes back to the U.S. and stopped the Fed in its tracks (in Q1 the Fed put forth one of the most significant policy reversals in the history of central banking). A five-year-old can tell you this is a broken model. You can’t have one central bank hiking rates nine times in 3 years, and another buying up nearly $3T of global assets – markets just told us this is a highly unsustainable dynamic in modern central banking. We believe the Fed, ECB, PBOC (China), BOE (UK) now get the joke. Looking forward – we see a “convergence” in global central bank policy, NOT unsustainable divergence. This will have MAJOR implications for the dollar, precious metals and emerging market equities. Pick up our latest report here.
From the December Lows
Oil WTI: +51%
Semiconductors SOX: + 46%
China Internet $KWEB: + 34%
Nasdaq 100 NDX: + 30%
Greece $GREK: + 27%
S&P 500: + 23%
Eurozone Banks $EUFN: + 21%
MSCI World: + 20%
Retail XRT: + 19%
Copper: +16%
MSCI Emerging Markets $EEM: + 17%
MSCI World (ex USA): + 14%
Brazil $EWZ: + 12%
Junk $JNK: + 10%
Gold: + 7%
Bloomberg terminal data
A Global Central Bank Cave-athon
Central banks have proactively shifted to a dovish policy stance trying to get ahead of economic data weakened further. Instead of waiting for economic data to truly justify caving on tightening monetary policy, central banks threw in the towel early and are now in ‘wait and see’ mode. This is a dramatic shift, and risk assets such as equities have been pricing this in, NO news here. We have gone from a world where headwinds to growth are becoming tailwinds. The Fed’s cave, China economic growth has stabilized, a weakening US Dollar (Bloomberg dollar index off 1.7% since November), and softer trade headlines on a possible deal – assets prices have been pricing in these positive developments for months. Since Q3, we have been overweight emerging markets. Six months ago, EM was dealing with a tightening Fed, a stronger US Dollar, Brexit risk and a slowing economy in China all at the same time.
Rolling 1 Year Beta to a Weaker U.S. Dollar
Gold: 3.55
Oil: 2.86
MSCI Emerging Markets: 2.45
Copper: 2.15
Swiss Franc: 1.94
MSCI Asia (ex-Japan): 1.85
Euro: 1.45
Yen: 1.20
EM FX: 0.75
MSCI World: 0.45
Topix: -0.12
S&P 500: -0.27
*Bear Traps Report data looking back to 2000. These are your weak dollar winners. In a period of headwinds for the greenback, it’s interesting to note how poorly U.S. equities perform relative to emerging markets, oil and gold.
China Yuan Currency Volatility
 Today, economic demand struggles are bottoming globally, and the Yuan (China currency) is beginning to strengthen. One of our favorite global economic indicators is found in 3-month China yuan volatility. As a currency is strengthening volatility plunges, while a weaker currency is often met with a surge in forex volatility. Looking back over the last 5 years you can see – above- the powerful impact on global equities. There’s an inverse relationship between equity prices globally and China forex vol. BUT, but , but; above all, the last time China currency volatility was this low, global equities were a lot higher – see the grey circle above.
EM’s External Drivers
Emerging markets rely on two key external factors. First, the global economic cycle, which China’s $13T economy is the biggest driver. Second, the financial cycle, which the Fed is the biggest driver. In Q3 2018, those two key external variables were headwinds, now they are tailwinds. There’s an opportunity here, indeed.
Autos Show Sunshine
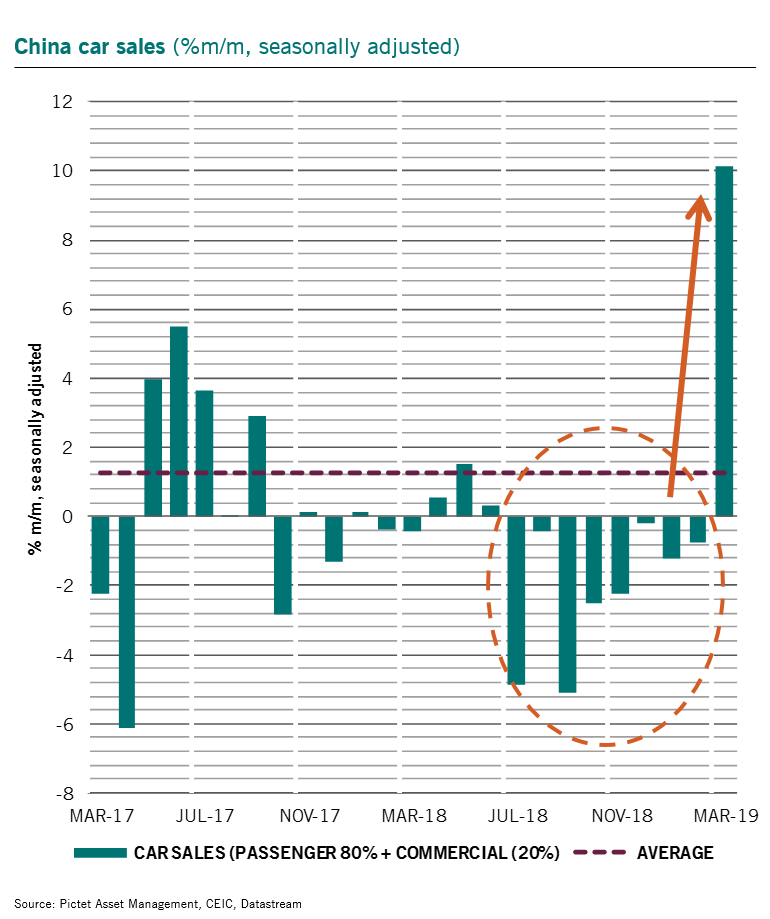 China’s easier economic policies transmission to consumption has not convinced so far. March jump in car sales may be the 1st sign of this happening. Car sales rose more than 10% over the month (strongest since April 2009), reversing the y/y trend growth from 22-year lows. Special thanks to our friend Patrick Zweifel and Pictet Asset Management for this observation.
Don’t miss our next trade idea. Get on the Bear Traps Report Today, click here
Back in the USA: Leadership, Stock Buybacks or Capex?
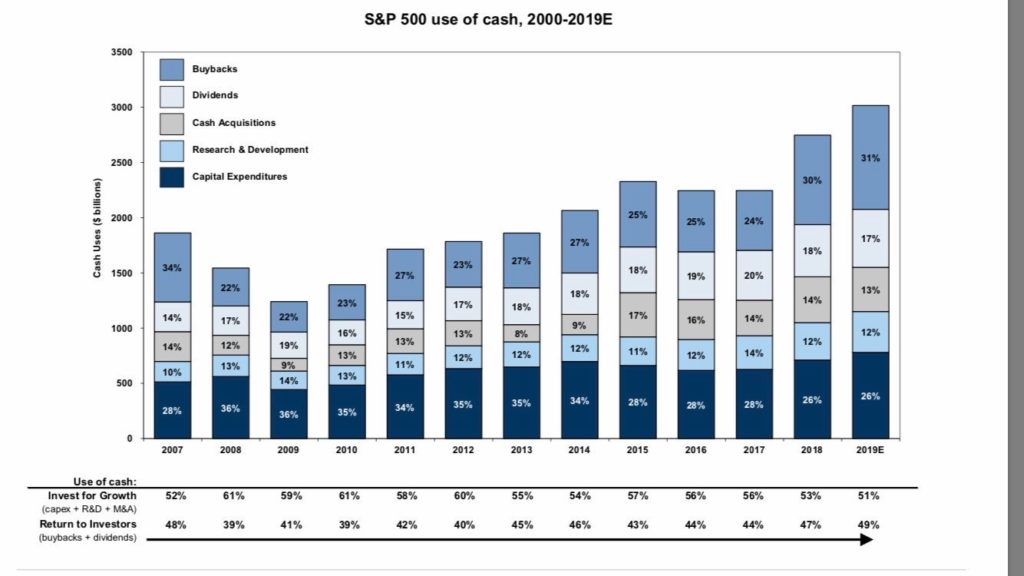
S&P 500 share repurchases surged 50% to an all-time high of over $800 billion in 2018, generating public debate about the use of corporate cash in Washington, DC and beyond. How US companies use cash, the motivations of executives buying back stock, and the effects of these buybacks on workers, companies, the economy, and political implications are what investors should be focused on.
“When a corporation uses profits for stock buyback it’s deciding that returning capital to shareholders is better for business than investing in their products or workers. Tax code encourages this. No surprise we have work life that is unstable & low paying.”
Senator Marco Rubio
Eye Opener: Goldman’s Look inside Buybacks and Capex
To start, William Lazonick, professor at the University of Massachusetts lays out several concerns about buybacks driving the public debate. At their core is the notion that returning cash to shareholders comes at the expense of investment. This, in turn, harms innovation as well as American workers, who, Lazonick argues, should be getting a much larger share of company profits than shareholders. He also believes that paying executives with stock distorts their incentives, motivating them to boost share prices, no matter the cost to employees, their companies’ future growth, or the economy writ large—especially as the US increasingly loses out to more innovative competitors. What’s the fix, in his view?
Ban buybacks, stop paying executives with stock and give employees their due—all of which will only be truly meaningful in a world in which the “maximizing shareholder value” ideology no longer prevails.
Capex Soaring through all the Stock Buyback Noise
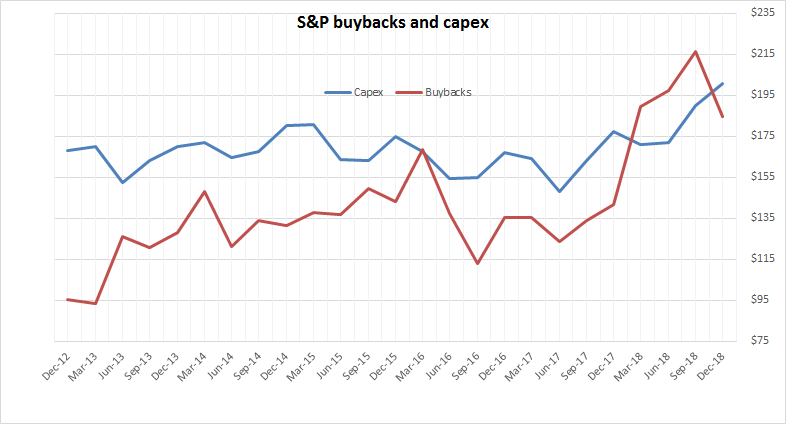 Our Bear Traps Report team developed this thesis in early January – see our chart above. We’re pleased to say, NOW Goldman is backing up our work. It’s very disturbing that the main street media continues to spin a narrative which is completely false. When looking at the numbers, Goldman’s US portfolio strategists David Kostin and Cole Hunter find many of these arguments (Buybacks > Capex) don’t hold up in reality! In particular, they emphasize that even as companies return a large amount of cash to shareholders, there is sizable reinvestment; in fact, growth investment at S&P 500 companies has accounted for a larger share of cash spending than shareholder return every year since at least 1990, with the largest share repurchasers far outpacing market averages in the growth of R&D and capex spending. They also find those executives who stand to gain the most from buybacks— those whose compensation depends directly on EPS—did not allocate a greater proportion of total cash spending to buybacks in 2018 than executives whose pay was not linked to EPS.
Corporate Use of Cash
 Aswath Damadoran, professor at New York University Stern School of Business, agrees that buybacks aren’t coming at the expense of investment. Rather, he argues that large, mature companies returning cash to shareholders allow that cash to be put to more productive uses; so it’s not that companies are investing less, it’s those different companies—with better growth opportunities—are investing instead.
The Walking Dead
There are colossal political implications for companies in here, Goldman does a solid job shedding light on a topic draped in fog. As for workers, Damodaran worries that constraining companies’ ability to return cash to shareholders would lead US companies to make bad investments, further damaging their competitiveness and creating more “walking dead companies” similar to what we see in Europe. This, he fears, could backfire on workers, as firms are ultimately forced to pay less, hire less, or reduce their workforce altogether. In the end, he believes banning buybacks would ironically most likely benefit corporate executives (who would now have the luxury of sitting on cash) and bankers (who will reap the gains if executives instead pursue acquisitions), while hurting workers. Steven Davis, professor at The University of Chicago Booth School of Business, then dives into the potential implications of banning buybacks for business formation, job creation and the broader economy. He explains that such a ban will likely lead to an inefficient allocation of resources, which will ultimately shrink the overall size of the economic “pie”. And since he finds that younger and smaller businesses are an important source of jobs in the economy—particularly for workers at the lower end of the earnings distribution—he’s concerned that trapping cash in older, larger companies will reinforce an unequal distribution of the pie, aka: income inequality. In his view, the best bet to increase the size of the pie and even out its distribution is to foster a favorable environment for starting and growing businesses. That would entail simplifying the tax code, reducing labor market restrictions and regulations, and revamping local and federal regulations in other areas that create a complex and costly business environment today.
Political Implications are Profound, Beware
We believe the unintended consequences of stock buyback legislation coming out of Washington will have COLOSSAL U.S. equity market implications – could very well contribute to a crash. In our view, the S&P 500 would have a 2500 address NOT 2900 without buybacks. Per our friend Chris Cole at Artemis Capital, over $5T has been plowed into stock buybacks over the last decade. We add, over $8T of Federal Reserve – easy money – induced corporate bond sales financed this orgy. Thank you, Bernanke, Yellen and Powell – this mess went down on your watch.
Per Vox, “Florida Senator Marco Rubio is looking at one of the Republican tax bill’s worst optical problems, corporations spending their big tax cut on inflating the price of their stocks instead of hiring workers or building new factories. US companies spent a record $1 trillion on stock buybacks in 2018.” (Media spinning a false narrative again, upselling you buybacks over capital expenditures).
Rubio’s proposal is, in essence, to tax stock buybacks more aggressively while extending a provision in the tax bill that allows companies to immediately and fully deduct the cost of new investments, thereby making it more attractive for companies to make those investments.
Rubio is framing his proposal as a necessary step for the United States to compete with China, in his view the country’s greatest geopolitical threat, but implicit in its design is a recognition the GOP bill didn’t have the desired effect on business behavior.
Experts say Rubio’s heart may be in the right place. “There’s good reason to believe companies underinvest,” said Alan Cole, a former Republican tax policy adviser now at the Wharton School. Special thanks to Vox for the Rubio coverage here.

 Capital One COF was a standout this week, we noticed significant divergence to the upside relative to regional bank equities. A short squeeze was in play in our view, short interest in COF shares rose to nearly 6m shares in Q1, up from 3m shares short in September 2018. Strong earnings results were the driver of the squeeze, the company also put forth initiatives to boost margins as it lays out a path to become more efficient. It’s important to note, few stocks actually lost too much ground in Financials as the sector was firm this week but trust bank State Street STT was the worst performer. Organic growth at Trust Banks is facing a number of headwinds.
 The driving theme for the week across asset classes may have been the increasing emergence of relative value trades even as the S&P 500 Index climbed to a new all-time high. To be sure, being ‘long & strong’ has paid off for US stock investors again in April — the S&P 500 is up over 3.5% for the month. But April has also brought even greater returns from relative trades such as long Tech/short Healthcare or long the dollar vs. the euro over the past week.
 Stocks are partying like it’s 1999, while junk bonds are showing signs of cracking. We’re looking down the barrel of a high pace of credit rating downgrades. Per S&P Ratings this year, the ratio of downgrades to upgrades is the worst since 2016’s energy price collapse, back then oil was $26 vs. $64 today. We’re seeing a sharp breakdown, a meaningful underperformance of poorer quality credits. Credit deterioration is picking up even with CCC high yield index up +10.1% YTD, Q4 loss was near -10%. If you look at the frequency of bonds in a -20% or more hole (substantial sell-off in price), in 2019 we’re at double the pace of 2017 in terms of blow-ups in the CCC corporate bond space.
 Tesla stock price is on the bottom end of a sustained trend channel, as investor’s optimism slowly dwindles. However, “proposed” legislation could be the boost the equity needs to bounce off nearby support – as long as it moves quickly trhough Congress.
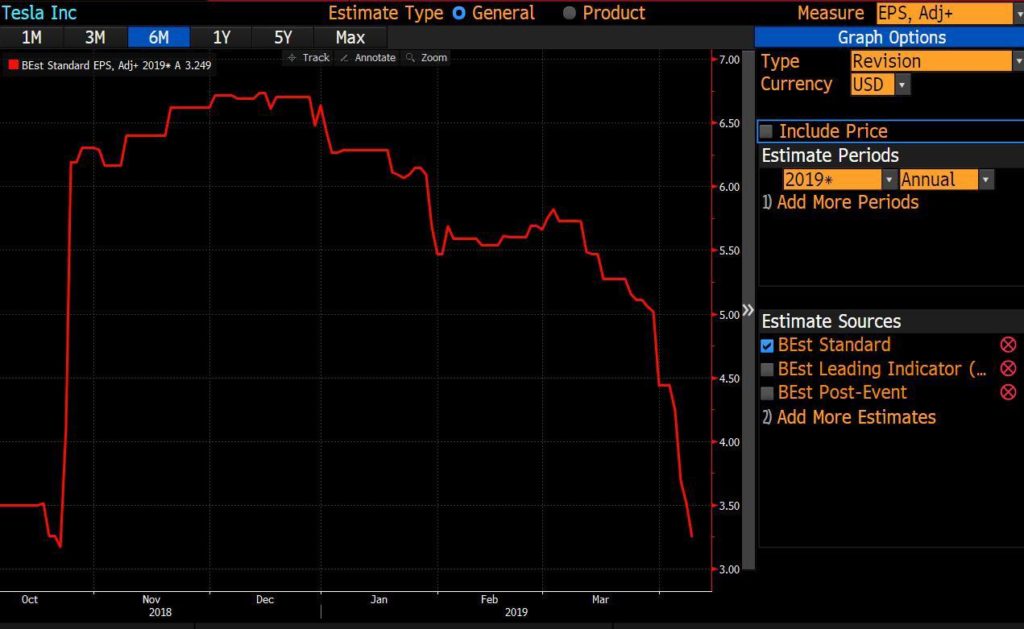 This year’s earnings expectations for Tesla have crashed down from their fantasy levels. At the beginning of the year EPS expectations were over $6.00 for the year, now they have fallen over 40% to near $3.25. Expectations slid due to increased competition in Europe and the company not hitting bullish delivery estimates – the loss of tax credit did not help their bottom line.
  In October of 2018, Tesla reported another rare profit. After 8 quarters of mounting losses, shorts were once again caught on the wrong foot (as you can see above – red circle). Why the sudden turnaround? Unlike almost any other mass car producer, Tesla delivers from their order book. With Model 3 production (finally) at adequate levels, Tesla first started delivering the top range Model 3s, which often go for ~$55K vs a $35K base price. To exemplify, Tesla makes an estimated $3,500 operating profit on the $45K version while it loses some $3,900 on the base Model 3. This is how Tesla showed a rare profit in Q3. Keep in mind, Tesla didn’t just turn profitable, it also showed positive cash flow – or more pain for shorts. This was mainly due to reversals in working capital and tax credits. All this came as huge surprise to the market and the stock ripped higher, as short sellers once again rushed to cover. We MUST look at the Tesla credit (5.3s due 2025). In late October / early November as the stock soared, Tesla’s junk bonds were NOT buying the price action in the equity and lost 4 points (early November to late December)! Sure enough, a few weeks later the stock caught up with the bonds on the downside.
