Join our Larry McDonald on CNBC’s Trading Nation, this Wednesday at 2:20pm
Blog Updated, March 27, 2017 at 6:40am ET
“…modern academics and economists have a crucial blind spot; they tend to ignore how the financial system really works.”
HS Shin, Bank of International Settlements, March 2017
This week, our friend Gillian Tett of the Financial Times dug into something close to our heart. Economists and academics are far too focused on their craft, while financial (risk management) awareness is a dangerous deficiency. What good is a central bank’s “duel mandate” if they ignore credit risk which has been proven to be the global economy’s Achilles heel? Navigating their “blind spot” will be the holy grail of asset management over the next few years.
Crowded Trades
We advised clients to get long U.S. Treasuries and Gold Miners heading into this week’s all important Fed meeting. In recent years, so much comes down to meticulously measuring just where exactly is the most crowded trade heading into Janet Yellen’s gathering. There are too many market participants trying to generate alpha around the FOMC, often there’s a very large collection of patrons on one side of the boat. As we advised clients, “toooooo many players have been short U.S. Treasuries in recent weeks”, when there’s nobody left to sell something, prices usually rise. Everyone was waiting for Janet (Yellen, the Fed Chair) to turn into a hawk*, when she didn’t deliver they all ran to cover their bond shorts at once.
*Hawks at the Fed want to hike rates, pop asset bubbles, but they’re NOT driving the bus.
Pick up our New York Times bestseller here:
Pick up our latest report here:
Don’t miss our next trade idea. Get on the Bear Traps Report Today, click hereFed Rate Hikes Leading to Easier Financial Conditions?
 This week, the Federal Reserve raised interest rates for the second time since December, the third time since late 2015. The primary reason central banks hike rates is to “tighten” financial conditions (let some air out of the balloon), but they actually eased this week, equivalent to one full cut in Fed Funds rate. In December, the U.S. 30 Year Bond yield was 3.17%, after two rate hikes since the U.S. election, she’s 3.10%. Likewise, in the United States the average thirty year mortgage yield was 4.20% in December, 4.09% today. The punch bowl is alive and well, asset bubbles keep inflating. We have NOT learned the Lesson’s of Lehman Brothers, it’s sad.
Bottom line: Sure, the Fed raised interest rates, but in the most dovish possible way. They used forward guidance and more than tame rate hike forecasts to keep filling up the punch bowl. We’re sorry, they’re smoking in the dynamite shed.
Financial Lending Conditions Have Eased, NOT Tightened
Before and After Two Fed Rate Hikes
Mortgage Rates: 4.20% v 4.09%
30 Year Treasury: 3.20% v 3.10%
Gold: $1128 v $1229
Dollar: 103.3 v 100.3
Junk Bond Yields: 6.25% v 5.75%
Bloomberg data, March 18, 2017
Why was the Fed So Dovish?
President of the Minneapolis Fed, Neel Kashkari and the doves on the FOMC board are clearly more concerned with their duel mandate (unemployment and inflation targeting) than asset bubbles. One would think that eight years after the worst financial crisis in nearly one hundred years, Congress and Fed governors would express more concern with credit risk’s potential negative impact on the U.S. economy. The balance sheet of the Federal Reserve is levered 80-1, what number is absurd, irresponsible? 100-1, 200-1?
“I dissented (did NOT vote to raise interest rates) because the key data I look at to assess how close we are to meeting our dual mandate goals haven’t changed much at all since our prior meeting. We are still coming up short on our inflation target, and the job market continues to strengthen, suggesting that slack remains…
…Core PCE did increase 0.3 percent in January on a monthly basis, but on a 12-month basis, my preferred measure, it has ticked up only ever so slightly, from 1.71 percent to 1.74 percent. My assessment of core inflation from the prior meeting is essentially unchanged.”
Neel Kashkari, President of the Minneapolis Fed, March 16, 2017
We love Neel, he means well and is laser focused on the Fed’s duel mandate, but he and the doves are smoking in the dynamite shed. From 2004-7, the Fed focused on their duel mandate and ignored credit risk, why do it again?
Bernanke’s “Blind Spot” Cost Us All Dearly
“Subprime mortgage risks are contained.” February 2007
“Fannie and Freddie are adequately capitalized. They are in no danger of failing.” July 2008
“Once I fully understood how irresponsible AIG executives had been, I seethed.” September 2009
Fed Chair Ben Bernanke. Far too little to late Ben
Let us look at three ugly excesses they’re not taking seriously today.
Pick up our latest report here:
Don’t miss our next trade idea. Get on the Bear Traps Report Today, click here1. Consumer Credit Deterioration and Subprime Auto Loan Defaults touch highest level since Financial Crisis
U.S. subprime auto lenders are losing money on car loans at the highest rate since the aftermath of the 2008 financial crisis as more borrowers fall behind on payments, according to S&P Global Ratings. Losses for the loans, annualized, were 9.1% in January from 8.5% in December and 7.9% in the first month of last year, S&P data released March 10, 2017.
Motor Vehicle Loans Owned & Securitized
 So, lets get this straight. We have an economy near full employment in what every economist on Wall St. calls a strong jobs market, with surging auto loan defaults? This is moral hazard gone bad, the Fed has kept interest rates so low for so long – the net result? We have an ugly, smelly pile of bad loans on our hands. In 2006, clueless economists lectured us “we cannot have a surge in home mortgage defaults with the labor market as strong as it is.” That was their “blind spot.” Trying to manage risk while looking at stale, traditional economic metrics, it’s pathetic.
Supply of Automobiles at 30 Year High, Outside 2008-9 Recession
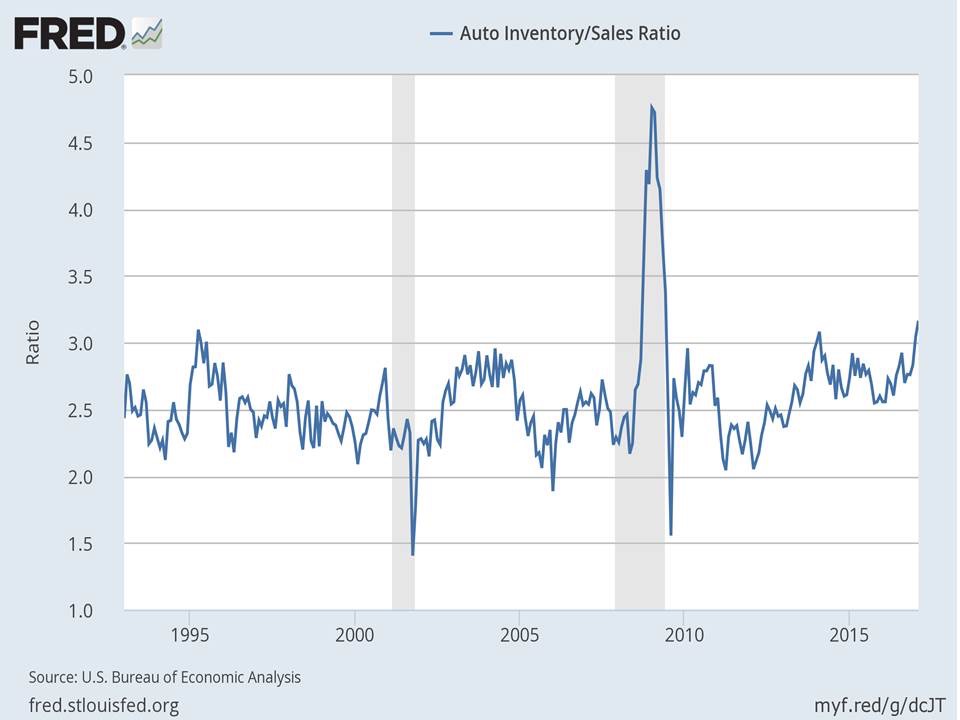
This is an eye opener, record supply level vs sales. It speaks to credit market saturation, sellers simply cannot find more “qualified” buyers. They’re reaching deeper into the risk spectrum.
The Great Enabler that is the Federal Reserve
As central banks suppress the natural level of the cost of capital, a moral hazard oozes through capital markets. The bottom line, money ends up in places it just shouldn’t be as investors reach and reach and reach for yield. Interest rates should be used to price risk, today the risk-pricing mechanism hasn’t simply collapsed, it’s toxic.
Ally Pain, Ally Financial Inc.
“As you’ve heard from many lenders, we’re closely watching the environment, and we’ve seen some more noticeable shifts recently…
Consumer losses have also been drifting higher, and most notably in lower credit tiers. You’ve heard back from others as well. We have seen some additional deterioration in the first quarter, and we believe that the delayed tax refunds may have had an impact here.”
Jeffery Brown, Ally Financial CEO, March 21, 2017
U.S. Credit Card Delinquencies
2016: +9%
2015: -9%
2014: -15%
2013: -21%
2012: -30%
2011: -38%
2010: -11%
2009: +38%
2008: +30%
2007: +6%
Four quarter, rolling % change
Thomson Reuters Data
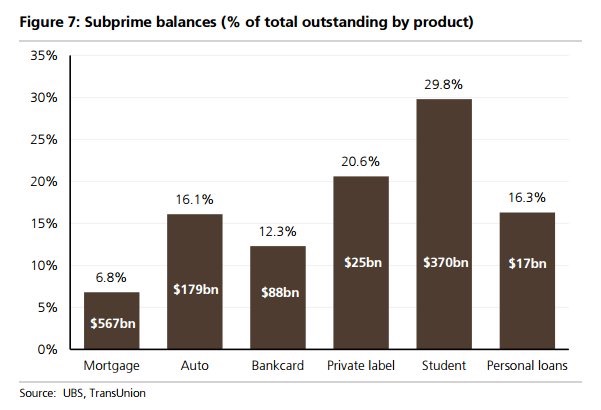 We’ve come full circle since “A Colossal Failure of Common Sense” (our 2009-10 global best selling book, now published in 12 languages). Over the last 100 years, after each financial crisis there’s a spectacular metamorphosis. There’s a transformation into another serpent, another beast and it’s powerfully depicted above. The mortgage market has “found religion,” only 6.8% of financing for new homes is subprime. Flowing down hill (thanks to Central Banks – Ben and Janet), the water has simply found its way to another location. Nearly nine years after Lehman’s failure, we’re seeing a substantial increase in risky lending in places like student loans, credit card and auto loans.
Q4 Data, U.S. Credit Card Charge-off Quarterly
2016: $8.5B
2015: $6.6B
2014: $6.5B
2013: $6.9B
2012: $7.8B
Fitch, Fed data
Once again, credit card delinquencies should NOT be going up with the economy at full employment. Any first year economist out of college can tell you that, BUT they are. At some point when the Fed’s easy money policy reaches the saturation level in the economy, even with a decent jobs market, credit quality deteriorates. This is clearly happening now in our view.
Defaults on Student Loans
2016: 4.2m
2015: 3.6m
2014: 2.9m
Roughly 1.1. million borrowers entered default on their Direct Loans, a type of federal student loan, last year, about the same as the previous year, according to an analysis of publicly available government student loan data by Rohit Chopra, a senior fellow at the Consumer Federal of America, a network of more than 250 nonprofit consumer groups. Overall, there were 4.2 million borrowers in default in 2016, up 17% from 3.6 million the year before, as some borrowers exited default while others remained in the red. – Marketwatch data
Non-Housing U.S. Consumer Debt Load*
2017: $3.8T
2007: $2.5T
*Auto, credit card, student loans, other
NY Fed, Equifax Data
From Our Friend Chris Whalen
An early voice heading into the 2008 credit crisis, Chris Whalen is a man to listen to. He’s one of the best bank credit analysts from Wall St. We recap a section of his blog “Citigroup: Canary in the Coal Mine” below.
Credit Divergence: Citi vs JP Morgan
“Even today, the relatively elevated credit profile of Citi’s customer base is reflected in a gross loan charge-off profile that at 126bp at the end of 2016 is more than a standard deviation higher than the average for the large bank peer group. Loss given default (LGD) for Citi is almost 80%, again far higher than large cap asset peers like JPMorgan (NYSE:JPM) and Bank of America (NYSE:BAC). Indeed, Citi in credit terms is really more comparable to below-prime lenders such as CapitalOne (NYSE:COF) and HSBC (NYSE:HSBC). The 126bp of default reported by Citi in 2016 maps out to roughly a “BB” credit profile for its portfolio, again reflecting a deliberate business model choice that has selected a below-prime business as the bank’s model. COF, by comparison, reported 265bp of gross defaults at year-end 2016, roughly a “B” credit profile. COF’s loan loss rate is more than three standard deviations above the large bank peer group with an LGD of 77%, according to the TBS Bank Monitor. Of note, COF showed a risk-adjusted return on capital of just 1.6% at year end ‘16 while Citi reported a RAROC of 3.8%. Since the nominal cost of capital for most large banks is well into double digits, you may be wondering why these banks are still here. Indeed, most large banks don’t earn their cost of capital, either in nominal or risk adjusted terms. But it is only when you look at these banks based on RAROC that you understand that the big zombie banks are perennial value destroyers. Smaller regional and community banks, by comparison, routinely earn double digit real, risk-adjusted returns on capital.”
From our friend Chris Whalen
Back to Auto Loans, Prime Starting to Creep Higher
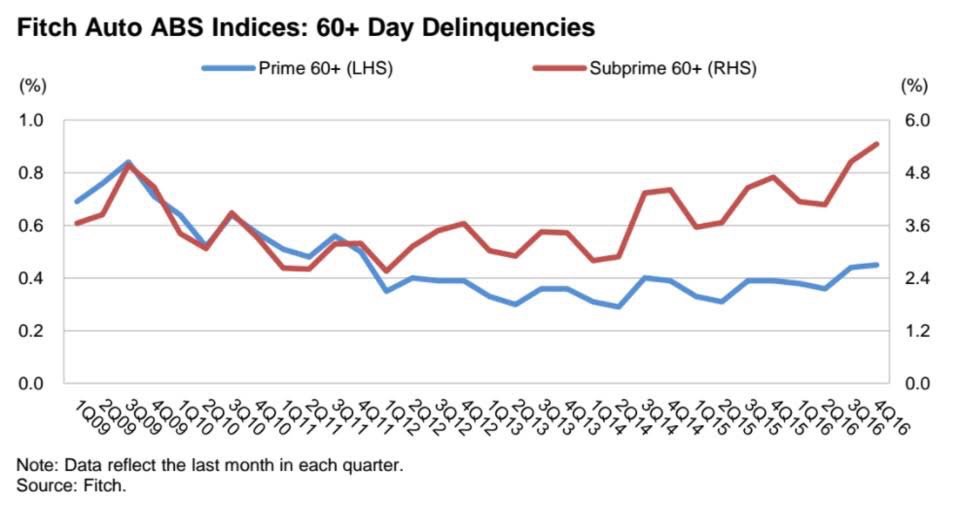
The final stage of credit deterioration’s saturation point is found in the shift over to “prime” or high quality borrowers.
Pick up our latest report here:
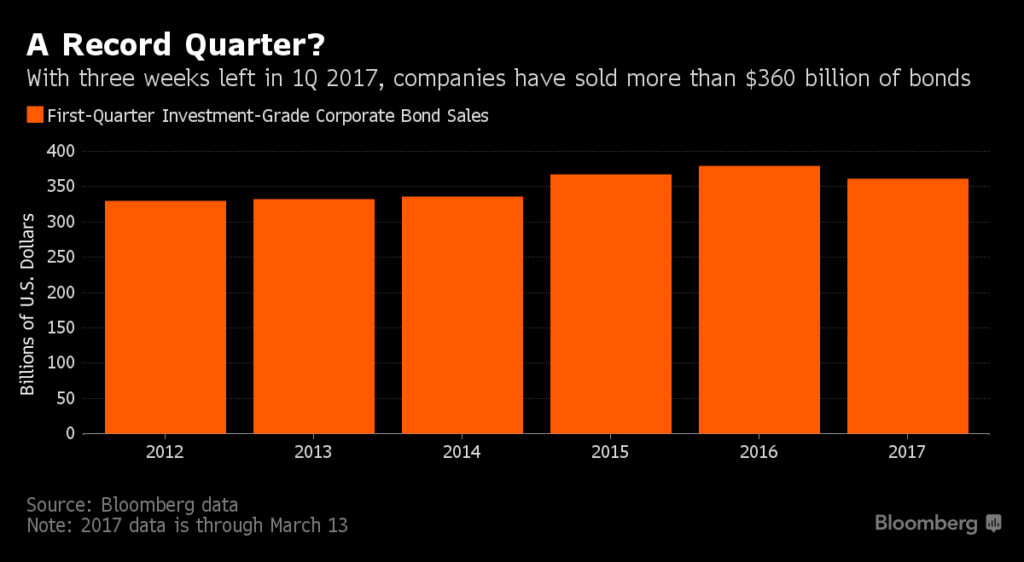
Don’t miss our next trade idea. Get on the Bear Traps Report Today, click here2. Moody’s: North American Junk Bond Covenant Quality, on the Lows
U.S. Corporate Debt Outstanding*
2017 Post-QE, ZIRP: $7.1T
2008 Pre-QE, ZIRP: $3.3T*High Yield, Distressed and Investment grade debt outstanding in the United States, Bloomberg data. The Fed’s easy money gravy train is funding a toxic cesspool of leverage, much of which cannot be repaid. QE = Quantitative Easing. ZIRP = Zero Interest Rate Policy (both courtesy of the Federal Reserve).
One of our 21 Lehman Systemic Risk Indicators is found in junk bond covenant quality. As we wrote in our New York Times bestseller, froth in the credit markets is the ultimate signal of a coming risk off. We measure froth by covenant quality analysis. Let us explain.
When the Fed keeps interest rates too low for to long, investors begin to cheat and reach for yield. The distant pain of the credit crisis is almost forgotten. Like a bad relationship in years past, after the healing it’s time to love again.
“Over $240B of leveraged loans and high yield bonds are rated CCC or below, that’s an all time high.”
BofA / Merrill
The same is true bond covenants, the weaker the terms the more power CFOs (issuers / companies) have over investors. By our measure, they’ve (companies selling debt) NEVER had more power than today. Covenant quality is atrocious, near insanity levels.
Junk Bonds vs. One Year Libor* (yield spread)
2017: 302bps
2016: 405bps
2015: 622bps
*One year loans between large banks vs high yield bonds. Hint, hint; junk bonds should NOT be yielding just 3% more than secured bank loans between large financial institutions.
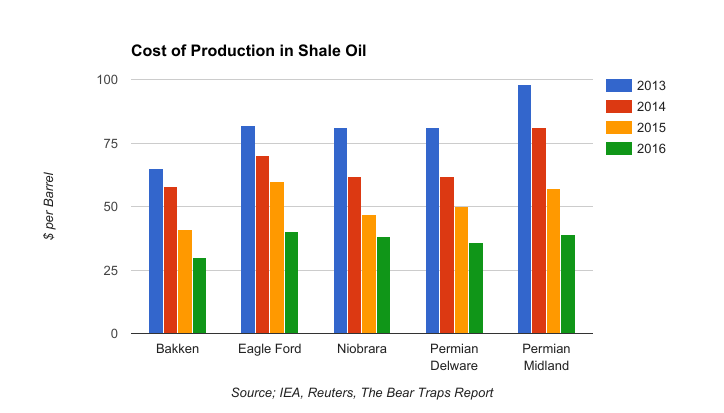
Thanks to the Q1 plunge in oil prices, the number of defaulting U. S. issuers in the corporate bond market reached 142 in 2016, the highest since 2009, per Moody’s. Oil is a key default bellwether in 2017, we must keep an eye focused here.
“In March 2017, U.S. high-yield debt investors have moved underweight the bonds for the first time since December 2008.”
Bofa / Merrill
Merrill High Yield Bond Spread OAS
2017: 335
2016: 610
2015: 518
2014: 420
2013: 475
2012: 520
Reuters
Bloomberg Barclays High Yield Index
Bloomberg data. Each year, from 2012-2016 high yield bond credit spreads have made a move higher, north of 400bps. This year junk bond spreads have been range bound. This suggests a highly unsustainable level, one which will be tested in the months to come.
U.S. Corporate Bonds vs their Long Term Average Yield
Junk: 5.7% v 9.2%
Investment Grade: 3.0% v 5.4%
Bloomberg, Reuters
Pick up our latest report here:
Don’t miss our next trade idea. Get on the Bear Traps Report Today, click here3. Commercial Real Estate – CMBS Pain a Cometh
By the end of this year, over $200 billion in CMBS commercial mortgage-backed security loans are coming due, nearly 35% are backed by retail properties. Roughly $20B billion of retail loans in CMBS are coming to Papa in 2017, and another $33B next year.
Commercial Mortgage Backed Securities, Yields Heading North
S&P predicts 13% loan defaults on CMBS loans maturing in 2017, that’s up from 8% in 2015 and 2016. As corporate bond yields are on multi year lows, CMBS yields have been heading north over the last year in a stunning divergence. This space is now saturated with bad loans with U.S. retail leading the way.
It’s the same old story here. Without the natural forces of the business cycle (you know, the one being suppressed by the Federal Reserve), the net result is ridiculously elevated loan-to-value ratios in CMBS, loans that NEVER should have been made. Without the cleansing process of the business cycle, there’s no purification. Toxic debts keep piling up. Like a year with no seasons, we’re faced with a one way train to ultimate unsustainability.
This Mess is Coming to a Head this Year:
“The US market is oversaturated with retail space, and far too much of that space is occupied by stores selling apparel. Retail square feet per capita in the United States is more than six times that of Europe or Japan. And this doesn’t count digital commerce. Our industry, not unlike the housing industry, saw too much square footage capacity added in the 1990s and early 2000s. Thousands of new doors opened and rents soared. This created a bubble, and like housing, that bubble has now burst. We are seeing the results, doors shuttering and rents retreating. This trend will continue for the foreseeable future, and may even accelerate”
Urban Outfitters CEO Richard Hayne, March 8, 2017
How do you spell disruption? In the U.S., there’s over 18 billion square feet of retail real estate and 92 billion square feet of total commercial real estate. That’s 56 square feet of retail space per person, per CoStar data.
Retail Square Footage per Capita
USA: 56
Europe: 10
Japan: 9
CoStar data
Shorts Building
Some hedge funds are moving in for the kill. Short positions we track on two of the riskiest sections of CMBS surged to $6B last month, that’s over a 50% surge from a year ago.
We focus on junk, the price action of BBB- tranches of CMBS:
March: 86.8
February: 92.2
January: 97.1
Markit, Bloomberg data
Nearly 30% of Fitch-rated CMBS loans maturing this year are wearing HIGH default risk, the rating agency noted this month. Fitch views maturing 10-year CMBS loans as facing “continued pressure.” The firm says expects “significant delinquencies” in those loans, citing high leverage levels. In just one example next to many, J.C. Penney announced it would close over 140 stores and two distribution centers last month amid plunging sales and lower-than-expected earnings. Sure, digital technology is in disruption mode here (Amazon’s role is an old story), but the easy lending standards funded by the Federal Reserve have created a colossal distortion, gross excess supply.
Join us here:
Don’t miss our next trade idea. Get on the Bear Traps Report Today, click hereU.S. Treasuries Surge on the Fed’s Rate Hike
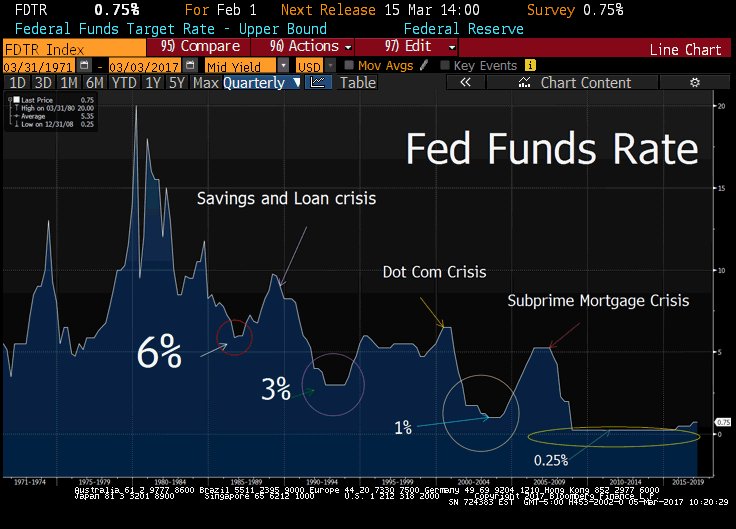
Only the 3rd Increase in the Fed Funds Rate Since June 2006
 The Fed “dots” express the governors’ future interest rate outlook going forward. If you look at the doves – the FOMC participants most eager to keep rates lower for longer – they DID NOT adjust their dots higher. In other words, the doves stood their ground – voted to keep the easy money gravy train rolling. The FOMC participants who projected three hikes or less for 2017 back in December didn’t budge in March. The Street expected at least one or two in this bunch to move higher (to four hikes), complacency sent bond prices soaring (above).
“In December, half of FOMC participants started to factor in fiscal policy economic growth conditions into their 2017 and 2018 outlook. With the Obamacare Repeal and Replacement legislation of life support, the stalled growth engines in Washington are piling up. The execution bar has rarely been higher for D.C. politicians to come together and pass their much heralded agenda. To us, the probability of caution coming out of the FOMC is surging. We think they walk back their fiscal policy assumptions for 2017-18. Bottom line: heading into the meeting we are long duration – U.S. Treasury bulls through the TLT ETF and long gold miners through the GDX ETF. ”
The Bear Traps Report, Morning Note of March 15, 2017
Bonds Love a Dovish Janet
iShares 20+ Year Treasury Bond ETF
Bonds and risk reacted very positively this week, there were fears the Fed’s median dot would go to 4 based off their recent rhetoric. Instead they remained committed to their December outlook, a view we expressed our morning note BEFORE the Fed decision. From our perspective, you can’t change a leopard’s spots, the Fed is led by a progressive, labor market economist in Janet Yellen. As much as Wall St. thinks and wants her to more aggressively raise rates, each time in recent years the Fed keeps filling up the punch bowl. They’re choosing their “duel mandate” over prudent risk management, a 2006-8 replay all over again.*
*Lets be clear, large U.S. banks are far less leveraged today than in 2006-8. On the other hand, each financial crisis going back over the last 100 years has evolved into a different serpent, a beast in yet another form. Sure, the banks are less leveraged, but the risks have simply moved to another part of the room.
Don’t miss our next trade idea. Get on the Bear Traps Report Today, click hereWhat Happened?
1. Dots: The Fed’s outlook was in line with our estimates, they left the near term median dots at 3 hikes for this year. Bond bears were looking for a shift to four (we explain above, under the chart).
Age 25-54, Employment to Population Ratio
Secular Forces Supportive of Bonds
2010s: 78-79%
2000s: 80-81%
1990s: 82-83%
Neel Kashkari, Minneapolis Fed, BLS data
Doves like Fed governor Neel Kashkari point to “labor force slack” as a reason for their reluctance to raise interest rates. Millions of young people are NOT in the labor force who were in previous decades of far more robust U.S. economic growth. These structural, secular forces have been a strong tail wind behind the long bull market in bonds.
2. SEP – Staff Economic Projections: Changes to economic forecast were very minor from their December meeting, this was our view. Some on the Street were looking for an uptick in the Fed’s near term inflation projections. The firm / specific statement that their inflation target is symmetric took the street by surprise. Too many market participants were bought into inflation fears. The Fed statement was modified to say that the committee looks for “sustained” return to 2% inflation. In other words, no concern of an overshoot.
University of Michigan Inflation Expectations
 Friday’s (March 17, 2017) very soft University of Michigan 5-10 year inflation expectations gave long term bonds a bid. Number came in at 2.2% for March vs 2.5% from February. It’s now at the lowest level since the recording began.
3. Balance Sheet: In their policy statement, the Fed left the balance sheet section unchanged. The Street has been talking up a more substantial reference to future balance reduction. The market was somewhat fearful there would be a stronger balance sheet reference at this meeting.
4. Press Conference: Another element that weighed positively on bonds was that Yellen in her press conference struck a tone more similar to her roots than one in recent speeches. In Wednesday’s press conference Yellen reiterated that the Fed is data dependent as there are still many indicators that show that modest accommodation is still necessary. Yellen’s presser made sure the massive shorts across the treasury curve had no respite. Meaning her lack of hawkish follow through to recent Fedspeak sent the shorts running for cover. The Fed is keeping some hawkish powder dry.
5. Gridlock in Washington: We believe growing dysfunction in Washington is weighing on the FOMC. The White House’s growth agenda is way behind schedule in the time line. In other words, moving on Obamacare Repeal and Replace BEFORE tax reform and infrastructure has the Fed very concerned behind the scenes.
“…financial markets are guessing about what fiscal and regulatory actions the new Congress and the Trump Administration will enact. We don’t know what those will be, so I don’t think we should put too much weight on these recent market moves yet.”
Neel Kashkari, President of the Minneapolis Fed, March 16, 2017
6. The Dollar: There are creeping hints in the marketplace that the FOMC and the White House are trying to contain the U.S. dollar. In recent weeks, comments by U.S. Treasury Secretary and President Trump have suppressed Wall St’s near unanimous view that the dollar is heading higher in 2017.
The U.S. Dollar is 27% Since May 2014
 Thanks to an eight year, easy money gravy train from the Fed, dollar denominated debt outside the U.S. has surged to near $12T, from less than $6T ten years ago. U.S. dollar, non-bank credit to non-U.S. residents has exploded higher, thanks Ben and Janet. The Fed must contain the beast inside the market. The math is simple and terrifying. One trillion of dollar denominated debt globally becomes $1.2T owed after a 20% surge in the greenback. Coming out too hawkish in 2017 will re-awaken the serpent who visited us at the end of 2015 and 2016.
Goldman this Week
“Financial markets took the meeting as a large dovish surprise—the third-largest at an FOMC meeting since 2000 outside the financial crisis, based on the co-movement of different asset prices. Our FCI also eased sharply, by the equivalent of almost one full cut in the federal funds rate.”
Goldman Sachs, March 16, 2017
 A Perfect Storm for Treasuries: Bonds have been hit by perfect storm since the 10 year hit 2.32% two weeks ago. Hawkish Fed speak that was culminated by Yellen last week, has repriced March as meeting they will hike in. Asian data points, including China’s unexpected trade deficit number this week, also put pressure on bonds, as China’s imports are a large driver of global growth. Draghi and the ECB did not help proceedings with a more hawkish than usual Q&A session in his press conference. These data points have pressurized bonds in the near term.
 Despite U.S. production roaring back, the market is still record long oil contracts. With positioning so one sided in crude oil, it seems that the relative upside is capped. The market has a few catalysts which could drive prices higher as global demand is improving at a time when OPEC is actually cutting their output levels. This does present a positive backdrop for prices but the question is how sustainable is it. Can the Saudi’s continue to shoulder the majority of OPEC cuts with global demand picking up, watching Iraq’s production shift in the coming months will be telling. Iraq is one of the largest OPEC producers and also has constantly been hesitant about production cuts; if they give way, it would be a trickle down to Libya, Kuwait and other GCC (Gulf Coast Countries) members. This is part of the Saudi peg, but if there is a catalyst for this positioning to give way and push the curve out, oil could slide hard.