
Join our Larry McDonald on CNBC’s Trading Nation, Wednesday at 3:05pm ET
Pick up our latest report here:
Don’t miss our next trade idea. Get on the Bear Traps Report Today, click here
“The Federal Reserve is often the chaperone who has ordered the punch bowl removed just when the party was really warming up.”
William McChesney Martin, Fed Chairman from 1951 to 1970, special thanks to our associate Arthur Bass for this gem.
As U.S. unemployment crept lower in recent years, Federal Reserve Chair Janet Yellen stayed with the slow crawl of policy tightening. Which begs the question, did the Fed keep interest rates too low for to long?
Jobs at First Glance
Friday’s jobs report showed payrolls rising 222,000 in June, the biggest increase since February. At first glance it appears joblessness has fallen further, to 4.4% in June from 4.7% at the end of last year and 5% in December 2015. Average hourly earnings have risen at an average year-on-year pace of 2.6%, but lets look beneath the data to see what’s really going on.
 A picture says a thousand words – stubbornly low wage growth is being held back by an army of young people still sitting outside the labor force. Blaming the 2008 financial crisis for this dynamic is the biggest copout in modern economics. Just look at 2012-16 data, it’s clear this problem is structural NOT cyclical at this point.
Much of the media cheerleading during the Obama years covered up some UGLY data that’s still with us today and had a lot to do with the election of President Trump.
Far from intentional, but hopeful Media and Wall St. “Fed (central bank) cheerleading” has misled investors for years. Every January like clockwork – from 2012 – on we were promised a “great rotation” out of bonds and into stocks. Every year, the crowd has called for higher rates and bond yields – only to see them plummet again and again. Year after year, bonds were panned – but often times were the place to be.
Hope is not an investment strategy – only by digging into the hard facts can the truth be found in the bond market.
U.S. Bond vs. Stock Fund Flows
2009-2017
Bonds: +$825B
Stocks: -$43B
EPFR, S&P Global data, cumulative data
Central bankers globally have created the mother of all asset bubbles here. The reach for yield is unprecedented. Interest rates should be used to price risk, today the risk-pricing mechanism is broken, it’s toxic.
Pick up our latest report here:
Don’t miss our next trade idea. Get on the Bear Traps Report Today, click hereProductivity in Decline
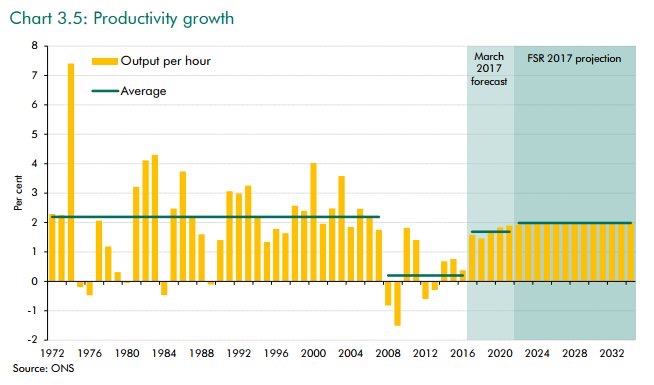
Labor productivity is a measure of economic results – a comparison of the amount of goods and services produced (output) with the number of labor hours used in producing those goods and services. It is defined mathematically as real output per labor hour. Growth occurs when output increases faster than labor hours – but we’ve seen very little of our long lost friend. Labor productivity growth can be estimated from the difference in growth rates between output and hours worked. During the 2012-2016 business cycle – labor productivity grew at a sad annualized rate of 1.1%*. This growth rate is notably lower* than the rates of the 10 completed business cycles since 1947—only a brief six-quarter cycle during the early 1980s posted a cyclical growth rate that low (also increasing 1.1%). That’s ugly indeed, but what’s driving this picture?
*U.S. Department of Labor, BLS data
Full Employment with Youth on Strike?
“Men ages 21 to 30 years old worked 12 percent fewer hours in 2015 than they did in 2000. Nearly 15 percent of young men worked zero weeks in 2015, a rate nearly double that of 2000.”
Young American Men Living at Home with Parents or Relatives
2017: 35%
2000: 12%
National Bureau of Economic Research study, July 2017
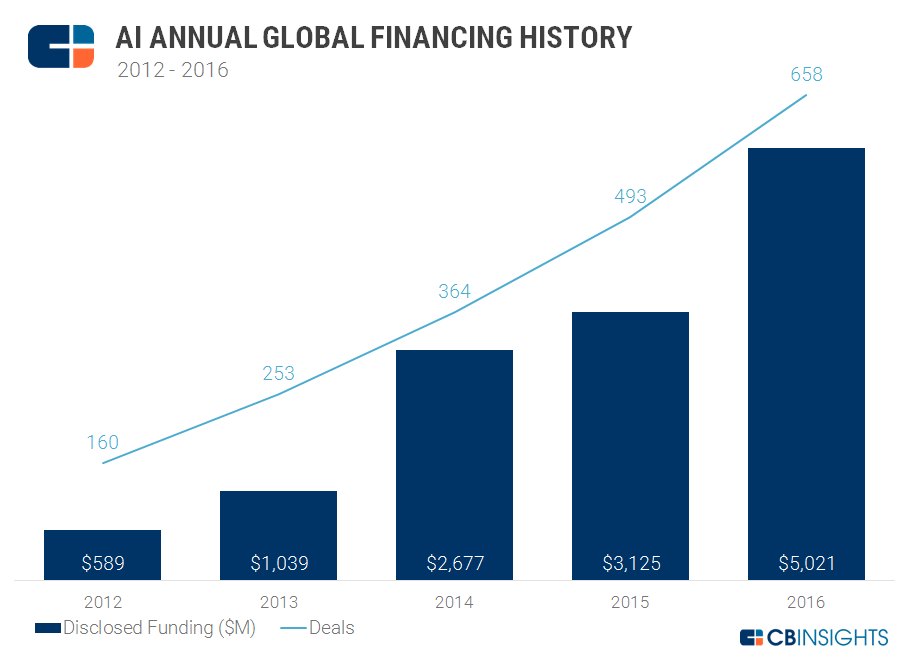
Artificial Intelligence AI’s Impact, the Side Effects of Easy Money
There’s a lot going on in labor market data – far more than who led the country at one time or another. We must ask a few questions? How much is AI artificial intelligence (robotics) at play here? By keeping interest rates so low for so long, has the Federal Reserve brought forward billions in venture capital dollars (funding the AI explosion) into a short period of time? Investments which would have come over 20 years have been accelerated forward in time – displacing millions of workers? How many jobs across the U.S. retail sector are robots eating each year?
Number of Amazon.com Robots across Fulfillment Centers
2020: 145k
2019: 101k
2018: 67k
2017: 45K
2016: 30K
2015: 20k
2014: 10k
2013: 5k
2012: 2k
Business Insider, Amazon data
Amazon and U.S. Jobs
Since October 2016, employment in the U.S. retail sector has plunged by nearly 160,000 jobs, that’s easonally adjusted, BLS data.
Pick up our latest report here:
Don’t miss our next trade idea. Get on the Bear Traps Report Today, click hereArtificial Intelligence, the AI Explosion, thanks Janet?
U.S. Full Time Employed
2017: 126M*
2007: 122M
1997: 104M
1987: 92M
*From 2007 to 2017 the U.S. population grew to 325M from 301M. Only 4m new full time jobs on a population 24m larger? Yes, as immigration makes up most of the population growth, there are far less full-time jobs to support the influx of people jumping over the border – even less to support middle class Americans. This helps explain secular stagnation and endlessly low bond yields – the U.S. has been in a productivity depression.
Productivity Depression
Total hours worked per employee plunged during the Obama recovery – especially 2013-15.
BLS, Bloomberg Data
Real Unemployment Rate is Far Higher than 4.37%
25-54 Year Olds: Labor Force Participation: 81.6%, is down 2% from 2007
If you do the math, there’s roughly 20 million relatively young people NOT in labor force, this speaks to the opioid tragedy and income inequality. The U.S. maintains 5% of the world’s population – but consumes 80% of the opioids produced on earth annually*. The media blames demographics, but that’s only part of the problem – these are fairly young (25 to 54 years old) displaced workers. There’s a reason why President Trump turned Michigan, Wisconsin and Pennsylvania red for the first time since the mid 1980’s – it has far more to do with the above data than Russians.
The Opioid Tragedy
Opioid abuse kills more than 100 Americans per day. There are as many opioid prescriptions written annually in the United States as there are adults. Over 97m Americans used prescription pain relievers in 2015 – while over 12m persons misused** their prescriptions.
*Angus Deaton, “Economic Aspects of the Opioid Crisis”
** National Survey of Drug Use and Health, Goldman Sachs
Latest Bank of International Settlements Report
Low Rates for Too Long = Misallocation of Capital
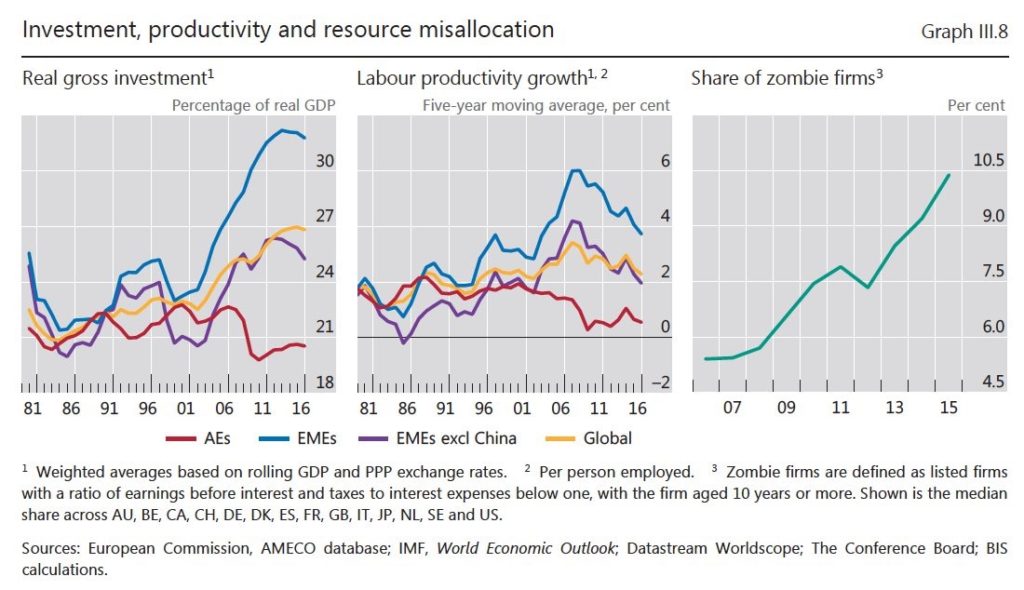 Lots of financial engineering – NOT enough real job creation. Low rates for too long has created “Zombie firms (top right above).” Zombie firms are defined as public companies with EBITDA (earnings before interest, taxes, depreciation and amortization) to interest expenses ratio below one.
Pick up our latest report here:
Don’t miss our next trade idea. Get on the Bear Traps Report Today, click hereThis Decade vs the Last
2007-2017
U.S. Population: +24M
Full Time Jobs: +4M
1997-2007
Population: +22M
Full Time Jobs: +18M
BLS data
Today we’re looking at 125.6m 24-54 Year Olds actually in the Labor Force. As a percentage of the population – this number has come down over the last decade.
Bloomberg’s View on the FOMC, our Comments in Bold
Victory? The Fed is Millions Away from that Declaration
Janet Yellen and her colleagues say they’re closing in on full employment, and she’s tiptoed closer to suggesting that slack has been absorbed, though she never declared total victory.
Reasonable Close? It’s NOT Close at All
She said in January that the labor market was “reasonably close” to the committee’s maximum employment objective, for instance, and that the cyclical element of participation declines had “largely” disappeared.
May have been Lingering on the Sidelines? Really?
The latest data could vindicate the idea that potential workers may have been lingering on the sidelines. The Fed has lifted rates only slowly, and the effect on the economy has been limited as financial conditions remain easy. Against that backdrop, employers continue to hire rapidly, taking on 222,000 new workers last month.
Finally Scraped Bottom?
It seems they’ve finally scraped bottom when it comes to people who are actively applying to jobs and thus classed as unemployed. Unemployment was 4.4 percent in June, up from a 16-year low of 4.3 percent the month before, and the share of people moving from unemployment to jobs has moved lower.
Sweet Accomplishment???
As that has happened, employers have begun to tap sidelined labor pools. The shift has helped to stabilize — and now slightly lift — the labor force participation rate, which measures what share of the population is working or looking for a job. That’s an especially sweet accomplishment for the Fed because it flies in the face of demographic trends, which should be weighing the rate down.
Join our Larry McDonald on CNBC’s Trading Nation, Wednesday at 3:05pm ET
Pick up our latest report here:
Don’t miss our next trade idea. Get on the Bear Traps Report Today, click here
 We have an index of our 21 Lehman Systemic Risk Indicators, the Chicago Fed’s Financial Conditions Index is similar above. Over much of the last five years – as financial conditions tightened, gold surged (see above). On the other hand, in 2017 we’ve witnessed a regime change. This year as the Fed has hiked rates twice – financial conditions eased – NOT tightened. As long as financial conditions are NOT stressed – Yellen’s Fed has runway on the hawkish side to pull back accommodation. Relationship to gold? A year ago today there were close to $15T of negative yielding bonds on earth – this number is now well below $7T today. As bond yields have surged – globally gold is far less attractive to hold – the macro impact on this metal has been profound.
 We must keep in mind, in February there was only a 17% probability of a Fed rate hike in March (according to Wall Street’s economists). This was before the Federal Open Market Committee (FOMC ) began shifting market expectations and ultimately tightened (hiked rates) in March. Rule #1, more often than NOT – Wall St. gets the Fed wrong. Today, the entire street has their eye on September SOMA reduction – rate hikes are (near) unanimously a December issue in terms of street expectations. Our Bear Traps Report research team meticulously measures the breath of crowded trades on Wall St. – very often this is where alpha is found, going the other way.
 In Reflation Trade Revival mode, wheat is trading like Tesla equity. The September wheat futures contract (MWU7) is up 50% since May 15th, 2017. Energy stocks are as under-owned as any sector in the last decade relative to growth. As a result, we’re seeing a colossal sector rotation back into value names (commodity sector equities) as cash hemorrhaging out of big tech (FAANG stocks).
 Commodities soared this week in a Reflation Revival, were you on board?
 Last week’s crowded long bond trade is unraveling quickly. A colossal seller kicked off a flash crash this morning. Positioning in long U.S. Treasury positions recently moved from very short to a crowded long – today bond bulls are running for the hills.
 Yellen’s Hawkish turn has helped fuel a global reflation revival. Just when Wall St. threw in the Reflation towel, she started a comeback.
 Yields spiked today on a hawkish turn from Janet Yellen and Mario Draghi – Central bankers talked up removing accommodation while focused on asset bubbles. Yellen even talked up risks we’ve stressed to clients in recent months- PIK Toggle Structures – extremely aggressive financing in the corporate bond market.
 In our view, the FOMC is NOT comfortable with easing financial conditions as they hike rates. The Fed is trying to do things now “in a more systematic way” and “talk to people in different pieces of the financial sector about all of the things that could conceivably go wrong that are not in our models”
 Today will mark a key sector rotation inflection point. Market leadership is shifting from the loved to the un-loved.
 Quants and algorithmic trading now make up over 30% of the volume across several of the major exchanges. That’s up from less than seven percent five years ago. What’s the only problem with a quant driven market? At the first sign of trouble, the machines simply back away – air pockets are far more common today.
 Once up 86% from the January 2016 lows, Russian equities have lost 10% from their recent highs. Down 4% on the year but stull up 14% since the election of Donald Trump – in line with the S&P 500. This descending wedge above speaks to a key technical level Russian equities are dancing on – we’re about to see a significant move…
