Trump Tweet, Catches Gold Bid

Join our Larry McDonald on CNBC’s Trading Nation, Wednesday at 3:05pm ET

Pick up our latest note here:

Don’t miss our next trade idea. Get on the Bear Traps Report Today, click here


Updated, April 11, 2017 at 9pm

Safe haven assets advanced after the White House press secretary issued a warning to Syria and as tensions over North Korea surged to the highest level in over a year.

Ten Year Bond Bull Market

Lower Yields, Soaring Bond PricesUS 10s Gap

Yes, Wall St. was all beared up on bonds for 2017.  If we close at this level on 10s (U.S. 10 Year Treasury), it would be the best mark since November 15.   For the fourth year in a row, the Street’s consensus has been dead wrong on bond prices.

*YEN STRENGTHENS PAST 110 PER DOLLAR; FIRST TIME SINCE NOV. 18
*Gold Miners GDX is up 3.1% today and 15.7% since March 9th.

All the Asia Risk Off Indicators are Surging:

Yen
S Korea CDS
Cost of borrow on S Korea Equities
Gold
Treasuries
VIX, highest level since November 10th
VIX Futures Curve flattening, most since November 7th

Divergence

S Korea Thai

The Euro was lower against the Japanese Yen for 11 consecutive session, that’s the longest losing streak on record.  The Yen is seen as a safe haven refuge in a rising Asia risk off environment.  The Yen’s surge is viewed confirmation of the N. Korea high drama.  In recent weeks we’ve witnessed a sharp divergence, the cost of default protection on S. Korea has surged relative to their neighbors in Asia.  South Korea is a substantially stronger credit  than Thailand, nearly five levels higher per Moody’s.  On the other hand, the cost of insuring the South Korea’s bonds against default is now more expensive than Thailand’s, a powerful divergence indeed.

Treasuries, Reflation Trade Hype Faces the Deflation Risk

Treasuries 2 vs 10s

Wall St lectured their clients on the “reflation trade” in December, they were unanimously calling for a STEEPER yield curve.  If you look above, the curve is FLATTENING, not steepening.   As investors grow more concerned about the growth initiatives coming out of Washington, they’ve been loading up on bonds.  Key technical levels are being violated as the reflation trade loyalists panic out of their positions.

U.S. bond yields fell following Federal Reserve Chair Yellen’s confirmation the central bank has shifted gears from post-crisis healing to sustaining economic gains. Oil wobbled after five days of gains as EIA data due Wednesday was expected to show U.S. stockpiles retreated from a record, Bloomberg reported.

“I explained to the President of China that a trade deal with the U.S. will be far better for them if they solve the North Korean problem!
North Korea is looking for trouble. If China decides to help, that would be great. If not, we will solve the problem without them! U.S.A.”

President Donald Trump, April 11, 2017

Gold Break New

Gold and Treasuries strengthened with the Japanese yen on lingering investor concern about global security risks and the path of U.S. interest rates. Crude struggled to extend this years.

Join our Larry McDonald on CNBC’s Trading Nation, Wednesday at 3:05pm ET

Pick up our latest note here:

Don’t miss our next trade idea. Get on the Bear Traps Report Today, click here

South Korea 5 Year CDS

S Korea 5 YearThe cost of default protection on South Korea rose to the highest level since July on the surge in geopolitical nerves.  S. Korea’s stock loans for short-selling hit record high amid the tensions. 

Facebooktwittergoogle_plusredditlinkedintumblrmail

Facebooktwitterrssyoutube

Upside Down Cars, Replace Homes

Join our Larry McDonald on CNBC’s Trading Nation, Wednesday at 3:05pm ET

Pick up our latest note here:

Don’t miss our next trade idea. Get on the Bear Traps Report Today, click here

We heard so much about the upside-down home in the years since the financial crisis.  From 2008-2013, many Americans found themselves in homes with negative equity, they owed more to the bank than they could sell their property for.   Today, after eight years of an easy money gravy train from the Federal Reserve – too low interest rates for far too long – we’re seeing a surge in defaults in Auto Loans, Commercial Real Estate, Credit Card Receivables and Student Loans.

Average Percentage of Auto Loans with Negative Equity

2017: 34.1%*
2016: 32.2%
2015: 28.3%
2014: 27.1%
2013: 24.6%
2012: 23.3%
2011: 21.8%
2010: 19.2%
2009: 24.1%
2008: 26.1%**
2007: 25.9%

Edmunds, FED data

**Financial Crisis high
*At the current pace of defaults, 2017 projection

A Colossal Failure of Common Sense

Book CoverNow translated into 12 different languages, our New York Times bestseller is a perfect gift for that college student.

Securitized Auto Loans

Auto Loans new

In Q4, over 32% of all “trade ins”  toward the purchase of a new car were under water, an all time record.  In Q4 of last year we witnessed a sharp deterioration in U.S. consumer credit quality.   This by no means is on the same scale of the 2008-9 financial crisis, but we expect the current debacle to be drawn out and have implications for U.S. equities.  Pick up our latest report on consumer credit, click on the link below.

Pick up our latest note here:

Don’t miss our next trade idea. Get on the Bear Traps Report Today, click here
Facebooktwittergoogle_plusredditlinkedintumblrmail

Facebooktwitterrssyoutube

U.S. Jobs, Consumer Credit Leaving a Stain, Gold Miners Soar

Blog Updated April 10, 2017 at 7:20am

Join our Larry McDonald on CNBC’s Trading Nation, Wednesday at 3:05pm ET

Pick up our latest note here:

Don’t miss our next trade idea. Get on the Bear Traps Report Today, click here

“In December, half of FOMC participants started to factor in fiscal policy economic growth conditions into their 2017 and 2018 outlook. With the Obamacare Repeal and Replacement legislation of life support, the stalled growth engines in Washington are piling up. The execution bar has rarely been higher for D.C. politicians to come together and pass their much heralded agenda. To us, the probability of caution coming out of the FOMC is surging. We think they walk back their fiscal policy assumptions for 2017-18. Bottom line: we are long term U.S. Treasury bulls through the TLT ETF and long Gold miners through the GDX ETF.  We still see 2% before 3% on 10 Year Treasuries.”

Bear Traps Report, March 14, 2017

A Bank of America Merrill Lynch survey of 200 global fund managers showed just a net 8% say gold looks undervalued.  The gold miners $GDX is up 26% from the December lows.  In January, Wall St’s brain trusts lectured us, “underweight gold and emerging markets this year.”  They argued with the Federal Reserve raising rates Gold and Emerging Market equities would under-perform in 2017.  Wrong again Wall St.

2017

Gold Miners GDX: +12.4%*
Emerging Markets EEM: +12.2%*
Utilities XLU: +6.7%*
S&P 500: +5.6%
Bloomberg Dollar Index BBDXY: -3.2%

*Consensus of Wall St’s economists recommended an underweight in 2017, pure comedy year after year.  Weak dollar winners here: Emerging market debt ETF inflows continued for a 14th straight week, bringing the tally since late December to $7 billion, or 18% as a share of assets under management.

A more cautious Federal Reserve and a soft job market have been a colossal tail wind for gold miners and emerging markets.

Stocks 2017

Argentina +27%
Chile +20%
Poland +20%
Mexico +19%
India +19%
Spain +13%
Taiwan +13%
Korea +13%
Austria +11%
Brazil +11%
S&P 500 +5%

Jobs Recap

– Biggest ADP – NFP spread in 5 years!

ADP vs NFP new

Once again, the ADP jobs number (Wednesday) faked out Wall St.  We witnessed the largest spread between the ADP and NFP result in years.

– We’ve pounded the table on bonds since December, think Yellen’s (surprise) speech Monday will take us well toward 2.10% on the U.S. 10 year Treasury Bond.   We believe there was a secular shift in consumer credit in Q4. Hardly anyone has noticed, but in the fourth quarter of 2016 there was a surge in financial stress across America, a shift in financial conditions that may have had a hand in the election outcome. The credit cycle is turning, right before our very eyes. In recent months, we’ve found a substantial amount of evidence in capital markets pointing to credit formation reaching a saturation point. If you look at high quality prime loans, there’s more evidence of a credit event in December 2016. Across the board in consumer credit we witnessed spikes in credit card charge offs, auto loans gone bad, sour commercial real estate, student loans and an uptick (above) in Prime Mortgage Delinquencies. We’ll be out with a consumer credit note later today.

With the Crowd Short Bonds, all they Do is Grind Lower in Yield, Higher in Bond Prices

10s Range

As we stated to clients in December, we’re bullish – not bearish on bonds.  We believe we’ll get close to 2% before 3% this year.

– Big miss in the NFP number, 98k, vs 180k expected, has led to a further bid in bonds, taking them below 2.3% Friday morning. Wage growth was in line, as we expected, the drop in the work week also helped this case in the February numbers. While the headline data points of this report do not look strong, some of the internals are not so bad.

  • As we said in our report to clients, we would be surprised if today’s jobs date is enough for rates *the 10 year bond) to make a meaningful break of its trading range.
  • Today’s ugly jobs data does not shift policy path at the Fed, considering the three month average is still +178k and wage growth is “decent” at 2.7% y/y.

Gold – Copper Spread, Speaks to the Coming Reflation Trade Exit Capitulation

Gold Copper

In December, Wall St. backed up the truck on the relation trade, they recommended clients buy financials, short bonds, underweight gold miners.  Year after year they’re wrong again.  They lectured us, “you need to be in infrastructure plays like copper.”  Today, like scared rabbits they’re running for the hills.

“If everyone is thinking alike, then somebody isn’t thinking.”

General George S. Patton

– Friday’s jobs number was pathetic for this stage of a mature economic recovery.  The number came in 82k below Wall St’s forecasts – and job growth for earlier months was revised down by 38k.  Based on industry data and household survey details, of course the Street blamed severe winter weather for the result.

-Employment growth in private service-providing industries also slowed sharply to 61k (compared to +125k in February and +153k in January), with the deceleration led by education and health services (+16k vs. +66k in February) and leisure and hospitality (+9k vs. +27k).

– While the headline NFP number was lousy, especially relative to the ADP number of 263k, some of the unemployment figures were positive. The unemployment rate fell 0.2 percentage points to 4.5% without us seeing a move in the labor force participation rate. This suggest the labor market is in fact tightening. It is also the lowest the lowest reading in U3 since May 2007 (4.4%). This was seen in the U6 number, measure of underemployment, had a big drop from 9.2% to 8.9%. Prime age employment to population figures also ticked up to 78.5%. These fundamentals are strong.

Retail jobs and Weather are the Big Culprits

Jobs in U.S Retail Industry

2017: 15.2m
2016: 15.5m
2015: 15.7m
2014: 16.1m

BLS data

Retail Roll
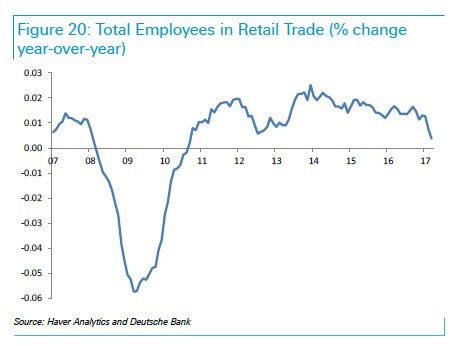
This is a profound secular change in the retail shopping experience, no one has a clue where it’s going to stop.

Manhattan Vacancy Rates, Retail Store Fronts

2017: 18%
2016: 10%
2015: 7%
2014: 5%

C&W Research, Douglas Elliman data

Retail jobs dropped 30k in the March reading and has now dropped almost 90k jobs since the recent high in October. The weather effects in the northeast were manifested in the weaker than expected construction job gains. At only +6k for March, construction jobs were much lower than the 59k number we saw in February.

– A continued poor showing in the headline figures was in the revisions. The revisions for January and February were 38k less than previously reported, taking the three month average job gains total 178k. However, this a number the Fed is more than pleased with.

Goldman

“Our US Economics team increased their subjective probability that the next hike occurs at the June 2017 meeting from 60% to 70%, with the corresponding odds at 10% for July and 15% for September (down from 20% previously).”

Goldman Sachs, April 7, 2017

Goldman doubled down on a June Rate Hike from the Fed, even with the soft jobs data.  By raising their chances of a June hike to 70%, they’re trying to project confidence in light of an economy which still has many structural deficiencies. 

Join our Larry McDonald on CNBC’s Trading Nation, Wednesday at 3:05pm ET

Pick up our latest note here:

Don’t miss our next trade idea. Get on the Bear Traps Report Today, click here
Facebooktwittergoogle_plusredditlinkedintumblrmail

Facebooktwitterrssyoutube

U.S. Missile Strike in Syria, Implications for Oil and Europe

Join our Larry McDonald on CNBC’s Trading Nation, Wednesday at 3:05pm ET

Pick up our latest note here:

Don’t miss our next trade idea. Get on the Bear Traps Report Today, click here

In cooperation with ACG Analytics in Washington: Impact Areas, Oil and European Elections

Tillerson Heading to Moscow on the 12th, for Now

Six months ago, if we told you Donald Trump will be elected President, and the first quarter of his administration would see calmest stock market ever?  Would you believe us?

Household and Small Business Sentiment has Surged the Trump Election:

1.  University of Michigan’s consumer sentiment index reached a 13-year high.

2. Last week the Conference Board’s index of consumer confidence rose to its highest level in 16 years.

3. The NFIB’s small business optimism index is at a 12-year high after having recorded its largest-ever two-month increase in November and December.

If we look at Q1 U.S. stock market volatility found in the S&P 500, the average VIX level was down at 11.74  That’s the lowest Q1 level on record, smallest quarterly average since Q4 2006.   Of course, this all changed in April.

U.S. Missile Strike: Syria Implications

If Assad falls, Syria will look like Libya. ISIS moves in for power grab. Proxy groups fight for power amongst themselves and v ISIS. Meanwhile the US consolidates in neighboring Iraq. In Syria, Russia will either pull or commit, US will likely do the opposite (Russia also likely knew about this as the U.S. warned them to leave, to avoid casualties, they told Assad so his air assets scrambled to avoid the strike. Bottom line: Assad has not fallen yet).

VIX Futures Curve Flattening, Speaks to Geopolitical Risk Surge

1 v 3 VIX Future

The 1 Month v 3 Month VIX futures curve, flattest since (Brexit / Trump election).  If hedge funds are paying up for near term protection, typically comes in front of some pain, lower equities.  Our model measures the speed of the flattening, it’s accelerating at an alarming rate. Cash is pouring into the front end, meaning market participants want insurance against a possible near term drawdown in stocks.  Bottom line: the cost of the April contract is nearly the same for three much insurance on the market.  Typically, as in most of this year – the front end is far cheaper than outer months, NOT today. 

Oil Futures Spike on U.S. Strike

Lets be Clear, Syria’s Oil Output is Less than 0.65% of Global Production 

Brent ES1Syrian production is not the entire story here. We think oil implications are meaningful, it is no secret Turkey would like close oil access. This could give Russia a mandate to take ISIS’ oil fields in the south and then deal with Turkey. Assad regime is also ISIS’s biggest customer in the blackmarket oil trade which is protected by Russian air assets, they still hold the oil fields,  Implications here point to the White House.  Trump must decide to commit in the region if Russia doesn’t or see where the dust settles and risk the power vacuum. Shifts in refugee flow could impact Europe – depending on Turkey’s reaction, it’s likely U.S. military action in the region will exacerbate anti-Islam nationalist sentiments in Europe as ISIS fragments move north.  Bottom line, the migration risk from Syria into Turkey and on to Europe is higher now than ever.  This gives populist candidates like Le Pen in France another argument for more aggressive border controls – the influx of refugees into Europe has already created collateral political stress.

Where’s the Trade?

Pick up our latest note here:

Don’t miss our next trade idea. Get on the Bear Traps Report Today, click here
Facebooktwittergoogle_plusredditlinkedintumblrmail

Facebooktwitterrssyoutube

Listen to Credit Markets, Not Polls in Europe

Join our Larry McDonald on CNBC’s Trading Nation, Wednesday at 3:05pm ET

Pick up our latest note here:

Don’t miss our next trade idea. Get on the Bear Traps Report Today, click here

Trump Lessons in Europe

If there’s one lesson from the Brexit and Trump experience, its don’t listen to establishment (bias) tainted polls.

This time Last Year, we were Lectured by the Global Media:

“There’s No Trump path to victory.”

“We’re looking at an insurmountable blue wall.”

“Trump is polling at less than 7% with women and Latinos, he’s unelectable with those numbers.”

Next

Then Trump won 84% of America’s counties (2623 of 3112), and Michigan, Wisconsin and Pennsylvania for the first GOP win in 30 years in those states.  The lesson, don’t underestimate silent populism.

Today, the France – Germany two year bond spread at fresh five year wides, while final round polling data consistently is showing a 60-40 no contest, Le Pen loss.

Euro vs Le Pen, an Inverse Relationship

Le Pen vs Euro

As you can see above, as odds markers see Le Pen bets on the rise – the Euro has been on the other side.  The Euro is off nearly 3% since March 27, around the same time Le Pen’s fortunes started to pick up.

With the first round of France’s presidential election less than three weeks away, Bloomberg is reporting the yield difference between the nation’s two-year bonds and similar-maturity German securities has widened to the most since 2012.

FrANCE ELECTION

Trump’s victory was derived from states hit hardest by globalization, winning Ohio, Michigan, Indiana, Pennsylvania, Wisconsin.

From 2010-2016, wages in these states were off anywhere from 18% to 3%, BLS, Bloomberg data.

Le Pen in France is using the same playbook.

Where’s the Trade? Pick up our latest note here:

Don’t miss our next trade idea. Get on the Bear Traps Report Today, click here

Two Year Bond Yield Spread, 2013-2017

France 2s
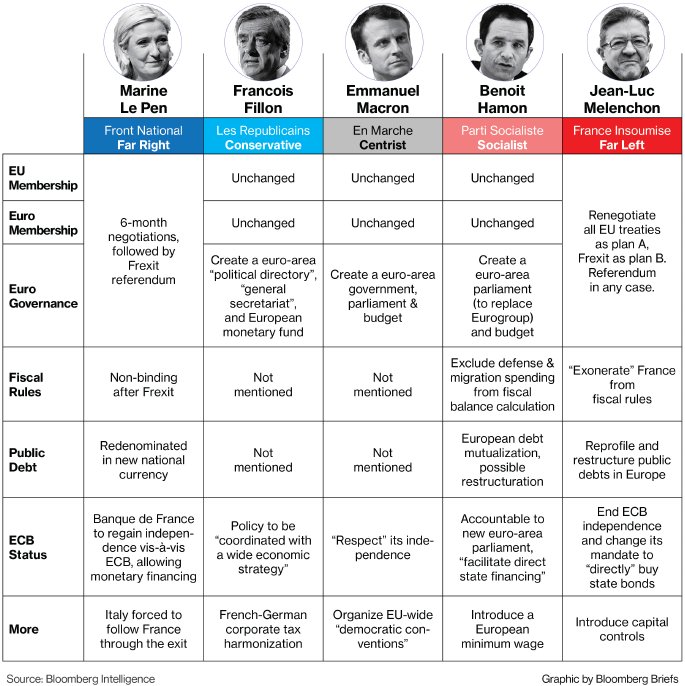
The latest move comes amid signs traders are starting to put election hedges back on as they enter the month of the election, even as polls continue to show euro-skeptic Marine Le Pen will lose in May’s second round. Per Bloomberg, French candidates are due to hold their second debate later today, with the first round of voting scheduled for April 23.

Pick up our latest note here:

Don’t miss our next trade idea. Get on the Bear Traps Report Today, click here
Facebooktwittergoogle_plusredditlinkedintumblrmail

Facebooktwitterrssyoutube

The Inequality Decade Rolls On

Don’t miss our next trade idea. Get on the Bear Traps Report Today, click here

March light vehicle sales equate to  16.62 million seasonally adjusted annualized rate of cars sold, this is the lowest pace in 25 months.  Today’s data is confirming a much feared negative trend for U.S. auto sales, they’ve declined on a year-over-year basis in nine of the last 13 months.

Auto sales were sluggish DESPITE BIGGEST INCENTIVES IN 8 YEARS, over $3500 per vehicle for U.S. automakers.

We view this as a sure sign of credit saturation, they’ve reached the last warm body to shoe horn into a new Honda or GMC Sierra.

Pick up our latest report here:

Don’t miss our next trade idea. Get on the Bear Traps Report Today, click here

The Inequality Decade Rolls on in Ferrari

Ferrari

While the subprime, easy money gravy train (funded by the Federal Reserve) is propping up U.S. auto sales, the Big Winner is found in companies which are inequality’s rage like Ferrari.  With their 2017 high end sales coming in over $400,000 sticker price per car, Ferrari has been a colossal indirect recipient of central bank asset purchases.  The company has thrived in the QE (quantitative easing) / ZIRP (zero interest rate policy) era.   While middle class Americans struggle to make ends meet, Ferrari car sales are up nearly 50%.   In the election that shocked the world, President Trump’s victory was derived from states hit hardest by globalization, winning Ohio, Michigan, Indiana, Pennsylvania, Wisconsin.  From 2010-2016, wages in these states were off anywhere from 18% to 3%, BLS, Bloomberg data.  What’s Ferrari’s stock price and car sales telling us about global inequality and populism’s surge?

While the market attempts to digest the weakness in motor vehicle sales, it is worth pointing out, not all companies seem to be struggling.  Weakness in subprime auto loans along with bloated inventory totals, sent the share prices of GM and Ford much lower in today’s trading. The current weakness in consumer durables that we have also seen in retail, does not paint a very strong picture of how the economy is really doing. However, while excess debt and inventory buildups burden households and large auto makers, some car companies seem to be doing just fine.

Inequality Showing up in the Auto Market

some car companies

While the big three car companies (GM, Ford, FCA) showed year over year declines in car sales, and other more mainstream brands such as Toyota and Hyundai, also displayed weakness, Ferrari and Maserati did not have much of the same issues. Of course, the numbers for luxury automakers are much more volatile as they sell only a fraction of the cars, but to us it is noteworthy to see Ferrari’s sales rise by almost 50%, while the majors struggle.

Pick up our latest report here:

Don’t miss our next trade idea. Get on the Bear Traps Report Today, click here

Lessons 2008-16

Redistribution focused Fiscal Policy + $4.5T of Monetary Policy = the largest surge in Inequality in 100 years

Inequality Ratio, USA Leads the World

U.S. 7.8
Germany: 4.3
U.K. 2.7
France: 2.2
Japan: 1.8

*Mean to median wealth per adult, CSFB data

Don’t miss our next trade idea. Get on the Bear Traps Report Today, click here


Facebooktwittergoogle_plusredditlinkedintumblrmail

Facebooktwitterrssyoutube

What’s Credit Telling Us Now?

Join our Larry McDonald on CNBC’s Trading Nation, Wednesday at 3:05pm ET

Pick up our latest note here:

Don’t miss our next trade idea. Get on the Bear Traps Report Today, click here

One of the most reliable risk indicators in our 21 Lehman Systemic Index is the rate of change found in credit spread contagion.

If a fire is spreading quickly, it’s far more deadly.  As we often share with clients, rule number one – credit leads equities.  Since the financial crisis, nearly every significant drawdown in the stock market has witnessed meaningful (accelerated) credit deterioration in the weeks before.  Our model measures this rate of change and quantifies its significance. 

When compared to U.S. Treasuries – junk bond yield spreads have widened nearly 70 basis points since late February, reversing a long run of positive “risk on” spread compression.  Looking back over the last seven years, the S&P 500 declined anywhere from 3.8% to 20.3% in the 11 plus examples of this contagion.

Looking back over the last 10 years, U.S. high yield finished Q1 in its 94 percentile in terms of expensiveness, now that’s rich.

CCC Love

Even worse, the junk of the junk smells like six day old fish but this month has a market embrace resembling a young bride holding on to fresh flowers.

Central Bank Induced Yield Chase, Created a Toxic Cocktail

If we Look at the CCC Rated Bond Universe

Annualized Returns

2008-2017:  16.8%
1996-2008: 1.4%

Bear Traps Report, Bloomberg data

CCC is a very speculative grade assigned to a debt obligation by a rating agency. Such a rating indicates default or considerable doubt that interest will be paid or principal repaid.

Moral Hazard in Energy Lending

Covenant standards in energy lending are at all time lows.  The Bear Traps Report Team reviewed 15 oil and gas producers that have used 72%+ of their borrowing-base credit lines during spring redeterminations by lenders.

The Most Leveraged

Credit-line use exceeds 85% Abraxas Petroleum, Approach Resources, Mid-Con Energy Partners and Rex Energy.

Of course, crude oil price curves declining through 2021 may influence bank decisions on cutting credit lines.

Pick up our latest note here:

Don’t miss our next trade idea. Get on the Bear Traps Report Today, click here

High Yield vs. Investment Grade Bond Spread

IG v HYHigh yield has underperformed investment grade bonds by 25bps over the last 30 days.

2017’s “Junk” Bond Prices

% of Bond’s Market Value

100-115: 73%
95-100: 15%
Below 95: 12%

Bloomberg TRACE, Citi Index data

It’s nothing short of crack smoking insanity.  This month over 88% of high yield bonds were trading north of 95 cents on the dollar. Bloomberg / Bear Traps Report data.

High Yield Gross Leverage

2017: 4.6x
2016: 4.4x
2015: 4.2x
2014: 4.0x
2013: 3.7x
2012: 3.2x
2011: 3.9x
2010: 4.5x
2009: 4.4x
2008: 4.3x (Credit Crisis)
2007: 4.1x
2006: 3.6x
2005: 3.1x
2004: 4.1x
2003: 4.5x (Credit Crisis)

Bloomberg, Bear Traps Report Data, Capital IQ

We’re sorry, the high yield market is not on crack, it’s actually smoking crystal meth.

Total Leveraged Debt Outstanding*

2017: $2.5T
2007: $1.2T
1997: $310B

*subordinated bonds high yield, senior secured high yield bonds, senior unsecured bonds, first lien bank debt, second lien bank debt

Bloomberg, Barclays Credit Agg

Outflows

U.S. corporate high-yield funds posted $248.5m of outflows for the week ended March 29 after seeing an inflow of $736m last week, according to Lipper US Fund Flows data released this week.

Corporate investment grade funds saw inflows fall to $3.97b from $5.24b the week prior.

Investments in fixed-income exchange-traded funds declined 80 percent in the past week. Inflows to ETFs that invest in corporate bonds slowed and high-yield funds saw outflows.

Inflows to U.S.-listed bond ETFs totaled $1.14 billion in the week ended March 28, compared with $5.75 billion in the previous period, according to data compiled by Bloomberg.

Our Larry McDonald ran a $600m high yield and distressed credit business at Lehman Brothers, and is the NY Times bestselling author of a Colossal Failure of Common Sense.

Book Cover

Pick up our latest note here:

Don’t miss our next trade idea. Get on the Bear Traps Report Today, click here
Facebooktwittergoogle_plusredditlinkedintumblrmail

Facebooktwitterrssyoutube

Investment Newsletter

Show Buttons
Hide Buttons