Time To Sell Volatility
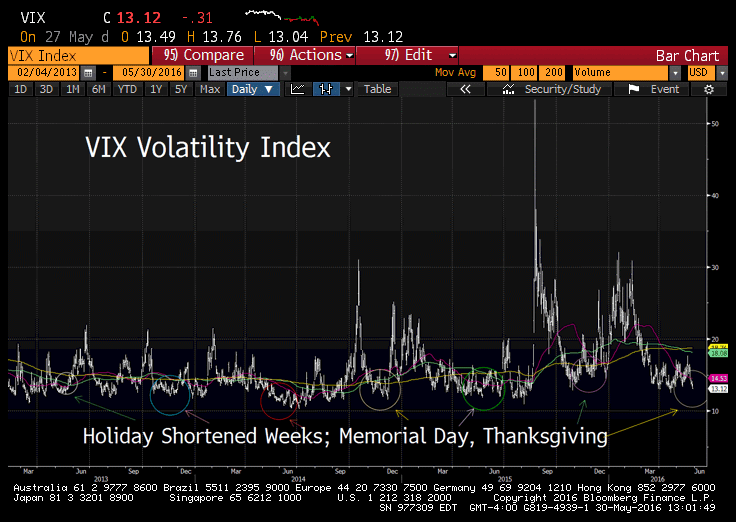
How We Look at the VIX, Chicago Board Options Exchange Volatility Index
“The Trade: We believe the risk – reward in getting long volatility is the most attractive since last November. We are buyers of the VXX ETN.”
The Bear Traps Report, May 31
On May 31st, we stressed to subscribers there’s value in buying volatility during holiday shorted weeks. In recent years, we’ve witnessed a collapse in volatility during light volume trading weeks near holidays. This is especially true in and around month end / quarter end.
Dramatic Shift in the VIX Futures Curve
Over the last 15 days, the VIX has surged from 13.12 to 22.15. On May 31, we made the point to subscribers that volatility was mispriced relative to Brexit, China and U.S. election risks.
“When funds crowd together they buoy trades well past arguable fundamental valuation, next all race out together.”
Paul Tudor Jones
Central bankers keep moving the entire student body left, then the entire student body right. Negative interest rates globally have investors thirsting for yield and alpha, the net result has been some of the most crowded trades we’ve ever seen. What many investors don’t realize is you can use this phenomena as your friend or your enemy.
Get on the Bear Traps ReportOur research shows, in the post Lehman era, as Fed policy has had more and more influence over market performance, stock market volatility has substantially plunged (cheapened) around holiday shortened weeks. Memorial Day, the Fourth of July and Thanksgiving are prime examples below in the chart.
“In acknowledging global economic risks, shooting the March rate hike right between the eyes and then talking the dots from 4 to two. The Fed drowned market volatility, held its head under the water and watched for the bubbles. Now is the time to buy it on the cheap. Buy the VXX ETN (iPath S&P 500 VIX Short-Term Futures ETN)”
Bear Traps, May 31st, 2016
A few weeks ago, we were between Fed meetings, thus making them ideal occurrences for maximum volatility suppression.
In the weeks ahead of the “widely expected” March rate hike (in January 83% of Wall street’s economists and strategists said the Fed would hike again rates by March). The dollar surged, oil plunged and the street panicked and sent the VIX to its highs for the year in mid-February.
Next, the Fed took out their fire hose, they shot the March and June rate hikes between the eyes. The dollar plunged, commodities and emerging markets soared, “risk on” was born again.
As the Fed has backed off their beloved rate hiking policy path, the VIX plummeted to around 13 in late May. The same people who were caught holding plunging stocks in February, were telling us to sell volatility, this was a sure buy signal. Again, volatility was clearly mispriced relative to Brexit, China and U.S. election risks.
VIX Futures Curve: From Steep Contango, to a Move Toward Backwardation
Today, the spread between the VIX 2 month futures contract vs 8 month coming way in, the most substantial curve flattening since mid April.
VIX Futures Curve
| Description | Last | |
| Jun16 | 21.7000 | |
| Jul16 | ↓21.5700 | |
| Aug16 | 21.4300 | |
| Sep16 | 21.7300 | |
| Oct16 | 22.0300 | |
| Nov16 | ↓21.9900 | |
| Dec16 | ↑21.7500 | |
| Jan17 | ↑22.5500 | |
| Feb17 | 22.6000 |
Market bottoms are typically found during periods of backwardation in the VIX futures curve, see above.
How We Measure Risk and Reward
Let us explain, on February 10th investors were paying up for near term downside insurance on stock prices. The front month VIX futures contract was trading substantially higher than the longer term outer months. In other words, the March contract was trading rich to the September contact (see the green above in the chart).
In the fear of February, this was a buy signal for stocks; we recommended our subscribers to get long financials and oil names in our Bear Traps reports and on CNBC.
In recent weeks, the opposite has occurred, the VIX futures curve went into steep contango. In other words, the longer term VIX futures contract (December) was trading higher than the near term contracts (June). When the contango “widens” to extreme levels it is a sign of complacency in the markets, this is one of the reasons we recommended that subscribers get long volatility.
Get on the Bear Traps Report
 It’s a magic act, stocks can rise for years without earnings growth, presto!
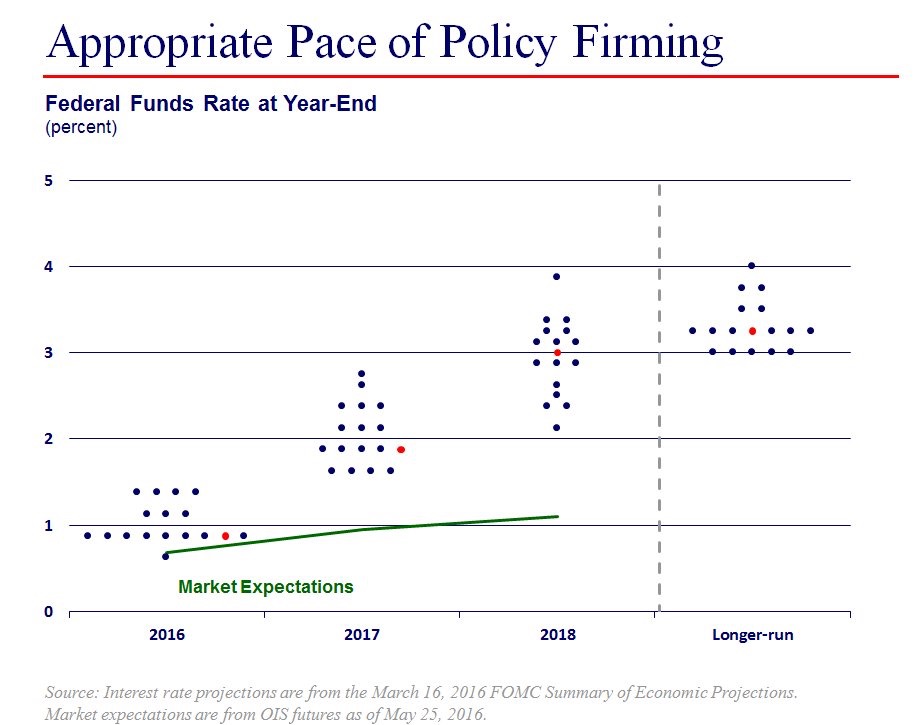 This green line is even LOWER after Friday’s Jobs Bomb.