
Institutional investors can join our live chat on Bloomberg, a groundbreaking venue since 2010 – now with clients in 20+ countries, just email tatiana@thebeartrapsreport.com – Thank you.
Author Lawrence McDonald is the New York Times Bestselling Author of “A Colossal Failure of Common Sense” – The Lehman Brothers Inside Story – one of the best-selling business books in the world, now published in 12 languages – ranked a top 20 all-time at the CFA Institute.
The Mechanical Bid
With prescient flare, in 2012 our long-time friend Josh Brown, better known as the “Reformed Broker”, wrote a piece called the relentless bid. He explained that mammoth asset managers like Merrill Lynch and Morgan Stanley are constantly buying stocks and holding on to them as opposed to trading in and out as fees-based accounts replaced transaction-based accounts. Josh has a good sniffer, this was the early stage of the passive investing torrent.
What was the root cause of the great financial crisis? We would put, poorly understood leverage in the system at the top of the list. Similar problems exist today.
These days there are even larger forces at work that are putting a constant bid under the market. This is the interplay between the $11 Trillion of passive investments and the 0DTE index options, but it has created a ticking time bomb. There are alarming unintended consequences of mechanical buying by passives and the surging options volumes. Both work together in a self-reinforcing feedback loop to artificially distort risk indicators by suppressing volatility. Once again this is causing a massive buildup of one-sided, overcrowded long positions. In the past, this has led to vicious, almost disorderly sell-offs from time to time and it is bound to happen again.
The Ticking Time Bomb
 Open interest in index options has soared to all-time highs. As dealers get lifted on calls in size (large banks offering options – marking markets) – they MUST buy stock (Apple, Tesla, Nvidia etc) in size to hedge their upside risk – this helps trigger short covering. As stocks move higher, option market markets then have to buy even more stock. The gamma squeeze is on. Each day that passes by, chat rooms are now filled with MORE and MORE speculators — crowd-sourcing specific targets with the goal of triggering a FAR more intense SQUEEZE.
The Power of Passives
The cornerstone of this story is the growing dominance of passive investors. Today, passive investors are generally responsible for as much as 70% of all daily stock trading volumes. More importantly, they hold about 50% of all the assets in ETFs and mutual funds, equal to about $11 Trillion. Ten years ago, they held only $2.2 Trillion or 24% of assets and at the turn of the century this percentage was in the single digits. Assets at passive investors have exploded higher in recent years and many of these passive funds are not managed by portfolio managers or any human being for that matter. Computers are running these funds and make allocations based on quantitative parameters. One of the big ones is the level of volatility. So-called volatility-targeting and risk parity funds mechanically increase their exposure to stocks when volatility goes down and vice versa. Another group of investors called Commodity Trading Advisors have about half a trillion in assets and do the same thing. Since the start of the year volatility has been going down. Both realized and implied volatility are grinding lower almost every day, which leads these funds to mechanically buy more stocks every day.
The Passive Overdose
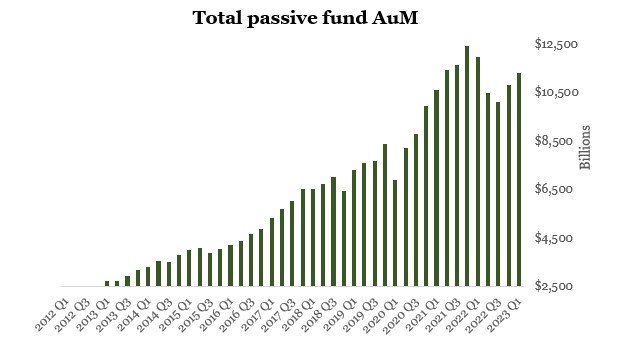 Warning – your 401k has been hijacked by SEVEN stocks. There is nearly $18T inside the Nasdaq 100 – Microsoft, Apple, Google, Nvidia, Tesla, Amazon, and Meta, makeup nearly 54% of the QQQs. Assets under management with passive investors, which are those funds that mirror indices and/or specific quantitative parameters, have grown from $2.5 Trillion in 2012 to more than $11 Trillion by Q1 of 2023.
But Why is Volatility Going Down?
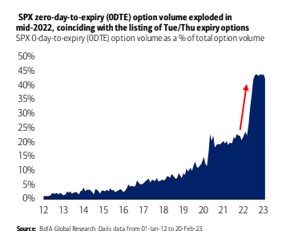
The land of the ZERO Day Junkies – 0DTE options, better known as dailies, now represent almost 50% of daily volumes in S&P index options.
The Zero Day Take Over
While there are plenty of headwinds left, negative surprises have dissipated somewhat compared to 2022 and the Fed is no longer that aggressive with interest rate hiking. This has brought hordes of option speculators out of the woodwork again. But what is different nowadays is that options markets are dominated by so-called dailies, which were introduced in early 2022. These dailies, officially called zero-day to-expiration options (0DTE), list on the same day as they expire. Bank of America’s legendary volatility research team calculated that dailies are now close to 50% of total S&P options volume.
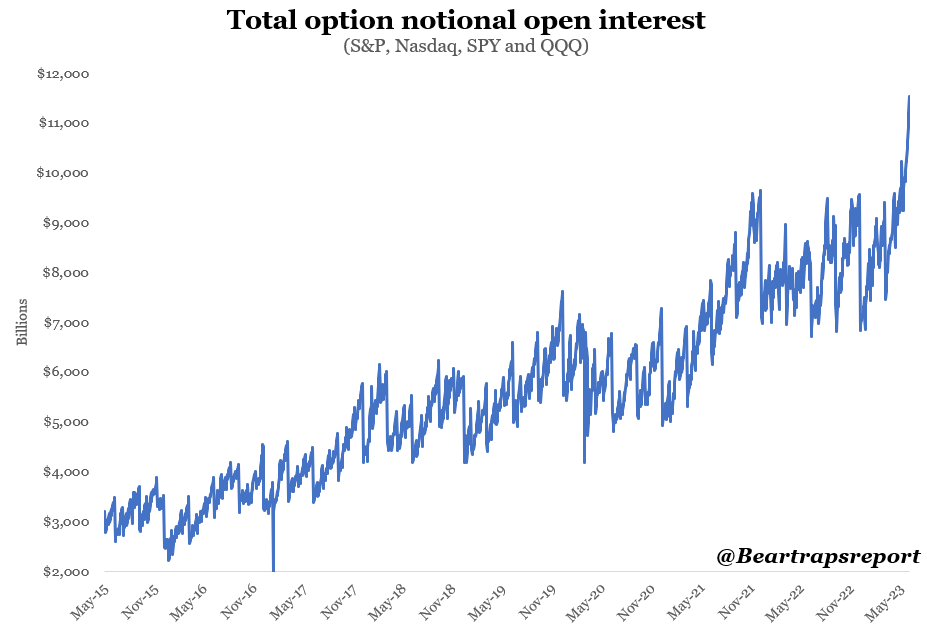
Last year retail investors were reluctant to get involved, with extreme volatility and negative headlines jolting the tape day in and day out. But since the start of the year, open interest has skyrocketed and has now reached a record of more than $10 Trillion. In a market with declining volatility, gamma balances tend to be positive, whereas the opposite is true for increasingly volatile markets. Gamma is a somewhat mysterious concept but what it basically means for the market is that when gamma is positive, dealers must sell when markets go up and buy when markets go down. And when implied volatility decreases, the gamma of calls and puts increases. With option volumes higher than ever, gamma balances are also very large (positive) and this has a dampening effect on intraday volatility. Every time the markets kneejerk lower, dealers come in and buy, and when the market rips, they sell. These gamma-induced intraday reversals leave the market with little change at the end of the day, and implied and realized volatility is melting away (chart 6).
Gamma Overdosing
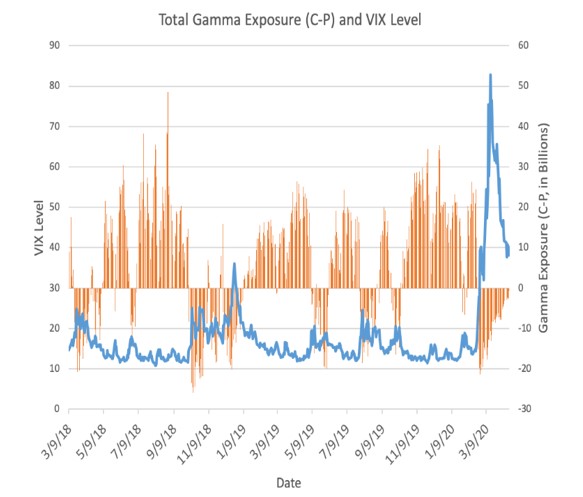 This historical chart shows the interplay between gamma and volatility. Gamma is generally positive and increasing when volatility (VIX) is low and negative and declining when volatility is high. This means that in low-volatility markets dealers tend to sell stock and indices when markets rally and buy when markets sell off. This has a dampening effect on volatility and it’s easy to see a positive feedback loop with lower vol creating higher gamma that leads to even lower vol. The opposite is true as well, and in volatile markets, dealers sell when markets go down and buy when they go up so this enhances volatility.
A Perverse Self-enforcing Loop
As we have determined, the explosion in options volumes is now causing large positive gamma imbalances which dampens volatility. This in turn triggers the passive investors algorithms to mechanically increase their exposure to equities as well. With $11 Trillion of assets, such mechanical buying is colossal. Even a 1% increase in exposure leads to $110 Billion of buying. On top of that, the usual suspects also keep buying stocks mechanically. These are the corporate buyback programs ($850 Billion per year) and the dividend reinvestment plans (DRIPS) that buy stocks with the dividends they receive (around $500 Billion per year). What is new now is the massive increase in option volumes, which increases gamma and dampens volatility. This opens the door for all kinds of trend-following passives to allocate more money to equities, further driving down volatility. This wall of money going into the market pushes stocks up and nothing turns people more bullish than higher stock prices. So this lures is an army of individual investors and speculators, who buy on top of all these different passive buyers. The result is a self-reinforcing feedback loop where layers of different investors pile into the S&P and the Nasdaq, who themselves are disproportionately exposed to a dozen mega-cap stocks.
Top Heavy – The Great Hijacking
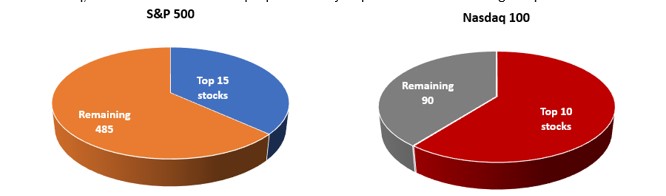 The 15 largest stocks in the S&P now represent 36% of the entire index while the ten largest stocks in the Nasdaq 100 represent 60% of the index. These largest stocks are of course Microsoft, Apple, Amazon, Google, Nvidia, Meta and Tesla and the like.
Then there is the Fund Squeeze
One more factor driving up stock prices now is the squeeze that is occurring in several large mutual funds and ETFs. JPMorgan’s Hedged Equity Fund (JHEQX) is a $15 Billion fund that invests in the S&P and hedges it with a put spread. This hedge is financed with a short, out of the money call. If the market plunges lower, JHEQX has a put to limit the downside, but if the market rips higher, the short call limits their upside. The fund rolls those positions every quarter and for Q2 the date of the roll is June 30.¹ This is when the fund buys back those 40,000 June calls and sells September 29 calls about 5% above where the S&P is. Given the size of the fund, they sold 40,000 calls with a 4320 strike at the end of March. In one day, the open interest in that particular call rose from $800K to $17bl (chart 6). The open interest remained around that level until last week when it ran up $25 Billion.
All this impacts the market in two ways. Speculators are now clearly front running JP Morgan, who they know must come in and buy back that in the money call. They are bidding it up because they know JP is a forced buyer. But this gets dealers get more short, and they have to hedge with buying futures. Moreover, now that the call is in the money, the delta is rapidly moving towards 1, which means that dealers’ gamma is surging higher. As we now know, dealers will suppress volatility with gamma hedging which artificially eats away at volatility.
This is not the only fund in a pickle. The $7 Billion Global X NASDAQ 100 Covered Call ETF (QYLD) is apparently rushing to buy back out-of-the-money calls they have been selling as part of their strategy. These are just two examples but I’m sure there are plenty of more funds that find themselves getting squeezed by this mechanical bid in the market.
OI Trends – Danger Will Robinson
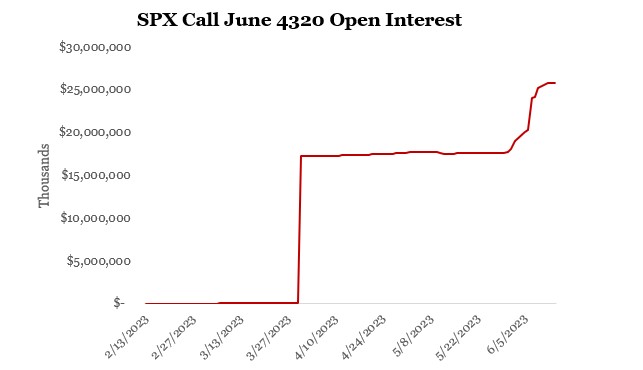 Open interest in the 4320 call that ex[ires on June 30 rose from $800K to $17 Billion when JP Morgan’s JHEQX came in and sold 40,000 calls in late March.
When the Music Stops – the Bomb Goes Off
All of this has two potentially terrifying consequences: it ends up artificially mispricing underlying market risk and it leads to massive overcrowded long positions. Should something unexpected happen that takes the market by surprise, the reverse action usually occurs in lightning speed. A sudden spike in volatility causes waves of passives selling all at the same time. Remember the 2011 flash crash. That was just an appetizer. The Volmageddon in early 2018 squeezed volatility from 9 to 40 and the S&P down 11% in just a few days and there wasn’t even an obvious catalyst. But the blow-up of a couple of short vol ETF, which was the result of months of crowding into long positions, led to almost uncontrolled selling. Then there was the corona crisis. This was an obvious risk-off event, but the selling was so extreme that the Fed had to intervene with a $ Trillion asset purchase program to support markets. The S&P went down 35% in one month and the VIX surged to 83. Liquidity completely dried up and in less than thirty days we had two black Thursdays and one black Monday. Even during the Lehman crisis, it took the market three months to drop 35%.
Should something unexpected hit the market again, and 2018 proves that it doesn’t even have to be some major negative news, it could trigger a domino effect of selling that quickly cascades into a market plunge. I’m not saying this is imminent but when it happens, individual investors are last in line to sell behind the passives, hedge funds, dealers, and institutions. Individual investors need to be aware of why volatility is so low, where the bid in the market comes from, and that the current tranquility is artificial and can change at the blink of an eye.
Volatility Trends
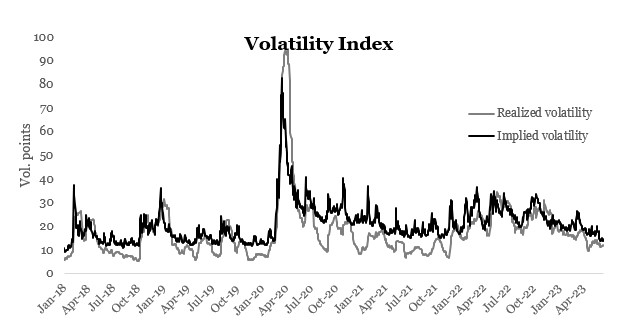
Implied volatility is the market’s forecast of a likely movement in the price of a security or an index. Realized volatility is the measure of price variation for a particular stock or index over the last period such as a month. Both realized and implied volume is going down is due to artificial suppression of volatility by options and passives.
¹chrome-extension://bdfcnmeidppjeaggnmidamkiddifkdib/viewer.html?file=https://am.jpmorgan.com/content/dam/jpm-am-aem/americas/us/en/supplemental/fund-announcement/hedged-equity-reset-faq-2021-series-v2.pdf

