
What do Marie Antoinette in 1788 and the U.S. political establishment of 2016 have in common? Everything.
They couldn’t see an historic, social revolution staring them right in the face? The establishment has had it dead wrong for 15 months, take their advice today with extreme skepticism.
Pure Comedy, Better than Seinfeld
Price of the 30 Year Bond
Going against conventional wisdom has been the trade of 2016. In December of 2015, the entirety of Wall St.’s economists told us to sell bonds. “We must prepare for life after liftoff, expect 3-4 rate hikes in 2016.” In June after the Brexit, Wall St. fell back in love with bonds, “they must be bought for capital appreciation, deflation is here to stay.” In September, they assured us Donald Trump and the GOP are dead, look for “an insurmountable Hillary Clinton Blue Wall in the electoral college. There’s a real risk of the House and Senate flipping to the Dems.” After the Trump near landslide of 309 electoral college votes, the most for a Republican since 1988, Wall St. has spent three weeks playing desperate catch up. Nearly 4 years of “reflation” has been priced in, in 20 days.
U.S. Wage Growth*
2010s: 2.4%
2000s: 4.2%
1990s: 4.5%
*3m moving average, cycle peak, BLS, Bloomberg data
The answer to the Pennsylvania, Michigan and Wisconsin Trump Presidential election wins is right here in wage growth. In the end, China will be the big loser in the populist revolution sweeping the globe. From the UK (Brexit), to the USA (Trump) on to Italy (Renzi’s Referendum defeat); this movement is only in the middle innings. Protectionist trade policies are here to stay, the net result will be found in higher priced goods as inflation’s side effect comes to the table. Manufacturers have been chasing low wages around the world for 20 years in disinflationary chairs, the music has stopped.
UK Wage Growth Plunge = Brexit
US Wage Growth Plunge = Trump
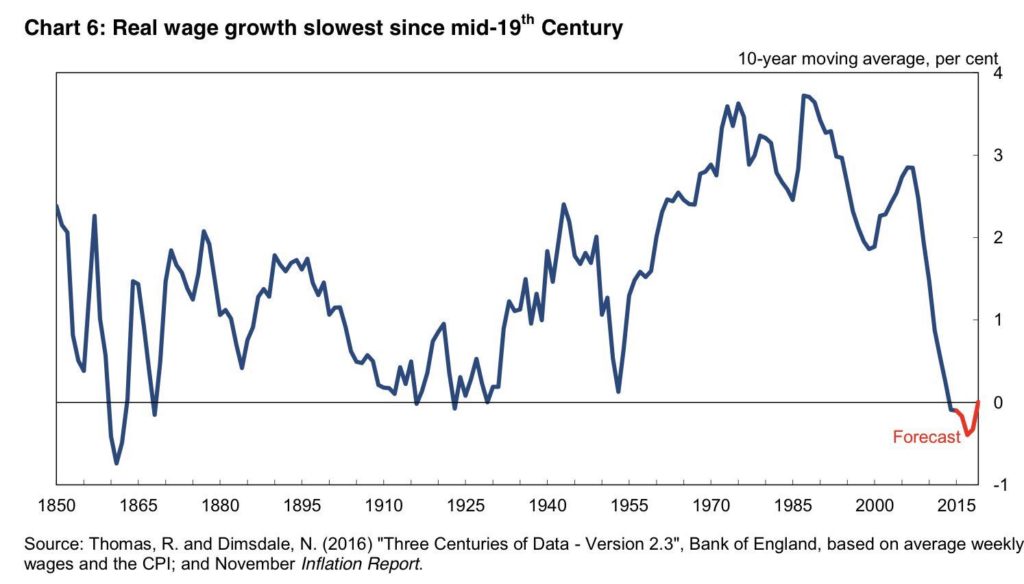
As we pointed out to clients this summer, there’s a strong global connection in the populist rage. For 15 months, establishment types have been trying to claim incidents like the Brexit were “isolated” with no connection to the U.S. Presidential election. As you can see above, globalism has been destroying middle class wages for 30 years in the UK, the people have finally said “enough.”
Don’t miss our next trade idea. Get on the Bear Traps Report Today, click hereClick here for our latest report.
“Donald J. Trump announced his candidacy for president in June 2015, to criticism, mockery, and doubt by the media and political class. Trump’s candidacy and campaign have been called a joke by many since Trump’s announcement. Beware of clueless media elites who spend more time talking to each other at Manhattan cocktail parties than listening to the American people. Trump has come this far against all odds, so is winning the general election really that farfetched? No, it’s not. Trump can win, here’s how and the best trades to prepare for the unexpected.”
Bear Traps Report Election Playbook, July 2016
“We don’t care about the politics, we just want to make our clients money. “
Larry McDonald
The Mixed Jobs Picture
This week’s headline number was relatively strong considering how late we are in the business cycle. The jobs number allows the Fed to go ahead with an interest rate hike in December. However, if we look under the hood, all is NOT well.
There’s a strong connection between the jobs data and election 2016. Why has the financial media had it so wrong? Trump won 30 of 50 states and the popular vote outside New York City. The media and Washington establishment have spent more time trying to convince you Trump couldn’t win than actually digging into the economic data. Once again, investors were misled and are now playing catch up.
This summer we prepared our clients for a Trump victory, with conviction recommended a short bond position (had clients sell down their bond holdings), here’s what we were looking at:
Youth 15-24 Years Old Employment to Population Ratio
Obama: 44-48%
Bush: 53-59%
Clinton: 58-60%
Reagan: 55-63%
BLS Data
“Yesterday, the U.S. 10 year hit our long held 1.40% target. A sea of bond bears has become an ocean of bulls. Brexit’s risk to the global economy has created an opportunity for those willing to step in and short bonds in the face of a large group of clowns rushing to the exits (abandoning their long held bearish bond positions). Sell bonds with conviction, buy the TBT ETF. “
Bear Traps Report Election Playbook, July 11, 2016
US Employment Population Ratio
2016: 59.7%
2010: 58.3%
2005: 63.5%
2000: 65.1%
BLS data
The employment ratio (also referred to as the employment rate) represents persons in employment as a percentage of the working age population.
“Most observers expected the unusually deep recession to be followed by an unusually rapid recovery, with output and employment returning to trend levels relatively quickly. Yet even with the U.S. Federal Reserve’s aggressive monetary policies, the recovery (both in the United States and around the globe) has fallen significantly short of predictions and has been far weaker than its predecessors. Had the American economy performed as the Congressional Budget Office forecast in August 2009—after the stimulus had been passed and the recovery had started—U.S. GDP today would be about $1.3 trillion higher than it is.”
Larry Summers
Inside the Data, What’s Going On?
Fewer and fewer Americans actually pay income taxes, Reagan democrats in Wisconsin, Michigan and Pennsylvania elected Trump in large part because of creeping globalism. The data below show us another part of the story.
% of U.S. Population paying No Federal Income Taxes
2016: 49%
2000: 34%
1990: 28%
1980: 22%
1970: 11%
CBO, FED, Treasury data
Middle class Americans sent us a message on November 8th, but a lot of people still are NOT listening. Actual taxpayers are weighed down by regulation, inequality and carrying a heavy cross of the over all tax burden.
When you incentivize young people NOT to work, they typically don’t. We’ve been lectured by the White House how strong the jobs recovery is, but a lot of young people are NOT participating.
ACA – Obamacare
+ Regulation Surge
+ Capex / Productivity Plunge*
+ Zero Visibility for CFOs, CEOs
= Stock Buyback and Dividend (financial engineering explosion)
= In the last three months:
Full-time jobs added: -98K
Part-time jobs added: +637k
Full Time Jobs Recession
The U.S. has only created a pathetic 2.1m FULL TIME jobs since 2007, and that’s with a population 29.4m HIGHER. Youth unemployment (15-24 yr olds) at 50 year highs compared to EVERY other economic recovery.
*U.S. Productivity is the lowest since 1979, per Bloomberg.
Over the last five years, annual productivity gains averaged 0.6%, the weakest since 1978-1982, Bloomberg data. Fewer and fewer Americans are picking up the bill. We’re 8m full time jobs short of where we should be 8 years into an economic recovery. Everyone’s favorite excuse is demographics, but a highly respected report by Goldman Sachs tells us only 28% of the decay in full time jobs can be blamed on the U.S. aging population.
Don’t miss our next trade idea. Get on the Bear Traps Report Today, click here
U.S. Productivity*
2010s: 0.4%
2000: 2.9%
1990s: 2.0%
1980s: 2.2%
1970s: 2.1%
*recovery peak, BEA / Bloomberg, YoY change GDP relative to total hours of work
Again, the 2016 election upset was a factor of weak underlying fundamentals within the economy, inequality and anemic growth.
What the media is NOT Telling You
The economy is still laboring under excessive regulation and rising core costs. Student loans, Fed/GSE induced housing prices, medical care costs and taxes, have all taken their toll. These factors are the CAUSE of the demographic problems. Policy decisions play a large role in determining long term future trends.
Americans NOT in the Labor Force
2016: 95m
2010: 84m
2005: 74m
2000: 67m
BLS data
A record 95,055,000 Americans were not in the labor force, that’s 446,000 more than October. People over age 16 who are no longer working or looking for work are counted as not participating in the labor force.
Labor Force Participation Rate
Age 25-54
2016: 81.4%
2010: 82.1%
2005: 83.4%
2000: 84.5%
BLS data
Young Americans continue to leave the labor force.
NFP Jobs Report Recap
– The economy added 178,000 jobs in the month of November, basically in line with consensus. The moves in earnings and the unemployment rate were significant but will not change the expectations for the Fed meeting in 2 weeks. The report is bond bullish especially relative to extreme expectations. Wages smell to high heaven.
– Notably, average hourly earnings fell 3 cents, now 2.5% for the year vs 2.8% in October. Part of this fall was seen in hours worked falling. Either way, this should tame inflation expectations.
– The big move in the unemployment rate from 4.9% to 4.6% seems to be largely attributed to the big drop in the labor force, 226,000 month over month.
– The three month average for jobs is 176,000 and the year to date average is 180,000. These totals do not do much to alter current economic readings and are quite strong considering we are in the 8th year of this cycle.
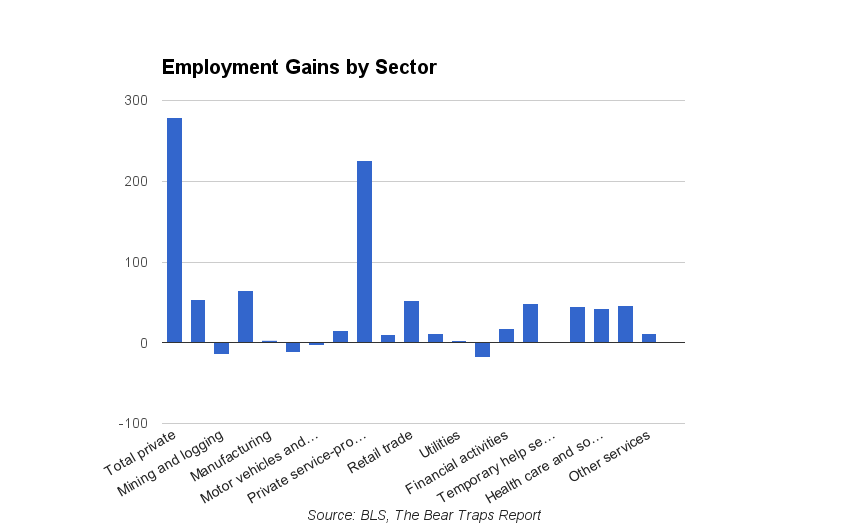
– Strong components of the report were in, Private service providing (139k), Leisure and Hospitality (29k). Both components we expected to be strong.
– Manufacturing was negative again at -4k, but was less negative than the previous two months. Information weighed, with that sector dropping 10k jobs in November.
– Employment to population was steady at 59.7%, this shows there still is significant structural slack with this number below 60%.
Don’t miss our next trade idea. Get on the Bear Traps Report Today, click here

