
Join our Larry McDonald on CNBC’s Trading Nation, Wednesday at 3:05pm ET
Pick up our latest report here:
Don’t miss our next trade idea. Get on the Bear Traps Report Today, click here“In the coming weeks, we expect a super mean reversion. This summer’s weak inflation data (CPI, PPI, PCE, AHE) is unsustainable in our view. U.S. economic data (Citi Economics Surprise Index), the level of expected Fed hawkishness (less accommodation), Washington policy (fiscal policy expectations) have all moved sharply lower with remarkable cohesion. They’re singing the same song. At the same time, geopolitical risks have surged to their highest level of 2017 – suppressing bond yields. The perfect storm of good news for bond bulls has run its course. We are bond bears – looking for higher yields – out over the next 90 days.”
The Bear Traps Report, August 30, 2017
Friday we learned U.S. unemployment declined to 4.2% in September, from 4.4% the previous month – the lowest level since 2001.
AHE’s Move North
Average Hourly Earnings surged 12 cents in September to $26.55. That was the largest move higher since 2007. For the 12 months that ended Sept. 30, wages were up 2.9%, well above the low inflation rate.
Sell Off in US Treasuries Meets Resistance
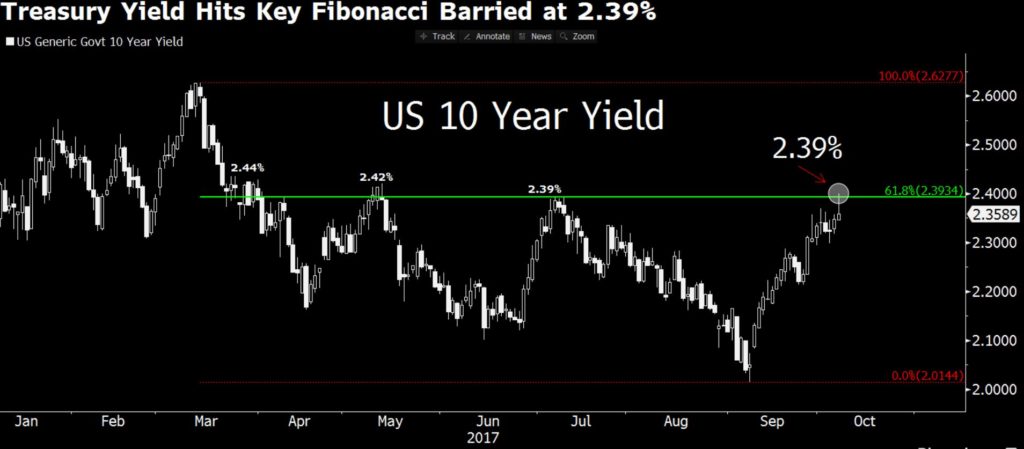
The U.S. 10-year treasury yield has surged up to an important Fibonacci resistance level near 2.39%. As we examine treasury futures using the Bloomberg terminal, TY1 has reached important lows recorded in July and May at 124-25+/124-23. Lower bond prices meet higher yields indeed. After the yield spike – since September 8, the Bloomberg Barclays Global-Aggregate Market Value of Bonds has lost nearly $1.5T.
It’s clear, labor force participation is moving higher for the young and able – this development has wages heading north. Bottom line, when measuring risks to higher bond yields, Average Hourly Earnings AHE is far more important today than the actual jobs number.
Rate Backup Victims Include Commercial Real Estate
 Since September 8, the yield on the 10 year US Treasury bond has surged from 2.01% to 2.39%, while the Real Estate Select Sector SPDR Fund XLRE is nearly 5% lower. In interest rate futures, the probability of a December Fed rate hike has surged from 21% to 80% – large cap REITS have been one of the big losers on the follow. Technically, the XLRE is on a key level – a possible trend line violation (top right above) has longs nervous.
Yelvington’s AHE Revisions
An important observation from our associate Brian Yelvington, we must NOT overlook the July Average Hourly Earnings AHE revision (see the chart below – yellow line), the revisions’ IMPACT is impressive.
A Colossal Bounce in the Revised Data
Average Hourly Earnings AHE risk to higher bond yields is real. Lost in all the noise this week are these meaningful developments. Not only did September print at 0.5% but August was revised to 0.2% (from 0.1%) and July to 0.5% (from 0.3%). Inflation has finally arrived!
Fed’s Rosengren Saturday
“Already-tight labor markets are likely to tighten further as the economy continues to grow faster than its potential.”
Federal Reserve Bank of Boston President Eric Rosengren said on Saturday.
*ROSENGREN: ALREADY-TIGHT LABOR MKTS LIKELY TO TIGHTEN FURTHER – October 7, 2017
*ROSENGREN SEES RISKS IF FAIL TO RESPOND TO VERY TIGHT LABOR MKT – October 7, 2017
Rosengren is not a voting member of the rate-setting FOMC this year.
Data Pointing to (further) Bond Yield Spike
 The relationship between 25-54-year-olds actually in the labor force to Average Hourly Earnings points to a coming problem for bond yields. As labor force slack has been chewed up, AHE’s summer reversal (bounce) speaks to bad news for the crowded long duration trade.
Correlation US Treasury Bond Yields vs Gold*
2017: -0.81%
2016: -0.62%
2015: -0.45%
2014: -0.32%
2013: -0.23%
2012: +0.21%
*Rolling 1 Year, Bloomberg – Citi data
Investors in the gold trade are just starting to realize, they’re not trading gold they’re trading (interest) rates. The negative correlation between higher bond yields and lower gold prices has exploded in recent years, north of 80%. Gold prices are clearly rates driven – since the September 8 reversal higher in bond yields, gold prices (XAU) are 7.1% lower (gold miners GDX -10.1%).
Inflation Expectations
Low inflation expectations in the marketplace have been a trouble spot for the Fed. Sure, inflation has remained tame throughout most of this year – but recent price action is getting attention. Since August, the surge in breakeven rates, a gauge of US inflation expectations, is a foundation of hope for dollar bulls. The 5-year 5-year forward breakeven rate is near 1.90%, well above the June lows. The possible wedge break (above in the purple circle) is a key technical level. A break above into new real estate will put the Fed on notice that market participants are taking inflation far more seriously. This is something which will draw more rate hikes (raise expectations) out of the FOMC in our view.
Don’t miss our next trade idea. Get on the Bear Traps Report Today, click here

Hi – regarding your 10-year yield chart and the 2.39 – 2.40% area, what are your starting and ending Fibonacci points?