Off Balance Sheet Hell

Join our Larry McDonald on CNBC’s Trading Nation, Wednesday June 8, at 2pm.

Pick up our latest Bear Traps Report menu here.

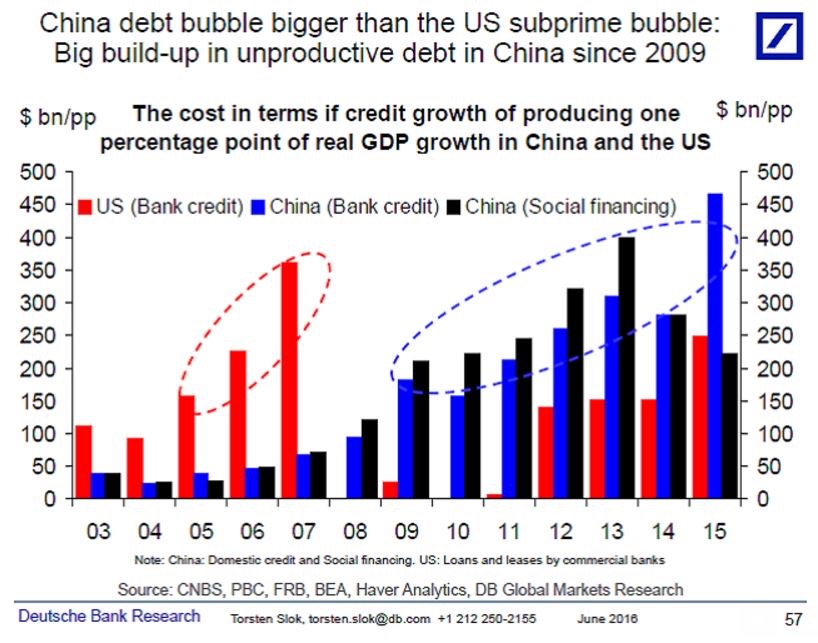
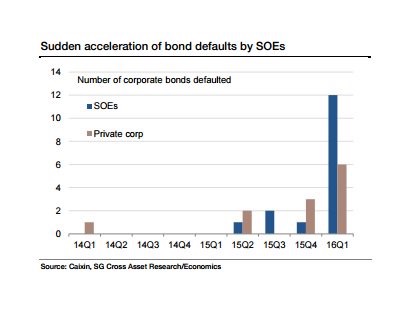
The explosion of off balance sheet financing in China is creating Lehman like risk across Asia’s financial system.

U.S. equity investors must keep an eye on China.  The last two elevator shaft drops in the S&P 500, 12% last August – September and 14% in January – February, both had there genesis in China.

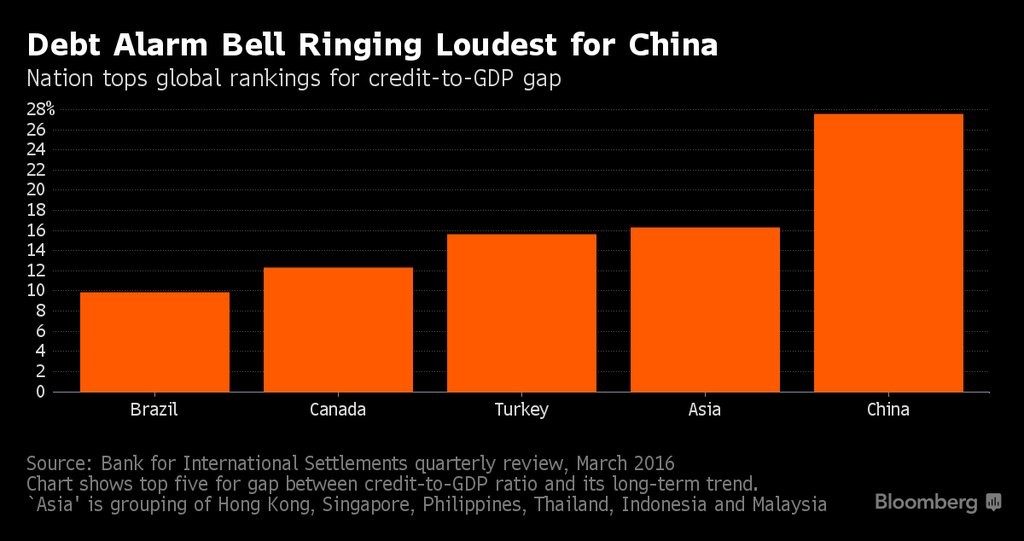
“The regions face high levels of contingent liabilities.” Moody’s

“Off balance sheet financing increases uncertainties.” S&P

Year-to-date, there have already been 71 downgrades by S&P Global Ratings and 150 by Moody’s.

China Off Balance Sheet Financing*

Q22016: $300B

Q12016:  $160B

Q42015: $230B

Q32015: $230B

Q22015: $140B

Q12015: $0

*local government bond issuance surges to a fresh record high

Shadow Banking 2.0

An Evil Thirst for Yield

Lets not forget, from December 2001 through November 2004, the Federal Reserve kept rates between 1% and 1.75%, down from 6.5% in 2000.

Fed Funds

The net result?  Trillions of dollars flowed into shadow banks in the USA as investors sought higher yields.

The same thing is playing out today in China.

Cost of Default Protection on China

China CDS

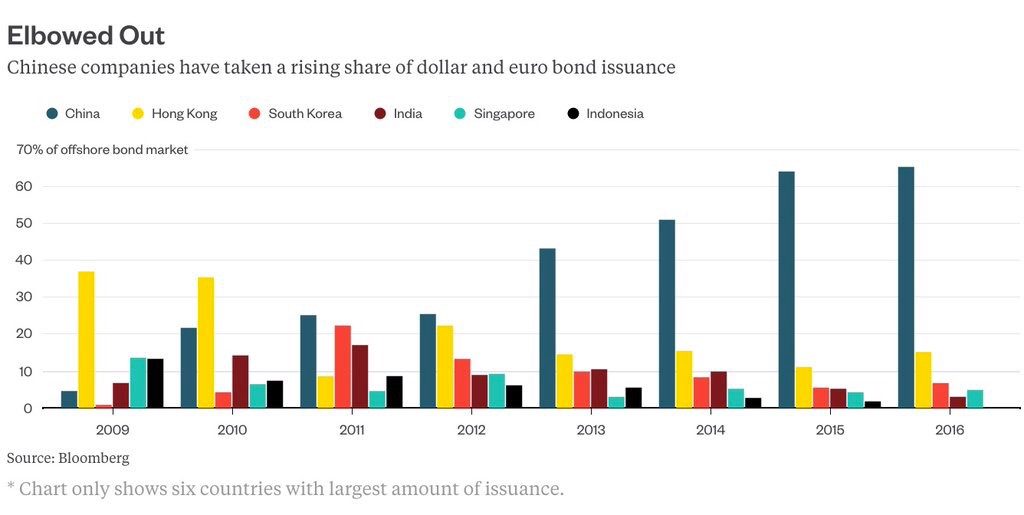
Direct sales of local government bonds have surged to a record 2 trillion yuan ($304 billion) since March 31, up from 906 billion yuan in the first quarter, fueled by a program to swap expensive debt for cheaper municipal securities. Moody’s Investors Service and S&P Global Ratings say that while municipal notes are a more transparent way of raising money than the previous practice of using private financing vehicles, the concern is that authorities are still resorting to off-balance-sheet funding methods.

Bloomberg

The Global Epicenter of Risk

2015-16: China / Asia

2010-12: Europe

2006-8: USA

One of our classic systemic risk indicators is found in global banks positioned near the epicenter of risk.  Standard Chartered is a leveraged bank with a high concentration of risk focused on Asia.

Stan Chart

“Our negative outlook on the Chinese sovereign ratings reflect both slow economic rebalancing and growing financial risks,”

“Non-government debt is still growing relatively quickly and off-balance-sheet financing increases uncertainties in the financial system that could worsen the impact of any potential economic or financial shock on China,” 

S&P Global Ratings

Cost of Default Protection on Indonesia and Malaysia

Malaysia Indonesia

Our trade ideas focused here include….

Pick up our latest Bear Traps Report menu here.


Facebooktwittergoogle_plusredditlinkedintumblrmail

Facebooktwitterrssyoutube

U.S. Dollar Trading like a Biotech Stock around Jobs Reports

Join our Larry McDonald on CNBC’s Trading Nation, Wednesday June 8, at 2pm.

Pick up our latest Bear Traps Report menu here.

Over the last few years, Wall St. banks have lectured us, over and over again on expectations of “strong” jobs reports, oh “how resilient the U.S. economy is.”

“We must be ready for life after liftoff in a rising rate environment.” 

Wall St’s Economists

Today, they have their tail between their legs.  Even the emperor, Goldman Sachs, who just two months ago was calling for three rate hikes in 2016, has backed away and lowered the bar.

U.S. economy looks to be in danger of losing its main pillar as employers throttled back hiring in May to the lowest level in almost six years.  The slowdown — payrolls rose by 38,000 after a downwardly revised 123,000 in April — raised questions about the ability of consumers to keep spending at a good clip.  Bloomberg

The U.S. Dollar on Jobs Report Friday

DXY Jobs
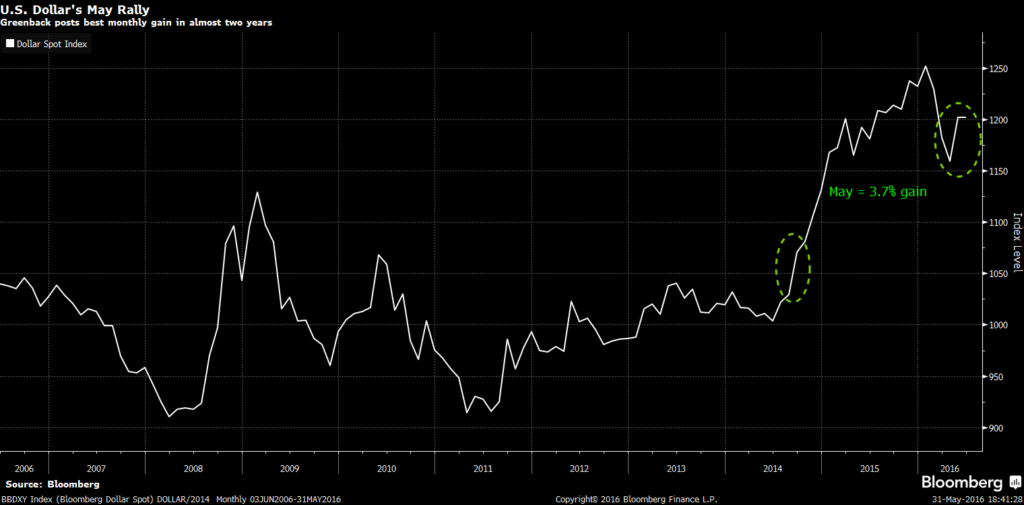
The U.S. dollar has been acting like a biotech stock in and around incoming jobs data.  Central bankers have far too many asset managers trying to create alpha (returns) around their speeches and incoming data.  The result?  Capital destroying  volatility in and around news flow.  Each time we see far to many people on once side of the boat, listing her closer to capsizing.

Wall St’s Expectations and Crowded Trades

File_000 (8)

On January 1st, by now the street was expecting 220k to 260k new jobs a month.  On Friday, a rough patch in the U.S. economy and a Verizon strike has the crushed the crowd, just 38k jobs were created in May vs Goldman’s 165k above.  In recent years, the secret to trading Fed policy and the U.S. economy has been found in measuring just how crowded expectations have become, how much has been priced into each trade.

$13T of Debt = 1m New Jobs

Since 2007, full time jobs in the U.S. have only increased 1m while the population has surged by 23 million people.  That’s a lot of former workers (contributors) at the beach.  This is NOT “full employment.”  That’s a fantasy. BLS data.

Since 2007, U.S. government debts are $10T higher, while corporate debt has advanced by $3T (that’s a doubling).  Blind economists are missing the impact of leverage on the economy.  Entitlements are clearly crowding out the private sector.  BLS data.

Scared Rabbits

The poor street’s terrified economists, after being embarrassed for four of the last 5 months, having their “jobs bar” far too high, now they’re faced with even more uncertainty.  We’ve seen this show so many times before, group think is a bad place to be.  Huddled together, they feel more secure, but in the end they just make it easier for those willing to take the other side of the trade.   There is a reason 99% of economists have never sat in a risk seat, it will stay that way for years to come.

What are they Missing?

For well over the last year, we’ve stressed the global wrecking ball that is the U.S. dollar.  Since early 2014, we’ve maintained both a 1.40% target on the U.S. 10 year and zero rate hikes for 2015 and 2016, that’s been our position well stated in our Bear Traps reports.  U.S. economists have been far too focused on the U.S. economy instead of the international picture as well as credit risks’ impact on Fed policy and rates.

Get on our next trading ideas and distribution list.

Pick up our latest Bear Traps Report menu here.


Facebooktwittergoogle_plusredditlinkedintumblrmail

Facebooktwitterrssyoutube

Global Investors Hiding Out in the U.S.

An interesting look at year to date ETF flows from Bloomberg.  Nearly $56B inflows to the U.S. this year vs $17B outflows from Japan and Europe.  The PE on the S&P 500 has expanded from 17x to 19x this year, it appears a lot of investors are hiding out in the U.S.

Pick up out 21 Lehman Systemic Indicators Here


In Millions of U.S.

Country Netflow Netflow Flow%
Highest
United States ł +55,914 +3.1
Canada +3,519 +6.8
China +2,198 +2.3
United kingdom +1,660 +5.6
Brazil +723 +13.6
Australia +710 +5.9
Colombia +247 +26.6
Asia Pacific* +219 +2.9
Latam Region* +164 +10.6
Europe ex UK* +140 +3.3
Lowest
Russia -358 -6.1
Taiwan -369 -4.6
India -400 -2.8
Mexico -521 -11.8
Italy -700 -11.5
Spain -880 -23.5
Japan -1,208 -0.6
European Region* -3,683 -3.4
Germany -3,722 -8.5
Eurozone* -8,905 -5.0
Facebooktwittergoogle_plusredditlinkedintumblrmail

Facebooktwitterrssyoutube

Lehman 2.0, China Moves to “Securitize” Toxic Debts

This morning, Reuters and Bloomberg are reporting securitization of distressed assets once again is emerging as a creative venue, this time for Chinese banks to offload their toxic bad debts.

Pick up out 21 Lehman Systemic Indicators Here

 File_002 (1)

Central Banks and Investor’s Reach for Yield

 Act #1: 2004-8

$3 Trillion:  US Mortgage Backed Securities, CDOs, RMBS, MBS, NINJA loans (No Income, No Job, No Assets)

 Act #2: 2010-16

$5 Trillion: Commodity Debt, Emerging Market government debt, EU Bank CoCo debt, MLP debt, China SEO Debt, Puerto Rico debt

Bloomberg

File_000 (2)

In a repeat of 2007-8, Central Banks have kept interest rates far too low for to long.  This forces yield hungry investors to reach for yield, oh how we’ve seen this show before. The bottom line, trillions (U.S. dollars) of capital is in places it just shouldn’t be.

The fundamental problem, 99% of central bankers have never taken professional risk, they’ve never hit a 90mph fast ball.  The have written and theorized at great length on the subject, but they’ve never actually been in the game.

File_001 (2)

In 2007, they couldn’t see the 2008 financial crisis coming at U.S. financial markets, as many recall Fed Chair Ben Bernanke lectured us “subprime risks are contained.”  The Iceberg was right there, they couldn’t see it. 

Today, they sit back as the disgusting debt load floats, floats and floats higher.

File_002 (2)

The recent success of bad-debt securities sales by Bank of China and China Merchants Bank may prompt more securitization by China banks. The six largest listed banks are all taking part in a 50 billion yuan ($7.6 billion) pilot program, Reuters reported. Broker Guotai Junan estimated bad-loan securitization will reach 1.5 trillion yuan in 2016. The sales may limit credit costs and help banks’ profits.

File_003

Companies Impacted: Bank of China and China Merchants Bank sold distressed asset-backed securities totaling 534 million yuan in May. AgBank and China Construction may soon follow with similar plans, according to the Shanghai Securities Journal. ICBC and Bocom are also participating in the pilot program.

Join us Here for more…


Facebooktwittergoogle_plusredditlinkedintumblrmail

Facebooktwitterrssyoutube

The Global Wrecking Ball that is the U.S. Dollar

Join our Larry McDonald on CNBC’s Trading Nation, Wednesday June 1st, at 2pm.

Pick up our latest Bear Traps Report menu here.

MAY ISM MANUFACTURING: 51.3 vs 50.3 exp.
PRICES PAID: 63.5 vs 58.5 exp.
Sub Indices:
– New Orders Index: 55.7 vs 55.8 prior
– Production index: 52.6 vs 54.2 prior
– Employment Index: 49.2 vs 49.2 prior
– Inventories 45.0 vs 45.5 prior
(So higher prices drove the beat in ISM, most other components weak/unched)
ISM ManufacturingOver the last year, the global wrecking ball that is the U.S. dollar index has ripped apart the global economy.  The pull back from February – April in the greenback was a breath of fresh air for markets.  Last year, U.S. ISM Manufacturing was hammered by the dollar’s surge, today it surprised to the upside.
The price of a Fed “liftoff” (strong dollar) is a lot higher than economists tell you, they don’t look at risk.
We have our top 5 trading ideas looking ahead at the Fed’s next move, pick up our latest Bear Traps Report menu here.
Facebooktwittergoogle_plusredditlinkedintumblrmail

Facebooktwitterrssyoutube

Air Ball: China Manufactured PMI

Join our Larry McDonald on CNBC’s Trading Nation, Wednesday June 1st, at 2pm.

Pick up our latest Bear Traps Report here.

Breaking News: They call it China Manufacturing PMI, but it’s just manufactured.

Manufacturing PMI at 50.1 vs expected 50.0 vs prior 50.1. ( the range was 49.7-50.2; 27 economists, or lost persons searching in the dark).
Non-manufacturing 53.1 vs prior 53.5.
One would have hoped a $1T stimulus program, coming on the back of a massively re-leveraged banking system,  a less pathetic result would have come forth.  They’re running out of gas.


China PMI

China’s capital outflows will ONLY accelerate as yuan depreciates in response to a stronger dollar (sharpest surge since 2014) in response to the Fed’s beloved rate hike plans.

State Owned Enterprises represent 50% of ALL the loans of the Chinese banking system, and these SOE loans are the most troubled loans. The total claim of Chinese banks on the non financial Chinese corporations reached 175% of GDP by end Q1.

If 25% of SOEs become NPL (non-performing), they wipe away the ENTIRE capital base of the Chinese banking system.  For our full report, click below.

Pick up our latest Bear Traps Report here.


Facebooktwittergoogle_plusredditlinkedintumblrmail

Facebooktwitterrssyoutube

Best Dollar Run Since 2014, Winners and Losers

Join our Larry McDonald on CNBC’s Trading Nation, Wednesday June 1st, at 2pm.

Pick up our latest Bear Traps Report here.

The Fed governors have successfully talked the dollar higher.  So far Mr. Market hasn’t slapped them across the wrist, but we know that’s coming.

The U.S. Dollar posted its best monthly gain in almost two years on speculation the Federal Reserve is getting closer to raising interest rates as soon as June. Bloomberg’s Dollar Spot Index, which tracks the greenback against 10 major peers, added 3.7 percent in May, its best performance since September 2014.

image (1)

At the Bear Traps Report, we made a bullish call on the U.S. Dollar on May 2nd.  For a look across the meadow of the next six months, winners and losers.  Pick up our latest Bear Traps Report here.

Facebooktwittergoogle_plusredditlinkedintumblrmail

Facebooktwitterrssyoutube

Investment Newsletter

Show Buttons
Hide Buttons