
Join our Larry McDonald on CNBC’s Trading Nation, Wednesday at 3:05pm ET
Pick up our latest report here:
Don’t miss our next trade idea. Get on the Bear Traps Report Today, click hereImagine walking through the park and across the way there’s a seesaw with an obese child on one end and a thin youngster on the other, that’s no fun. It simply doesn’t work.
When you think about the $1.5T of capital that’s flown into passive bond ETFs and risk parity strategies in recent years, this crowd has a colossal disinflation bet on. In other words, so much money has flown into bonds at extremely low-interest rates, if yields surge* there’s no protection on the other side.
*Forget about a surge, just don’t rally. Interest rates down, bond prices up. If interest rates are unchanged, bond prices will be as well.
In a regime change, a period where stocks and bonds move lower together, the flight of assets out of passive bond / risk parity strategies will be ferocious. Click here to get a peek at our winners in this new regime.
VIX Spikes above Twenty vs. US 10 Year Bond Yield
Mar 2018: 2.76%
Feb 2018: 2.81%
Nov 2016: 2.29%
Jun 2016: 1.37%
Feb 2016: 1.68%
Sep 2015: 1.97%
Jan 2015: 1.67%
Oct 2014: 1.90%
Jan 2014: 2.57%
Oct 2013: 2.50%
Bloomberg data
Stocks Down, Bonds Down?
Think of the dentist in Cleveland, Ohio with $1M in stocks and $1M in bonds in a portfolio. For the first time in 30 years, he / she is looking at their brokerage statement and seeing NO wealth destruction OFFSET from bonds. We have an eye on credit quality globally (AAA rated corporates / sovereign credits are off 30-40% in terms of the amount of high-quality paper last 10 years). Next, shift your eyes on the debt to GDP in the G20, up from 70% to near 100% (maybe 110%). Then look at the EM dollar-denominated debt issued 2007-2017, in the trillions, there’s a new player at the table trying to sell / refinance a large debt load. All this speaks to a regime change, we’re in the 1-2 inning we believe, more to come.
Q1 2018, Jack and Jill Ran Down the Hill
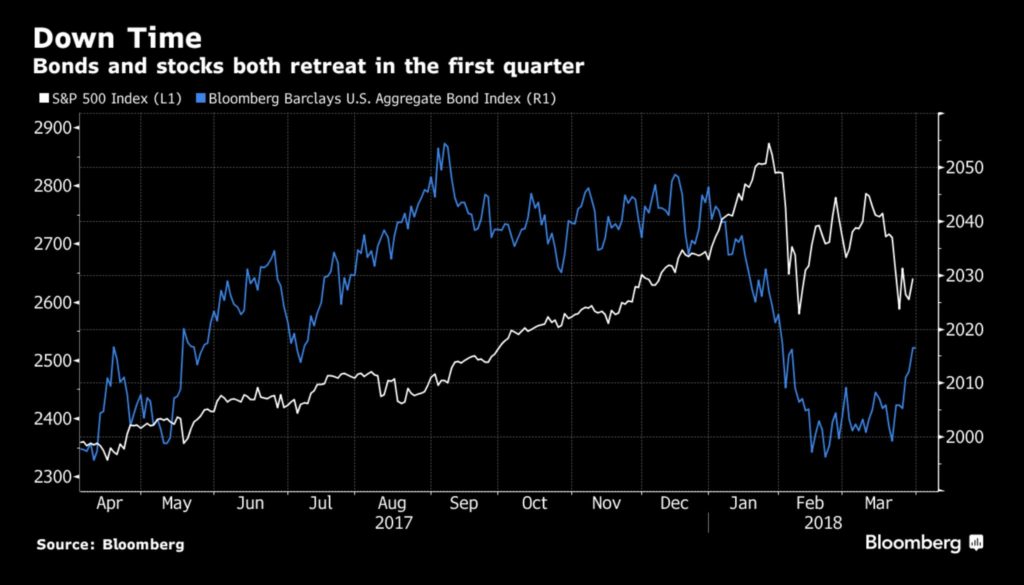
Even with the bond rally in March, they still finished Q1 in the red with stocks.
Largest US Equity Market Wealth Destruction
2008: -$10.5T
2015: -$4.5T
2011: -$3.7T
2018: -$3.2T**
2010: -$2.4T
*Last 10 years, Bloomberg US Market Capitalization data.
**only instance in the last 18 years where bonds also lost value. In the 2018 equity drawdown, bond SOLD OFF from 2.05% to 2.85%, ADDING nearly $1.4T of ADDITIONAL wealth destruction.

