
Join our Larry McDonald on CNBC’s Trading Nation, Wednesday at 3:05pm ET
Pick up our latest report here:
Don’t miss our next trade idea. Get on the Bear Traps Report Today, click here
This blog was published on July 20th, on July 26th Facebook plunged 22% on record volume, $120B was wiped out in one day – the largest single stock incident of wealth destruction on record.
Market breadth — “a method used in technical analysis tries to determine the direction of the market. Positive market breadth occurs when more stocks are advancing than are declining and suggests that the bulls are in control of the market’s momentum. Conversely, a disproportional number of declining securities is used to confirm bearish momentum.”
-Investopedia
“If I could avoid a single stock, it would be the hottest stock in the hottest sector”
Peter Lynch, Portfolio Manager of the Fidelity Magellan Fund 1977-1990
The Fab Five: FAANGs Equities (Facebook, Apple, Amazon, Netflix, and Google)
One of the golden rules of market analysis is found in true underlying breadth. Looking at U.S. equities today, there’s burning question; how many stocks have really been invited to this party? Every day we hear about markets hitting new highs, despite the fact that the S&P has been wrapped around 2800 since January. Above all, beneath the surface, there’s something far more disturbing. Our Index of 21 Lehman Systemic Risk Indicators has risen to its HIGHEST level since the summer of 2015.
Enjoy our segment on CNBC with an analysis of the FAANGs.
S&P 500 Index Price
July 20: 2800
June 13: 2800
Mar 13: 2800
Jan 16: 2800
Bloomberg terminal data
The Fatal Passive Overdose, BEWARE!
Since 1993, capital shifting into passive asset management is up 161x, this compares to only 7x for active management. Nearly $7T is now positioned in passive asset management, over $2T of this money has arrived in the last five years. Why does this matter? Passive asset management is simple ownership of the market through index funds, the capital MUST be fully invested and has been the fuel behind the toxic run-up in FAANG equities. Let us explain.
One Large Beast
Looking at the passive asset management orgy, there’s no better example than the Fidelity Magellan Fund. Famously known as the largest mutual fund on earth in the 90s, what became of this beast is nothing short of remarkable. With assets north of $100B back in the year 2000, today he sits as just a shell of his former at $17B. The most shocking part of this story is found in the explosive asset formation in Fidelity’s S&P 500 (Passive) Index Fund. Assets in this giant have climbed to more than $153B, with $21B forced into FAANG equity ownership. As a market-weighted, passive index fund there is no choice or selection process, this beast MUST own these FAANGs – a colossal failure of common sense indeed. It’s NOT Fidelity’s fault, they’re just offering another index fund the mad mob wants to invest in. This is just another example of a classic, late-cycle development often found in tired bull markets – the hot money chase indeed. As more and more capital flows into passive index funds, more and more FAANG shares MUST be owned. Returns appear far better than the rest of the market’s offerings, so even more capital flows in – it’s a toxic, self-fulfilling cycle – when broken the declines will be HISTORIC.
Largest Weekly Fund Capital flows into Technology Equities All-Time
Jan 2018: $2.4B
May 2018: $2.2B
Dec 2017: $1.9B
Nov 2017: $1.2B
Nov 2016: $1.0B
Jan 2012: $900m
EPFR data
While FAANGs Boom, the Rest of the Market is Left Behind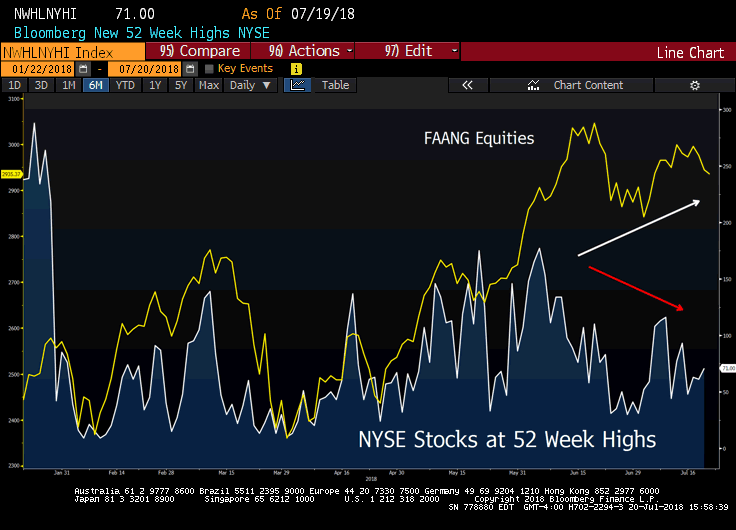 In early June, the number of NYSE stocks at their 52-week highs started to move sharply lower, breaking the trend (see above) with the price of the FAANGs equities (Facebook, Apple, Amazon, Netflix, and Google). Since January, while Netflix and Amazon have gone up 67% and 38% respectively, while the number of NYSE stocks at their 52-week highs has declined from 341 to 177 in June – to now just 71! Bottom line, the divergence between the few (just 5 stocks) FAANG equities, and all the rest of the market presents a crystal clear example of negative breadth. This growing disparity in the markets extends to real economic terms as well.
Profits in the Hands of the Few
According to an analysis conducted by the Wall St. Journal, in 1978 the percentage of profits coming from America’s 100 largest companies was near 46%, today we’re approaching 85%! The inequality decade has some very ugly side effects, doesn’t she? The clock is ticking here, G10 countries have VERY large aging populations. Indeed there are some bills to pay. In the U.S., Medicare will run out of money far sooner than most expected, and Social Security’s financial problems can’t be ignored either. This month, the U.S. government said in a sobering checkup on programs vital to the middle class – Medicare’s available cash is dwindling at an alarming rate. Per the LA Times, the report from the program trustees says Medicare will become insolvent in 2026 — three years earlier than previously forecast. Its giant trust fund for inpatient care won’t be able to fully cover projected medical bills starting at that point. As populism continues to march forward, we expect the FAANGs to have a VERY large target on their back in the months and years to come. Somebody has to pay for these mathematically unsustainable promises made by politicians, and we’re looking at you FAANGs.
Is that Your Fair Share Amazon?
Even with the dire straights of U.S. unfunded liabilities (Medicare, Medicaid, Social Security), only 12.9% of Amazon’s profits went to federal, state, local and foreign taxes from 2007 through 2015, per S&P Global Market Intelligence. In ugly fashion, that’s half the average amount S&P 500 companies paid over the same period. Look for populism’s surge to take a large bite out of Amazon in the near future.
Don’t miss our next trade idea. Get on the Bear Traps Report Today, click here
Jumping into Bed with a Greater Fool
At the very end of the day, an investment in FAANG equities today involves jumping into bed with the greater fool theory. Sure, there’s always late cycle dumb money pushing prices higher, but 2018’s toxic ingredients have come together and forged an atrocious risk-reward in these overstuffed equities.
Wall St.’s Research, a Lesson in Crowded Trades
General George S. Patton once said, “if everyone is thinking alike, then SOMEONE isn’t thinking.” Wall St.’s “brain trusts” have 182 buys on FAANG equities and just 7 sells, this gives a colossal failure of common sense new meaning. Highly reminiscent of the late 1990s indeed.
Wall St.’s Change in 12 Month Price Target in 2018*
January vs. Today
Facebook $FB: $210 v $228
Amazon $AMZN: $1305 v $1930
Apple $AAPL: $189 v $199
Netflix $NFLX: $212 v $371
Goole $GOOGL: $1180 v $1270
*Consensus of over 35 analysts, Bloomberg data. One of the biggest problems with Wall St. equity research is found in their favorite past time, performance chasing. In terms of job security, they believe there is safety in numbers. As a result, the sheep move in lockstep together. Analysts tend to move up their price targets as the bull market picks up steam. At the end of the day, often times the little guy is left holding the bag as price targets rise, and rise again. More and more of the crowd gets sucked in at higher prices. There’s little focus on risk-reward at nosebleed price levels.
Wall St., A Love Affair with the Few
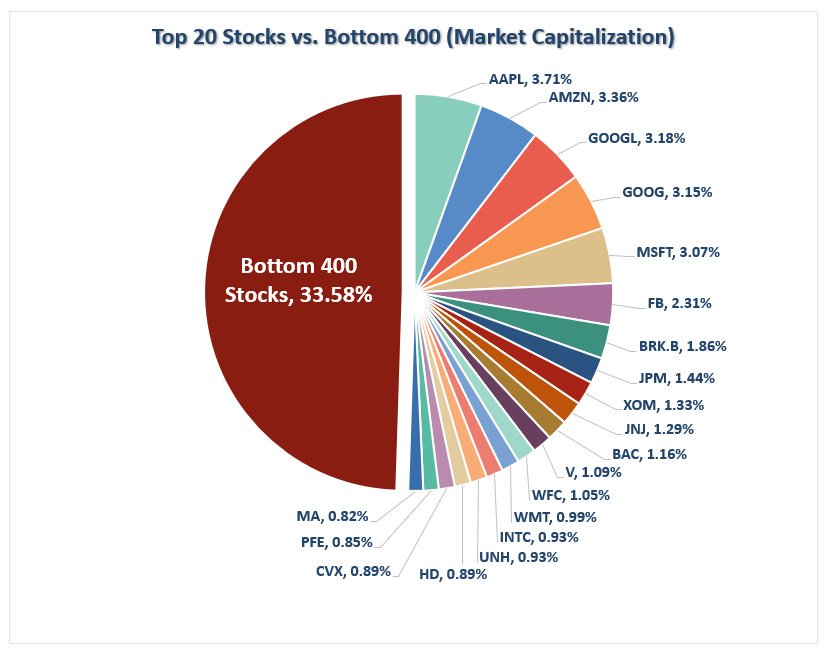
“The market cap of the five biggest stocks in the S&P 500 is now almost exactly equal to the market cap of the smallest 282 S&P 500 companies. Both come to just under $5.1tn. Today’s chart of the day shows that a six-member FAANMG sector (FAANGs + Microsoft) would at this point be comfortably bigger than any of the 11 economic sectors into which the S&P is divided.”
-Financial Times
Don’t miss our next trade idea. Get on the Bear Traps Report Today, click here
FAANGs Crushing the Rest of the S&P 500
This speaks to fleeting market leadership and above all, a very unattractive risk/reward facing investors today. We’re talking about an indicator of market health here and for right now, even with all the glorious headlines, we’re looking at a sick patient.
In our view, the FAANG stocks are massively overvalued and thus ripe for a massive roll-over. before year-end in our view. Even a relatively minor downturn in the market as a whole could wreak havoc on the FAANGs. And as stated earlier, the disproportionally high number of equities declining in price is hidden by the FAANGs. What’s worse is that such a rollover would have massive implications for some of the market’s largest asset management firms.
Inflows of into Passive Management Funds and ETFs (Exchange-traded-funds)
There are 605 ETFs which hold FAANG equities as a top 15% position in the fund!!!! This has to be the most crowded trade in the history of financial markets – just five stocks make up most of the ETF universe, lookout!
ETF Ownership of FAANG Equities
2018: 605
2017: 501
2016: 430
2015: 332
2014: 277
2013; 230
2012: 175
2011: 101
2010: 62
2009: 14
2008: 9
Just five stocks as a top 15 holding in 605 ETFs, think about that… ETFDB data
 Around 20 years ago, nearly all of asset management was active. Fund managers would buy and sell equities using personal judgment and research. In the last five years, trillions have flown into passive management, where managers place funds into market-cap-weighted ETFs and indices in an attempt to capture the momentum of the market, without doing research. While equally-weighted indices own all stock equally, market cap weighted-funds are more heavily weighted to larger-cap stocks (S&P (passive) Index Funds, for instance, are heavily weighted to FAANG stocks. A closer look shows; 3.8% Apple, 3.1% Amazon, 3.1% Google A 3%, Google C 3%, 2% Facebook and nearly 1% Netflix. That’s 16% of the index in just five stocks). Thus, the rise in passive management has made FAANG stocks more dislocated from reality, as passively-managed funds are disproportionately forced to own them. Thus, the explosion of capital into passive funds has been forcing more and more capital into fewer and fewer stocks. This will end in tears – SELL Mortimer SELL!
State Street 91m shares
Don’t miss our next trade idea. Get on the Bear Traps Report Today, click here

