
Join our Larry McDonald on CNBC’s Trading Nation, Wednesday at 3:05pm ET
Pick up our latest report here:
Don’t miss our next trade idea. Get on the Bear Traps Report Today, click here
“With some help from Tariffs and trade war threats, the for the second time since 2015, the Fed blew up the global economy and central bankers around the world are begging for a softer U.S. Dollar policy path. The world’s economy is dysfunctionally out of balance. With a colossal $62T of GDP outside the USA and $18T inside, the Fed cannot conduct monetary policy in a traditional sense. They’re much more of the world’s central bank and June’s meeting will accentuate that point. Their policy actions simply have far too much impact on the rest of the planet. As a result, economists who are myopically focused on U.S. economic fortunes keep embarrassing themselves. At this point, a stronger Dollar will only force the Fed into even more future rate cuts. Stay long gold, emerging markets and underweight US equities.”
Bear Traps Report, June 15, 2019
On Wednesday, the Federal Reserve met and announced they would maintain the current Federal Funds Rate of 2.25-2.5%. This came despite some market expectations that the Fed would cut in June due to weakening global economic data, ongoing trade uncertainty, and dovishness from central banks abroad. Above all, the Fed delivered on the outlook side of the equation. The FOMC dramatically changed its forecast for the future of the Fed policy path, opening the door to interest rate cuts in July, September and even December. With the 2020 election around the corner, the White House needs a lower dollar, and luckily for President Trump, the global economy needs a weak dollar more than he does.
Winners with US Dollar Heading South
Since Late May
Gold Miners $GDX +25%
Silver Miners $SIL +21%
Copper and Steel Miners $XME +17%
Oil $USO +12%
China Internet $KWEB +11%
Emerging Markets $EEM +9%
Oil Production $XLE +8%
S&P 500 $SPY +7%
Financials $XLF +5%
Bloomberg data
US Manufacturing Crushed by the Strong US Dollar
 There are a thousand words in this chart. As we witnessed in 2015-16, a strong US dollar hammered the US manufacturing sector and jobs were put at risk. Today, US Manufacturing PMI is essentially in recession territory (a reading below 50 signals recession). A strong US dollar has made exports far more expensive, especially in Europe with their central bank – the ECB – in currency manipulation mode for much of the last 3 years.
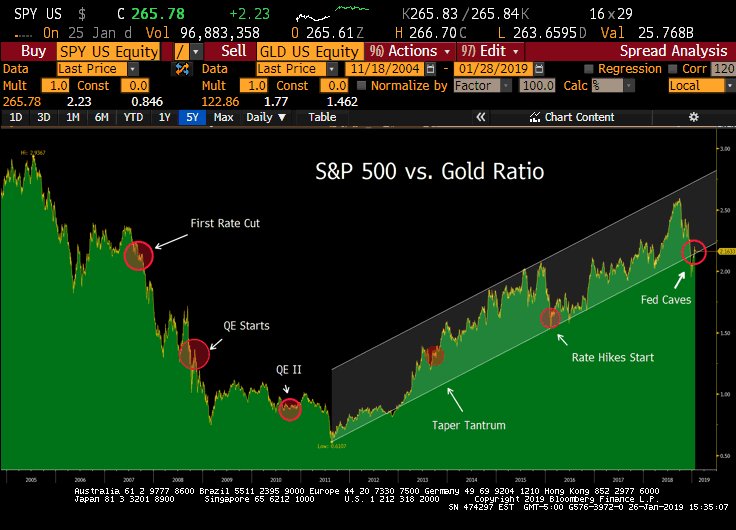
S&P Rose on Fed Cave
Despite the lack of a material change in the fed funds rate, the market reacted positively to the announcement, with the S&P 500 climbing just over 1% from when the news broke at 2:00 pm to the next day’s open. Chairman Jerome Powell took a relatively dovish tone during his post-meeting Press Conference commentary, in which he acknowledged “moderating” job growth, slowing business investment, as well as inflation beginning to detach from the 2% target. Additionally, the Fed “dot plot”, which illustrates board members’ future interest rate expectations, was revised in a dovish direction, though views are still mixed.
US Dollar, a Trend Break with Colossal Implications
 Goodnight Irene, the US Dollar has broken its uptrend which started in January of 2018. This is the beginning of a meaningful leg lower. The Fed has laid a beating on the global economy with eight rate hikes and $666B balance sheet reduction, all since 2016. That’s a colossal amount of tightening compared with the rest of the world. As they unwind this experiment, the greenback is in big trouble. We believe the Dollar is putting in its top, stuck in a dynamic where it’s a victim of its own success. If the Dollar breaks out to new highs, it will find itself in a tricky balance — more global economic destruction and an even greater need to cut rates. A significant weight on the Fed in its recent meetings has been the powerful force in their embarrassing U-turn — the slowdown in global growth and the negative feedback loop back to the U.S. In recent years while the Fed was in crack smoking mode — trying to hike rates and reduce its balance sheet by trillions at the same time — trillions of Dollars ($6T to $7T in our estimates) were sucked back to the United States and the emerging market’s economic engine was the big loser. This giant ocean of capital is about to change direction and Dollars will be pouring out of the U.S.
Fed Couldn’t Stay Stubborn in Face of Global Resistance
With some help from tariffs and trade war threats, the Fed blew up the global economy for the second time since 2015 with its hike late last year. Central bankers around the world are begging for a softer U.S. Dollar policy path. With a colossal $62T of GDP outside the U.S. and $18T inside, the Fed cannot conduct monetary policy in a traditional sense and must accommodate the rest of the globe.
China touts a $13T economy and we hear the Yuan is destined to overthrow the Dollar’s reserve currency status with a mediocre 2% of SWIFT payments now being settled in CNY? What’s the problem with the U.S. Dollar the being the world’s reserve currency anyway? Foreign nations rely heavily on U.S. Dollars for all types of international trade. For instance, if Brazil sells soybeans to Australia, the country “Down Under” will most likely pay Brazil in U.S. Dollars. Because of the reliance on Dollars for trade, Brazil, Australia, and almost every other nation holds loads of Dollar reserves. Most foreign war chests are held in U.S. Treasuries, the world’s safe haven. As global trade has grown over the years, the need for Dollar savings has grown in step and has resulted in more lending to the U.S. Treasury by foreign governments. There are several reasons why a strong U.S. Dollar has evolved into a global economic wrecking ball, and this is one of them.
Pick up our latest report here:
Don’t miss our next trade idea. Get on the Bear Traps Report Today, click here
Even the Market (Futures) was High Kites
Since September, Fed Funds futures have seen a dramatic shift lower. March 2021 futures have gone from pricing in 1 rate hike to nearly 4 rate cuts. Despite this, until this week’s meeting, the Fed was quite resolute in trying to set up hikes in 2020 and beyond. This is all off the table now, the previous dots were way out of tune and reality has now set in.
Dovish Dot Revision Show Massive Walk-back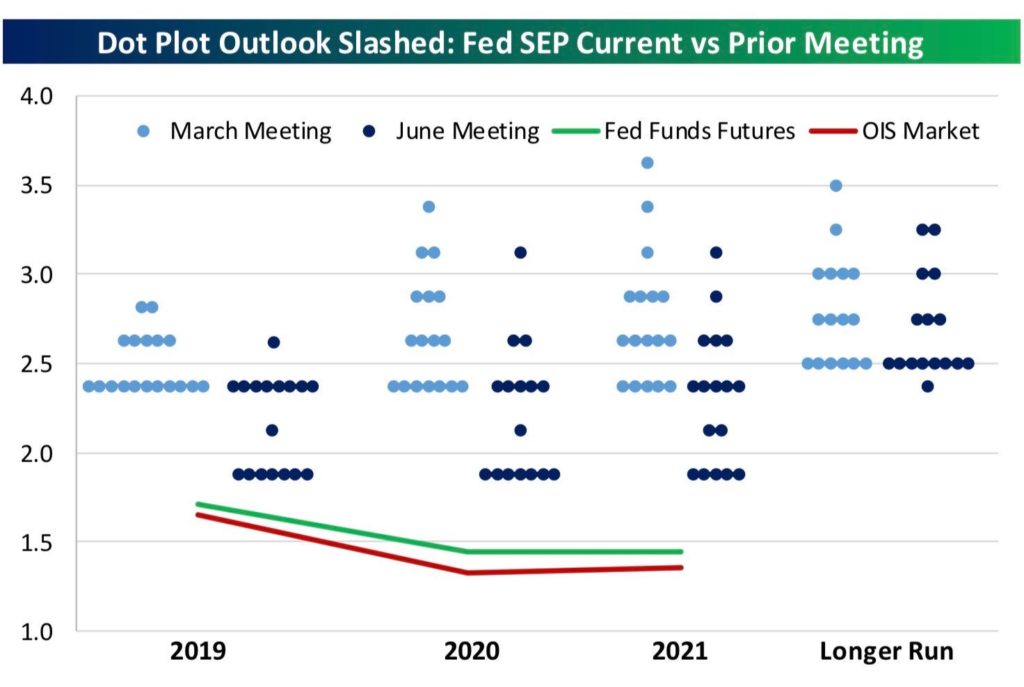 Nine members see no rate cuts this year, eight do (of which seven see two cuts). The committee changed language from its May statement and took out the 2020 rate hike.
Weaker Dollar Leading to Rotation into Metals and EM
Right now, the market is pricing in a 100% chance of a 25 basis point cut in July and about a 60% chance of a 50 bps cut. As the Fed cuts, the Dollar loses value, and these black clouds of USD weakness are already pushing investors into assets like Gold, Silver, and Emerging Markets (EM). On Thursday, global markets saw a strong reaction, Gold, Silver, and Emerging Markets all soared higher, outperforming the S&P 500. In our view, as rate cuts move from the realm of expectations to reality, these markets will only continue to rally.
Pick up our latest report here:
Don’t miss our next trade idea. Get on the Bear Traps Report Today, click here
Gold Spiked on Powell Commentary and New Dots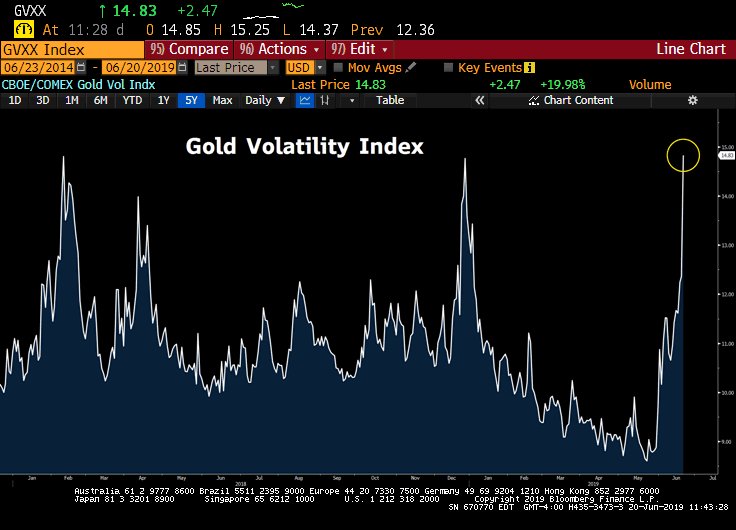 The Fed’s cave led to the largest one-day volatility spike in Gold since Feb 11th, 2016. That day gold closed up 4%, consolidated its move over 2 days then continued its uptrend to a top 4 months later.
U.S. Vulnerable to Foreign Capital Flight
In our view, over the last decade, the U.S. outperformance versus the rest of the world, both in equity markets and in terms of being further along the rate normalization path, led to a flood of foreign capital into the country. However, dovish Fed expectations are causing some of this foreign investment to trickle out. If U.S. growth weakens and equity P/E multiples contract, foreign portfolio flows are going to get uncomfortable and rapidly repatriate capital. A colossal flood out of the Dollar is on our doorstep.
Pick up our latest report here:
Don’t miss our next trade idea. Get on the Bear Traps Report Today, click here
 Over the last few weeks, we’ve seen a divergence between Consumer Staples (XLP) equities and the FAANGs (FANG). This indicates that money is pouring into defensive stocks as investors sense trouble brewing.
 FAANG stocks had their ninth-worst intraday loss ever on the back of last Monday’s antitrust news (when aggregating their market capitalizations). Facebook was down 7% on the day, while Amazon and Google were down 4.5 and 6%, respectively. Google also broke a four-year trend channel to the downside – look out below. As the political tug of war escalates, we will likely see more announcements from regulators and more shocks to the FAANGs
 Today, the crowding in US Dollar assets is the antithesis of the emerging market lovefest circa 2006-7. Prior to the Great Financial Crisis, investors were flooding into emerging markets as US data began to deteriorate, leading EM being perceived as a safe-haven. “They’re building 100 Chicago’s in China don’t you know?” The consensus view was emerging markets had ‘decoupled’ from the US. EM bulls touted that neither Bear Stearns’ collapse nor the struggling and over-levered Lehman Brothers mattered — emerging markets were the ‘safe place’. High kites indeed, last 10 years the S&P is up 267% vs. the iShares China Large-Cap ETF’s paltry 31% for the on a total return basis. However, once the US-born recession washed-over on emerging market shores, the flood of foreign capital rushing back into the US Dollar was colossal. In our view, the opposite dynamic is playing out today. A global trade triggered slowdown is causing investors to hide out in US assets (S&P 500, Treasuries, USD). We believe a capital flood out of the US is on our doorstep.
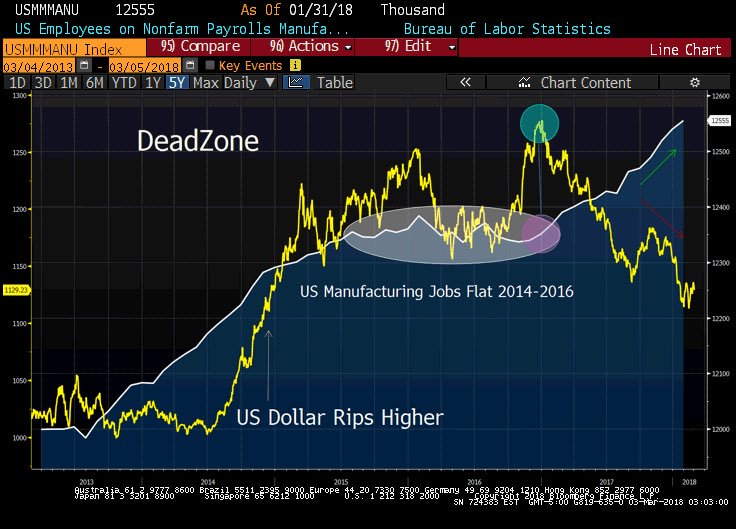 Heading into the 2020 election, there are few things Treasury Secretary Steven Mnuchin, OMB Director Mick Mulvaney, and of course President Donald Trump want more than a weaker Dollar. It’s probably not too much of a stretch to say that the Dollar’s 2014-2016 surge delivered Michigan, Wisconsin, and Pennsylvania to Trump on the back of undermined manufacturing and exports (see above, DeadZone). The President clearly knows this and it’s part of the reason for his regular tweets and comments lamenting Powell’s interest rate hikes. USD bulls — beware!
 In early June, the number of NYSE stocks at their 52-week highs started to move sharply lower, breaking the trend (see above) with the price of the FAANGs equities (Facebook, Apple, Amazon, Netflix, and Google). Since January, while Netflix and Amazon have gone up 67% and 38% respectively, while the number of NYSE stocks at their 52-week highs has declined from 341 to 177 in June – to now just 71! Bottom line, the divergence between the few (just 5 stocks) FAANG equities, and all the rest of the market presents a crystal clear example of negative breadth. This growing disparity in the markets extends to real economic terms as well.
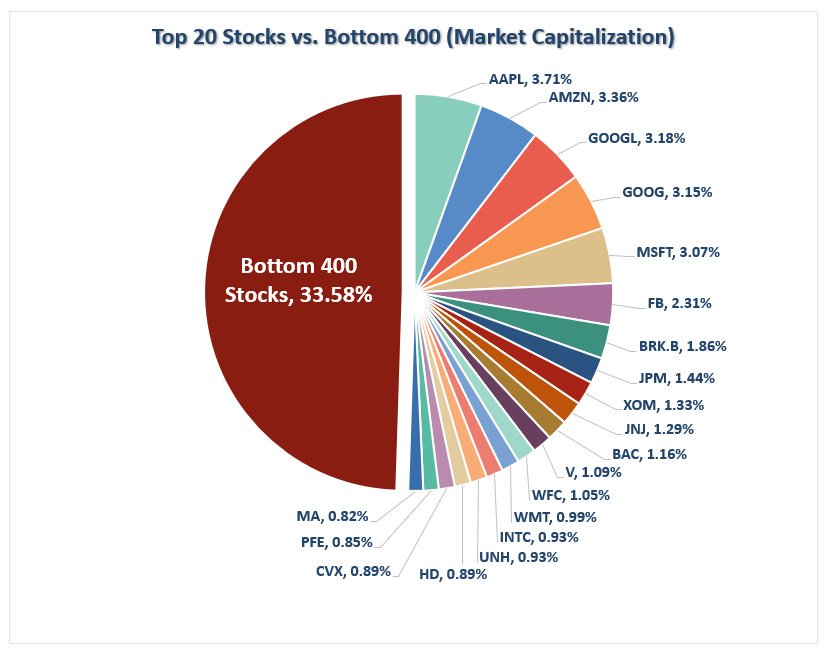 Around 20 years ago, nearly all of asset management was active. Fund managers would buy and sell equities using personal judgment and research. In the last five years, trillions have flown into passive management, where managers place funds into market-cap-weighted ETFs and indices in an attempt to capture the momentum of the market, without doing research. While equally-weighted indices own all stock equally, market cap weighted-funds are more heavily weighted to larger-cap stocks (S&P (passive) Index Funds, for instance, are heavily weighted to FAANG stocks. A closer look shows; 3.8% Apple, 3.1% Amazon, 3.1% Google A 3%, Google C 3%, 2% Facebook and nearly 1% Netflix. That’s 16% of the index in just five stocks). Thus, the rise in passive management has made FAANG stocks more dislocated from reality, as passively-managed funds are disproportionately forced to own them. Thus, the explosion of capital into passive funds has been forcing more and more capital into fewer and fewer stocks. This will end in tears – SELL Mortimer SELL!
 Net shorts are piling in, bets against Sterling on the rise.
 We take a negative view on the GBP and UK Equity for the next six months. The Pound (GBP) has taken a significant hit recently on the back of uncertainty regarding the status of negotiations on the EU-UK post-Brexit agreement. The increased risk of a domestic government meltdown and a May exit will only serve to further compound this bearish trend.
