
Join our Larry McDonald on CNBC’s Trading Nation, Wednesday at 3:05pm ET.
Pick up our latest report here:
Don’t miss our next trade idea. Get on the Bear Traps Report Today, click here
Looking back over the last decade, stocks have only been this much loved four times. After the last dance with extreme euphoria in January, stocks lost 11.3% from January 26th to February 12th.
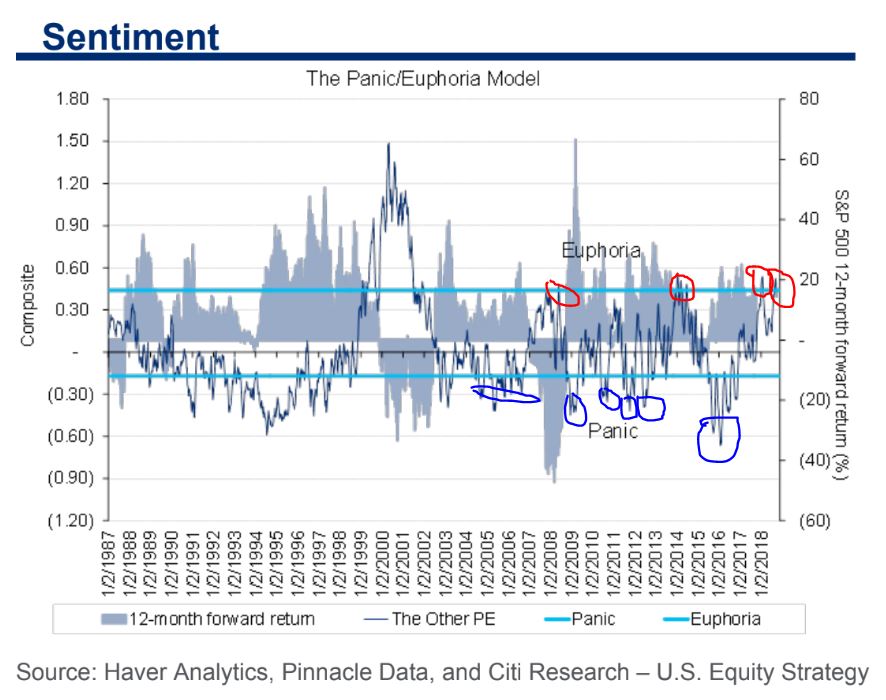
Likewise, just before 2015-2016’s 14% equity market drawdown, investors were feeling so confident looking out into the future. Today, our sentiment indicators are screaming red. Over the last decade, those buying into market panics and selling euphoria were handsomely rewarded. Pick up our latest report here.
Cash as a % of Client Assets, Brokerage Accounts vs. S&P 500
2018: 10.3% vs. 2913
2017: 11.7% vs. 2511
2016: 14.1% vs. 1810
2015: 12.3% vs. 2120
2014: 13.5% vs. 1975
2013: 14.9% vs. 1555
2012: 18.2% vs. 1292
2011: 19.1% vs. 1322
2010: 23.3% vs. 1031
2009: 25.4% vs. 667
2008: 12.5% vs. 969
2007: 10.3% vs. 1546
Charles Schwab, Bloomberg
Another classic sign of hubris oozing through investor confidence is found in small cash holders. As more late coming join the party, cash stockpiles come down substantially.
KBW Regional Bank Index in Correction
 As the Fed continues their quest for higher rates, something happened on the way to the next rate hike. – regional bank shares entered a “correction” this week. The BKX Index above is 10.6% off it’s January highs and flat since late November. BB&T Corp, M&T Bank, and PNC Financial topped out in late-February and are now under “death cross” formations.
Builders and Rates
 With mortgage rates at 84-month highs, the ITB iShares U.S. Home Construction ETF is 24% off its highs, in a deep bear market. At the same time, global oil prices have surged from $26 to $80 a barrel since 2016. Oil’s plunge created a massive $1.8T or 2.2% of global GDP income transfer between oil consumers and oil producers between 2014 and 2016, NOW that’s being reversed with major implications. Consumers globally are dealing with higher bond yields, higher oil prices and in many cases MUCH weaker local currencies in emerging markets. The global consumption DRAG is something we have NOT seen since at least 2008.
China PMI Drag, Tariff Impact
 The trade war impact on China’s economy is now coming into focus. The official and Caixin manufacturing PMIs both are in plunge mode, missing expectations in September. The latter falling to 50 — the threshold separating improving and deteriorating conditions, Bloomberg reported. The declines were broad-based across major components. Most notably, new export orders registered sharp drops, signaling the crunch from U.S. tariffs on $50 billion in Chinese goods over July and August, followed by another $200 billion in late September. The non-manufacturing sector was among a few bright spots. The private survey showed growth in the factory sector stalled after 15 months of expansion, with export orders falling the fastest in over two years, while an official survey confirmed a further manufacturing weakening. Taken together, the business activity gauges – the first major readings on China’s economy for September – confirm consensus views that the world’s second-largest economy is continuing to cool, which is likely to prompt Chinese policymakers to roll out more growth-support measures in coming months.

