
Institutional investors can join our live chat on Bloomberg, a groundbreaking venue, just email tatiana@thebeartrapsreport.com – Thank you.
Lawrence McDonald is the New York Times Bestselling Author of “A Colossal Failure of Common Sense” – The Lehman Brothers Inside Story – one of the best-selling business books in the world, now published in 12 languages – ranked a top 20 all-time at the CFA Institute.
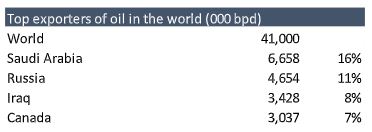
Putin has isolated himself and Russia, but worst of all – the modern tenets – the internal plumbing of the entire Russian oil production ecosystem are facing meaningful decay. One of our planet’s largest oil and gas producers is facing a colossal impairment. Oil exports from Russia are permanently challenged. Without foreign technology (the recently announced BP – Gazprom divorce). It´s a massive brain drain. Russian oil production will degrade over time. Even worse, we are told the all-important Turkish Straits are at risk of closure to certain vessels as Russian naval activity in the region has made transport of crude extremely expensive to insure. This would essentially land lock 1.3MBD out of Novorossiysk. We are now in record industry draws – demand, even without the Ukraine invasion.
“A deal to limit Iran’s nuclear program would lead to sanctions on its oil sector being lifted but it could take several months for any more Iranian crude to flow, and even then it may only offer short-term respite to tight oil markets.” Reuters.
If Iran oil production comes back online, the problem is – right now Libya and Iraq have their own oil production issues. These challenges more than offset the return of daily Iranian production. The only way to curb demand is by price, a very high price. Assuming demand destruction is at $150, that implies a possible move to $200. Markets overshoot.
Oil Volatility Explosion
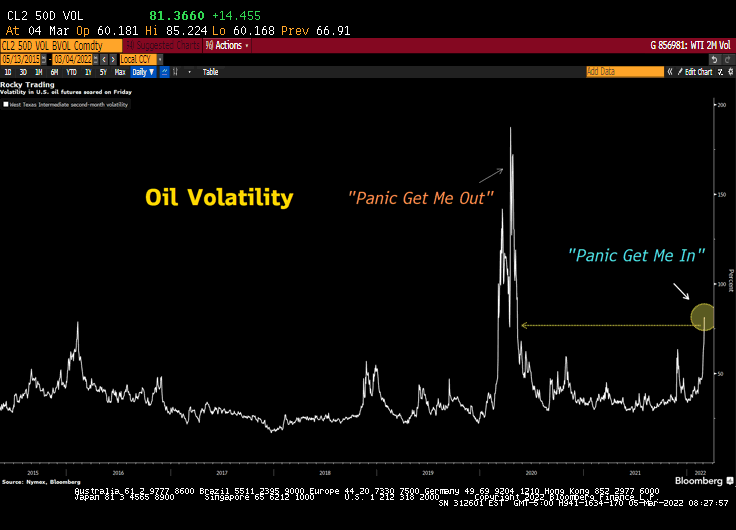 Oil was declared “uninvestable” by the Wall St. Research community in Q2 2020, and today they are jumping over the seats to try and get involved. Under Investment comes with a price – $2.2T has come out of the oil, gas, coal, and metals 2014-2020 investment trajectory (CAPEX) while the global population has grown by another 700m. In other words, the previous addiction to capital investment came crashing down in recent years as the ESG – Green revolution took hold.
The Lessons from 2020
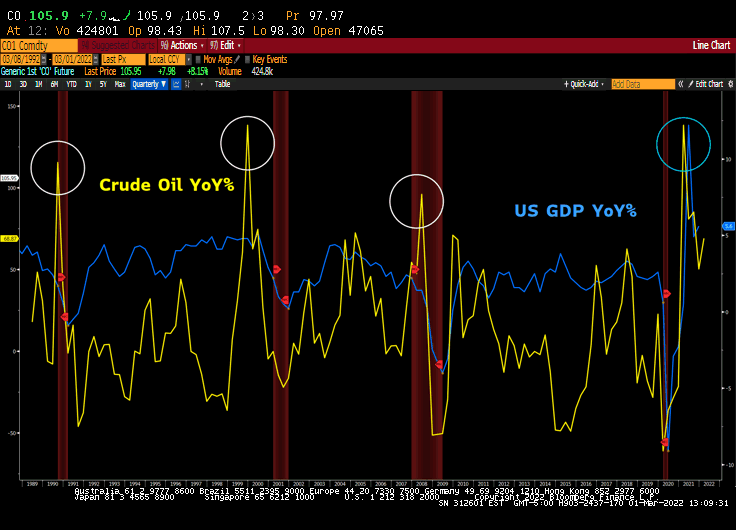
We must remember the negative price of oil in Q1 2020 – the lessons – the oil market is no exception and can overshoot. Rampant inflation is nigh. Will the Fed slam on the brakes? Maybe, but Powell isn’t Volcker and even Volcker didn’t slam on the brakes until he had hard data that unemployment was headed south. The last unemployment statistic of 3.8% means we aren’t at the point where the Fed will hike Fed Funds high enough to stop inflation. Even now, markets aren’t pricing in the odds of $200 oil. We see 77% implied volatility at the front end of the curve means that trading spot crude oil is difficult to do. The back end of oil is attractive given the amazing backwardation we are witnessing. The oil itself is the best hedge. The second-best hedge is oil service companies – we have been long OIH ETF names for clients for over a year. The third best hedge is oil producers.
Bear Traps Report from Jan 26, 2022
What if the Unthinkable Happens?
What if Russia invades Ukraine and Europe and the U.S. kick Russian banks off SWIFT and imposes other debilitating restrictions on the Russian banking system? This would severely restrict Russia from selling oil and other essential commodities in the international markets. Without an emergency supply response by OPEC, oil could surge beyond $150 per barrel. Other commodities are vulnerable too.
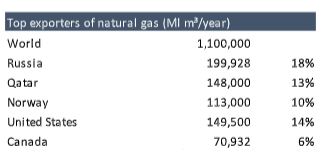
Russia is now by far the largest supplier of natural gas to Europe. It is also the world’s largest supplier of palladium and the 2 nd largest producer of cobalt (EVs). A surging oil price has caused almost every
recession in the US since 1945. Global growth could be reduced by 75% this year if oil jumps to $135 per
barrel.
In this note, we will discuss this what-if scenario and recommend strategies to prepare for such an outcome. We don’t say this often, but we hope that we are wrong; that this scenario can be avoided, and that our strategies fail.
Where is the Trade?
Should Russia invade Ukraine we can expect oil to initially react strongly to the risk of supply shortages. Since the reaction is in the front of the curve, the USO ETF will be more reactive than stocks of oil producers. OPEC would likely respond quickly by maximizing its oil production to balance the market. Such a response may set a top in the price of oil, but it would still pose a serious risk to U.S. and global growth. Besides oil, we see natural gas and palladium as commodities with upside risk in such a scenario. Russia is responsible for 45% of EU imports of natural gas and Russia dominates palladium mining. In a worst-case scenario, the EU would face significant gas shortages and would rely on more U.S. LNG shipments. If Russia is restricted in the supply of palladium, South African palladium miners such as Anglo-American Platinum and Sibanye-Stillwater are poised to benefit.
***Bear Traps Report from Jan 26, 2022.
Oil and Conflicts
Authorities in the U.S. and Europe have warned for weeks about a large Russian troop buildup at the Ukrainian border near the
Donbass region. More recently policymakers have also signaled large Russian troop movements into Belarus to encircle the northern border of the Ukraine. The U.S. and Europe have threatened Russia that if it invades the Ukraine, they will respond with draconian measures. One of those could be to remove
Russia from SWIFT (Society for Worldwide Interbank Financial Telecommunication) and to put debilitating sanctions on its banks. SWIFT is like the central nervous system of international financial
transactions. Their platform facilitates the smooth flow of funds across borders. Kicking Russia off SWIFT and sanctioning dollar transactions by Russian banks may severely limited Russia’s ability to export its commodities into the global markets.
The U.S. kicked Iran off SWIFT in 2018 after Trump pulled the U.S. out of the Iran deal. By doing so, it prevented international oil shippers from being able to insure their oil cargos to and from Iran. It also made it nearly impossible for oil trading firms to deliver payment to any Iranian banks to buy its oil. As a result, Iran oil exports dropped from 2.4ml to 350K barrels per day in a matter of months. The U.S. offset this loss by increasing shale oil production by 3ml barrels p/d that year.
***Bear Traps Report from Jan 26, 2022.
Russia’s expanding grip on Ukraine
In 2014 Russia supported an armed rebellion of pro-Russian separatists who wanted to form two independent republics in the Donbass. These actions followed Russia’s annexation of Crimea in February of 2014. A war broke out in Ukraine in April of that year and fighting continued into 2015.
In February of 2015 a peace deal was struck between Russia and the Ukraine (Minsk accord) but despite this, the area remains a war zone, with dozens of soldiers and civilians killed each month. During the war the U.S. and Europe imposed sanctions on Russian individuals, organizations and businesses but didn’t go as far as sanctioning Russia’s ability to export commodities.
Early in 2021 Russia began a troop buildup again on the Ukrainian border. This to deter further NATO support for Ukraine. Several events during the summer and fall motivated Putin to further buildup troop levels around the Ukraine. Russia has now deployed approximately 32% of its military’s battalion tactical groups near Ukraine, a figure the U.S. intelligence community reportedly believes could rise to 60%.
Russian and Belarusian officials also announced that their forces will take part in a joint exercise that will last until February 20 including the deployment of a fighter squadrons and air defense battalions. In
short, Russia is setting the conditions where it could conduct a significant military escalation on short notice and with little warning.
***Bear Traps Report from Jan 26, 2022.
Don’t miss our next trade idea. Get on the Bear Traps Report Today, click hereInstitutional investors can join our live chat on Bloomberg, a groundbreaking venue, just email tatiana@thebeartrapsreport.com – Thank you.
Lawrence McDonald is the New York Times Bestselling Author of “A Colossal Failure of Common Sense” – The Lehman Brothers Inside Story – one of the best-selling business books in the world, now published in 12 languages – ranked a top 20 all-time at the CFA Institute.
Harder to avoid War
Russian officials have committed themselves to a strong response unless they receive concessions. If it does not achieve some of their stated goals, Moscow will suffer a cost to its credibility if it does not
escalate.
Europe and the U.S. have repeatedly threatened to slap unprecedented sanctions on Russia if it were to invade Ukraine. Biden last month warned Putin that if he were to attack Ukraine, the U.S. and its allies would impose sanctions on Russia – “like none he had ever seen.” Press Secretary Psaki last week said that “stopping Nord Stream 2 pipeline is a credible piece we hold over Russia” and that “No option is off the table with regard to removing Russia from SWIFT financial system”. This week the Wall Street Journal
reported that the Pentagon places hundreds of troops on standby for deployment to Eastern Europe.
So, both Russia and the U.S./Europe have placed themselves in a position whereby backtracking from threats would cause severe credibility risk. Putin is playing power politics with several neighboring countries (Turkey, Moldova, Georgia, Kazakhstan, China) and cannot afford to look weak. The U.S. after
the Afghanistan debacle can ill afford another international humiliation. That’s why the path of least resistance increasingly looks like Russia has no choice but to invade and the U.S. will be unable to back down from severe sanctions.
***Bear Traps Report from Jan 26, 2022.
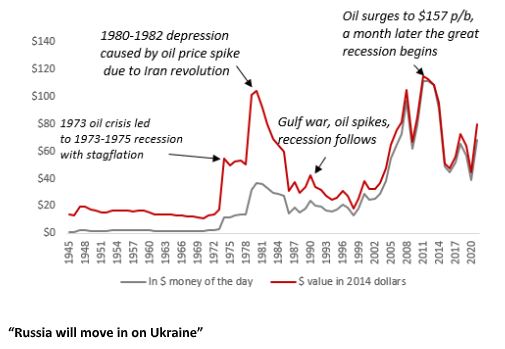
Oil and Recessions
Oil has played a vital role in almost all major U.S. recessions since World War II, which is when oil became the prime source of energy for the U.S. and global economy. U.S. GDP declined by 3.2% from
1973 until 1975, following the 1973 oil crisis. The oil price quadrupled as OPEC threatened to stop supplying oil to the U.S. in retaliation for its support for Israel in the Yom Kippur war. This combination of surging prices of oil and a declining economy is now known as the period of stagflation. In 1979, the Shah of Iran was deposed in the Iranian revolution. Once again oil prices soared, and the U.S. entered a double-dip recession (1980 and 1981-1982) as the Federal Reserve raised the Fed funds rate to 20% to eradicate runaway inflation. In aggregate, the U.S. economy declined by 4.9% during this period. In 1990 oil prices briefly surged as Iraq invaded Kuwait and international forces, led by the U.S., started the Gulf War to remove Iraq from Kuwait. A brief recession followed, whereby the U.S. economy contracted 1.4%. The root cause of the great recession of 2008 was the debt-fueled housing boom. But a vital straw that broke the economy’s back was the surge in oil prices in H1 of 2008 when oil rallied from $95 in the beginning of that year to $147 a barrel by early July. The rally in oil (and other commodities) was partially related to Chinese buying ahead of the 2008 summer Olympics and the weakening of the US dollar driven by the divergence of Chinese and U.S. economic growth. Either way, the already fragile U.S. economy went into a deep recession shortly after, which reduced GDP by over 5%.
***Bear Traps Report from Jan 26, 2022.
If oil prices quickly surge to $135 in reaction to the inability of Russia to export its oil, global growth could see a 75% haircut this year from 4% to 0.9%. Given that oil is the single biggest driver of headline CPI inflation, the Fed may be forced to react late to such an abrupt slowdown. Headline inflation could double in a $150 p/b oil scenario. Of course, when enough economic data show the economy is sharply slowing down and financial conditions deteriorate enough, the Fed will likely reverse course, but history tells us that it can then take months for the economy to recover.
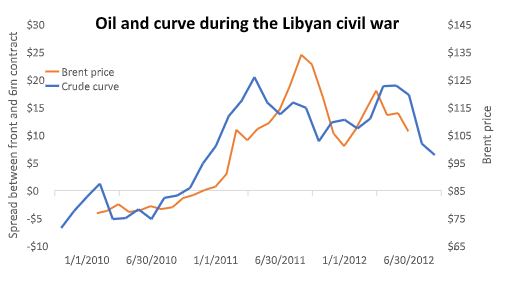
In February of 2011, a civil war caused Libyan oil production to collapse. The result was a shortfall of more than 1ml barrels of Libyan (primarily light, sweet) oil per day from February until May. A total of 59ml barrels of production were lost during that period. The Libya example is useful to gauge a market reaction in case of a sudden production shortfall in a tight market. During the Libyan civil war Brent rose from $100 to $125 per barrel. And the Brent curve backwardation blew out to $25 per barrel (=the spread between the front month and the 6 month future).
Where can oil go in case of a Ukrainian invasion?
When the U.S. revoked the Iran deal and slapped draconian restrictions on its banking system, the oil markets were adequately supplied. We know this because, despite the sanctions, the oil markets were oversupplied by about 1ml p/d all year. Most of the extra supply came from the surge in U.S. shale oil but Saudi Arabia also increased production by about 1ml bpd.
***Bear Traps Report from Jan 26, 2022.
Today the markets are tight, as demonstrated by the backwardation in the futures market, which means spot is trading at a premium to the futures. The market only does this if it wants to draw barrels out of inventory because the spot market needs those barrels now. In 2011 the market became extremely tight when production seized during the Libyan civil war. A total of 59 ml barrels of production were lost during that civil war. As a result, the spread between the front and the 6-month contract blew out to as much as $25 and oil went from $100 to $125 per barrel.
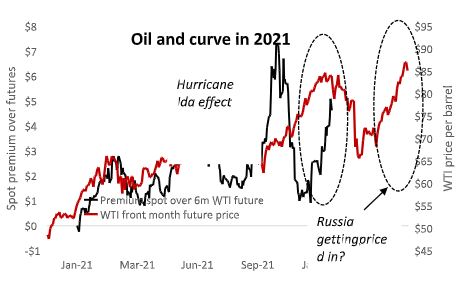
Since mid-December the curve has blown out by $4 and oil has increased by $12 per barrel. We like to assume that that is primarily due to the Ukraine risk. After hurricane Ida last summer, the WTI curve spread blew out $3 as the hurricane knocked a total of 24ml off production and oil rose $15 per barrel in subsequent weeks. There is no way to quantify the total amount of barrels lost in case of sanctions on Russian exports as they can go on indefinitely. OPEC (ex Iran) has about 4ml spare capacity but may only be able to quickly increase production by 2ml barrels p/d (as we saw in April of 2020). Any additional production may take longer to come on-line.
To what extent has the market priced in a Ukrainian invasion by Russia? If we assume a loss of about 60ml barrels (see below) over a 5-month period, then the market currently prices the odds of a Russian invasion around 30%.
How many Barrels can disappear from the Market?
If we assume a 5-month timeframe to offset the loss of remaining Russian barrels, that would imply a total loss of about 50 to 60ml barrels. The price action in the curve and WTI since mid-December
suggests that the market may already price-in a 22ml shortfall. If Russia does invade Ukraine and subsequent sanctions prohibit the export of most of its oil, it means at a minimum another $15 on the front month to $100 per barrel. In case of a 4.5ml barrel shortfall (little to no OPEC/US production increase/SPR releases to offset Russian export ban), oil could rise another $50 per barrel to $135 per barrel.
What about other Commodities?
Russia is responsible for more than 45% of the natural gas that the EU imports. The decision by the Netherlands in 2015 to gradually phase out their natural gas production has only increased EU’s
dependence on Russian natural gas. It’s possible that Germany finds a way to circumvent sanctions and to continue to assure Russian gas supplies. If Russia is no longer able to supply natural gas to the EU
market, a shortage of natural gas would be inevitable and electricity prices will become prohibitively expensive. More gas will probably be shipped from Qatar and the U.S. to offset Russian shortfalls.
Already the U.S. has become the largest exporter of LNG and exports to Europe reached 7ml tonnes in December, which is about 19% of EU demand. Provided the US has the capacity to expand LNG exports, domestic prices would likely increase as well. US.. LNG exports to Europe already represent 12% of total US dry natural gas production.
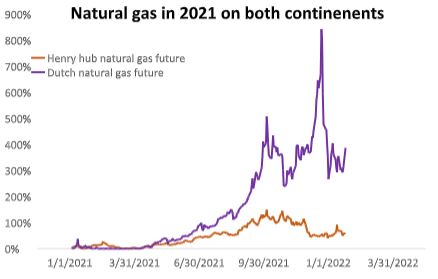
In 2021 the European natural gas market went parabolic in a perfect example of Murphy’s law; everything went wrong that could go wrong. Renewable energy dropped off due to a decline in wind power, French nuclear plants went offline due to maintenance, and Russia’s Nord Stream II pipeline, which should have come online last fall, was held up indefinitely (in part due to the situation in Ukraine). As a result, European gas prices went up as much as 800% in one year.
***Bear Traps Report from Jan 26, 2022.
U.S. natural gas prices did rally in the fall as more LNG shipments went to Europe, but a relatively mild winter has put a damper on U.S. gas since.
SBSW Sibanye Stillwater – A PGM Play
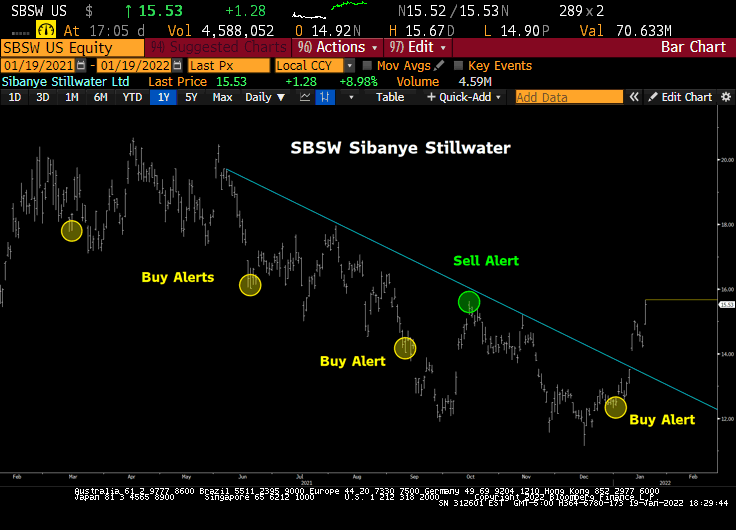 Sibanye Stillwater Limited provides metal mining services. The Company develops and extracts mineral properties. Sibanye Stillwater serves customers in the United States and South Africa. See client trade alert buys – full position.
Risk – Reward in Metals
Our focus is on SBSW Equity and palladium a market where Russia dominates global supplies. Russia is responsible for 41% of total palladium produced globally. In a worst-case scenario, Russia would be severely limited in exporting palladium and shortages would be the result. Non-Russian palladium miners could benefit as prices of palladium are likely to increase. If, and when, palladium becomes uneconomically expensive, producers could switch to platinum as well. While Russia mines platinum, South Africa is the world’s most dominant platinum miner. Once again Anglo-American Platinum is the dominant miner, followed by Impala Platinum.
Top ex-Russia Platinum Miners
Anglo platinum – 2ml oz per year
Impala platinum – 1.3ml oz
Sibanye-Stillwater – 1.08ml oz
Northam Platinum – 900K oz
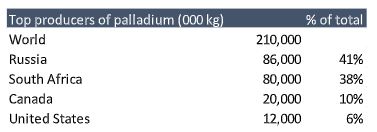
Russia is by far the largest producer of palladium in the world, responsible for more than 40% of global supplies. The largest use of palladium is in catalytic converters. Secondary uses for palladium are in jewelry, ceramic capacitors, hydrogen production, and storage. The irony is that palladium demand has been floundering due to the inability of the car industry to produce at capacity due to the semiconductor shortage. If palladium supplies become limited, it could further limit automotive production, thereby further inflating prices of new and used cars even more.
***Bear Traps Report from Jan 26, 2022.
Don’t miss our next trade idea. Get on the Bear Traps Report Today, click hereInstitutional investors can join our live chat on Bloomberg, a groundbreaking venue, just email tatiana@thebeartrapsreport.com – Thank you.
Lawrence McDonald is the New York Times Bestselling Author of “A Colossal Failure of Common Sense” – The Lehman Brothers Inside Story – one of the best-selling business books in the world, now published in 12 languages – ranked a top 20 all-time at the CFA Institute.

