
“Our indicators tell us, we’re very close to a Lehman-like drawdown,” argues Larry McDonald, a former strategist at Société Générale who now runs The Bear Traps report.
Financial Times, February 20, 2020
*Our institutional client flatform includes; financial advisors, family offices, RIAs, CTAs, hedge funds, mutual funds, and pension funds.
Email tatiana@thebeartrapsreport.com to get on our live Bloomberg chat over the terminal, institutional investors only please, it’s a real value add.
Don’t miss our next trade idea. Get on the Bear Traps Report Today, click hereTremors Before the Quake
At close to 7% off this month’s sky highs, U.S. equity market leadership found in Microsoft is fleeting. Trading at nearly 12x sales, MSFT investors have started to rotate out of big tech this week. The insanity of paying 12x sales for large-cap stocks speaks to the greater fool theory. You really need the next guy to come in and lift you out of your shares at an even higher price. At nosebleed valuations, that’s your ultimate investment philosophy. After founding Sun Microsystems in 1982, years later Scott McNealy once said, “At 10x revenues, to give you a 10-year payback, I have to pay you 100% of revenues for 10 straight years and dividends. That assumes; shareholders approve, zero-cost goods sold, zero expenses, no taxes, zero R&D, + we maintain the current revenue growth run rate. Now, having done that, would any of you like to buy my stock at $64? Do you realize how ridiculous those basic assumptions are? You don’t need any transparency, any footnotes. What were you thinking?”
“If everyone is thinking alike, then someone is NOT thinking.”
General George S. Patton
Size Matters
It’s now very close to 40% of the S&P 500, yes BIG TECH. Looking back, the only other sectors to ever position themselves even remotely close to this lofty level is Energy** at 29% in December of 1980, and Financials*** at 28% in 2007. We know what happened next to those two sectors. Beware, the inmates are running the asylum.
**Exxon $XOM lost 45% 1980-1982
***JP Morgan $JPM lost 74% 2007-2009
Microsoft Earnings Come Wednesday
Wall St.’s collection of brain trusts just love Microsoft MSFT, they’re falling all over themselves to upgrade the stock. With the energy of a mad mob, thirty-six analysts cover Microsoft equity; 32 “buys” vs. 4 “holds” and ZERO sells. Of course, when MSFT was on sale in March-April we heard crickets from this crowd, they were too focused on the “great depression.” Today, they’re in a better mood, expectations for MSFT’s sales growth are up at 8%, near $37B, with earnings per share close to $1.40. The situation is much like the analysts’ former darling, Exxon $XOM. In the summer of 2014, the stock was priced for absolute perfection. There wasn’t a bear to be found across all the Wall St. banks -then shares lost 71% of their value. By now, who doesn’t know Microsoft’s cloud portfolio products are clear beneficiaries in the “work from home” boom? The Information points out, “In this quarter, it is worth watching the rate of growth for Microsoft’s Slack-killer product, Teams, which saw surging usage in the March quarter. A related question is whether people are taking advantage of Teams’ video function, which competes with Zoom. And will Microsoft executives talk about their success in dealing with capacity shortages in their cloud business?”
Memories of 2011
Of course, back in 2011 when the stock traded at 12x earnings (vs. 36x today) and sported a healthy 4% dividend yield (vs. 1% today), the Street was all beared up on Microsoft at $28, comedy. Keep in mind, from 1999 to 2016, the stock was unched – bulls were hard to come by. In Q1 2002, it looked like Microsoft was on a comeback, the stock rallied to $35 and the Wall St. upgrades came rushing in, by September of that year the shares were down to $21. They wouldn’t see $35 again until 2007, but by the end of 2008, the shares were back down at $15. The stock goes on sale a lot, don’t chase.
Microsoft MSFT From the Lows
Mar 2020 Lows +63%
Dec 2018 Lows +130%
Feb 2016 Lows +350%
Mar 2009 Lows +1354%
Love this Quote
“Higher prices bring out buyers. Lower prices bring out sellers – size opens eyes. Time kills ALL trades. When they’re cryin’ you should be buyin’. When they’re yellin’ you should be sellin’. It takes years for people to learn those basics – if they ever learn them at all.”
Larry McCarthy, Former Head of Distressed Fixed Income trading at Lehman Brothers
Major Trend-Break Alert – Microsoft
 Microsoft, very quietly lost $100B this week. On Friday, MSFT equity closed BELOW its March 2020 trendline, a VERY bearish signal for BIG Tech. When leadership acts poorly, lookout.
Passive Overdose
ETFs now hold nearly $5T up from $500B a decade ago. Per Bloomberg Intelligence, new research has directly connected the explosive growth of passive investing to deteriorating corporate performance over the long haul. In a paper posted this month, a trio of academics tracked share-buyback activity for a range of companies and found those with higher passive ownership spent more on stock repurchases but saw worse financial outcomes. Having disengaged owners “lowered the association” between buybacks and future performance, according to authors Brian Bratten and Jeff Payne of the University of Kentucky and Meng Huang of the University of Toledo. It was also positively associated with “suspect” repurchases — those that resulted in companies meeting or beating near-term earnings expectations. “Our study provides evidence that passive investment may allow opportunistic management behavior that negatively affects future firm performance,” they wrote. “The growing influence of passive investment may lead firms to make repurchase decisions that are inconsistent with the interests of investors.” The findings are the latest twist in the raging debate about the rise of passive investing. A growing body of literature has raised issues such as the erosion of rivalry between companies, but research over the role of index-tracking funds in corporate governance has delivered mixed conclusions. One notable study in 2016 strongly connected passive investing to improved management.
The Active vs. Passive Debate
 As passive flows surge, they flow into MSFT, not Berkshire*. Over the last 5 years, there’s an additional $2T that’s flowed into the passive bucket relative to active asset management. Total returns last 5-years? MSFT 380% vs. BRK/B’s 32%. But the flows since March are all about the colossal overweight tech crowd (pure madness) and the perception of a new US cloud-based economy. So you have a double barrel mania going on here. First, the explosion of PAM (passive asset management assets under management) and then the afterburners kicked in. You have a large number of asset managers trying to keep up with the S&P 500 index performance, and a panic that they’re not long enough of our new cloud-based, remote living world companies (like Microsoft). Over the last 50 years, Berkshire BRK/A does not trade at valuations of < 1.2x book for very long. Most times, significant rallies ensue regardless of the rest of the market’s performance. In the summer of 2016, there were only $32B of (passive) assets in QQQs vs. $121B today. A large portion of those new assets have been forced into MSFT shares, there is NO choice on the matter, see below.
*For every $100B slowing into passive asset management (S&P 500 Index Funds), close to $6B of those new assets under management moves into MSFT vs. a little over $1B into BRK/B. The QQQs offer the real juice, for $100B of new AUM, $11B flows into MSFT vs. $0B for Berkshire. Some of the AUM above is price appreciation, not necessarily new dollars in the QQQs.
Indexing and Share Ownership Structure, Beware
Indexing doesn’t ramp value like growth because “value” has a far more dispersed ownership-base and higher float. Growth tends to be “new” money with high internal ownership, with a small float easily pushed around. The bottom line, the distortion is caused by indexing.
Microsoft MSFT Key Technicals
 In another disturbing turn of events, for only the second time since the March lows, MSFT closed BELOW its 20-day moving average (purple line above). In our view, this is sure to bring in algos and momentum selling next week. Some of the high impact machines are (programmed) triggered to exit on key technical levels. MSFT has held the 20-day since March. Holding this level brings in momentum buyers, failing will bring in a flush of exiters. The SELL Signals are lining up at the traffic light.
The Great Rotation
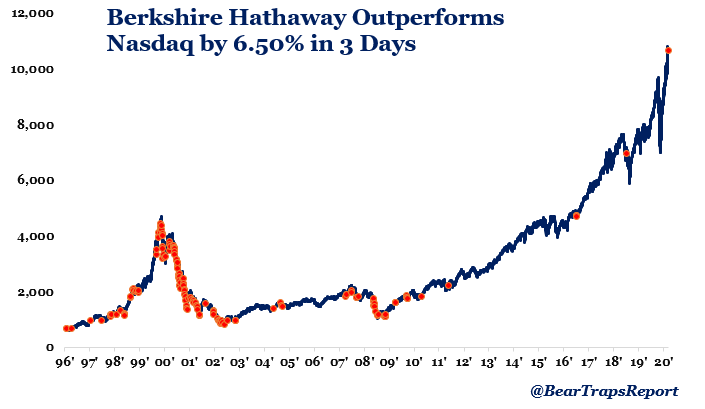 The Russell 2000 Index ripped higher by nearly 4% on Wednesday while the Nasdaq was relatively flat. Looking over the past 2 decades, when the Nasdaq (growth stocks) experiences this severe an underperformance vs. the Russell 2000 (value) it has usually coincided with the peak and/or downtrend of a cycle. A similar dynamic has played out with Berkshire Hathaway which as of yesterday’s close, has outperformed the Nasdaq by over 6.5% in the past 3 days. This is only the 3rd time since 2012 where BRK outperformed the Nasdaq by this much.
Watch Global Capital Flows
This week it’s important to note, as the US technology sector moved close to correction territory – capital was flowing into China. The total value of shares trading on the Shanghai and Shenzhen exchanges surged to near $10T, the best level since 2015. The U.S. dollar’s recent plunge puts big tech in an uncomfortable position. In recent years global calamities (Brexit, Trade Wars, COVID Phase 1) have pushed capital into the USA, NOT out. As the U.S. struggles relative to the RoW (rest of the world), for the first time in years, dollars are leaving U.S. shores.
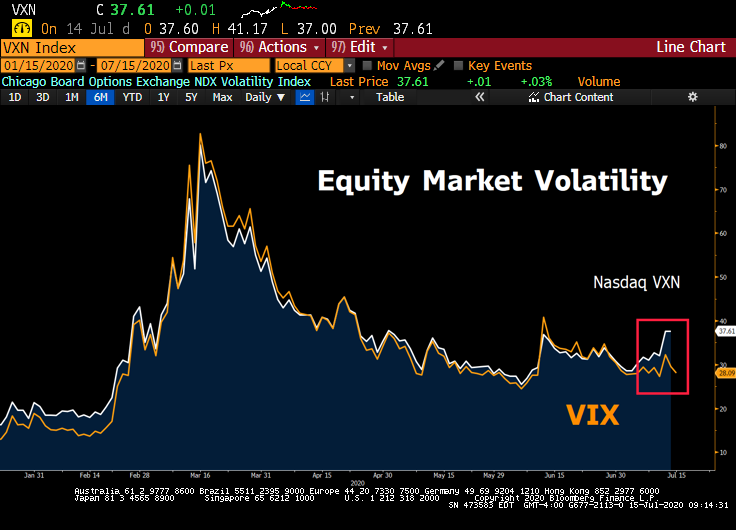 The Chicago Board Options Exchange NDX Volatility Index rose to 38 on Tuesday, an 8+ points premium to the CBOE VIX Index. That’s the widest spread since 2004. The gap between volatility in large-cap high fliers and the broader index has run the gamut in a matter of months, going from negative to non-existent to a multi-year high. Investors are paying-up for downside protection on NASDAQ high flyers.
 Both at Bullish and Bearish extremes, when analysts are this wrong, bad things happen. Tesla’s shares closed at $1544 on Friday, July 10, 2020, but the Street’s
  Optimists say, with the help of a Biden White House, by 2030 close to 100% of SAAR will be in the electric vehicle space. With a battery mileage range of 1000-1200, the bulls say the ICE (Internal Combustion Engine) will be nearly obsolete. But, if this is the case looking forward, why aren’t large lithium miners a lot higher? During 2017’s electric vehicle excitement phase, when investors were piling into anything and everything EV, Albemarle was near $150 a share vs. the $78 today. As one of the largest lithium producers on earth, Albemarle is uniquely positioned and a far more attractive value relative to Tesla. In 2015, ALB finished its $6.4B takeover of Rockwood Holdings (one of the Big 4 lithium producers globally), the company is an anchor tenant in the lithium space. The Street expects Albemarle to capture a LARGE share of global lithium-demand growth over the next several years. An oversupplied market risk in 2020 has been the question mark. Some analysts point to the negative impact of the coronavirus on electric-vehicle demand. The company slowed the pace of its lithium expansion to help balance the market while it continues to consolidate its position in catalysts.
 On July 21, 2020, Silver surged 6% before 9am. Keep in mind silver’s all-time high is over $50, while today gold is very close to its 2011 perch. Silver has some large scale catching up to do. We went to a full, “high conviction” silver position for clients in late March 2020.
 We have recently lightened gold but maintained a full 3/3 position in silver SLV and 2/3 XME materials and metals. We MUST NEVER forget how many investors globally are crowded into U.S. equities. When a stock’s performance in gold starts to look unattractive, U.S. equities will lose some portion of their global investor-base. So many things can be said about the chart below but we think what it really does is cancel out the Fed effect. Meaning, the Fed has caused the inflation of both stocks and gold – higher asset prices for sure.
 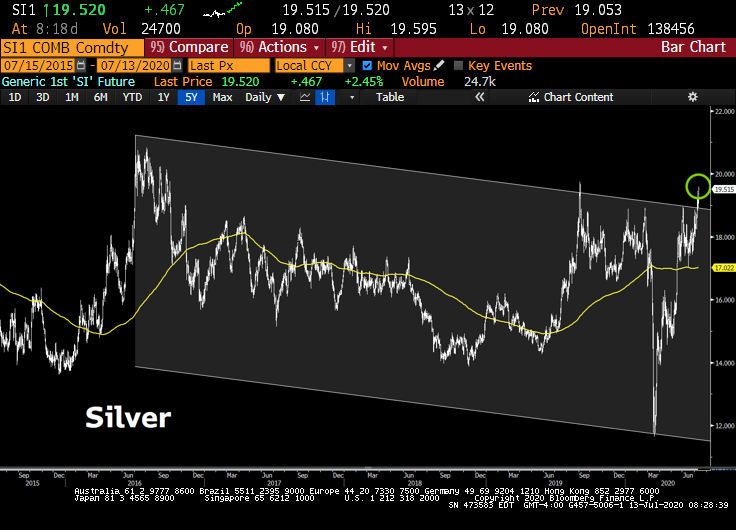 Lots of new paper wealth on the planet is looking for a hard asset hedge. During the week ending July 10th, another $1B flowed into gold and silver ETFs. Silver is a very small pond relative to the near $40T in US paper assets.
  We agree it looks much more natural. We think the price of the S&P in dollars is the ultimate Fed head-fake. The entire 2018 move has been canceled. It is really a revelatory chart. It’s super important! U.S. stocks in gold terms are trading at late 2017 level if my eye doth not misread, one ugly equity rally indeed. Poor foundation, in two words.
 With over $35T in paper-promises; U.S. Treasuries $15T, U.S. Corporate Bonds $11T, Big Tech Stocks $7T, and U.S. Municipal Bonds $4T – all that new wealth is crowded in financial assets – looking for a real, hard asset (hedge) alternative. At some point, when the promissory note pool becomes too large, more and more capital starts to look for a hard asset (copper) hedge, WE ARE THERE.
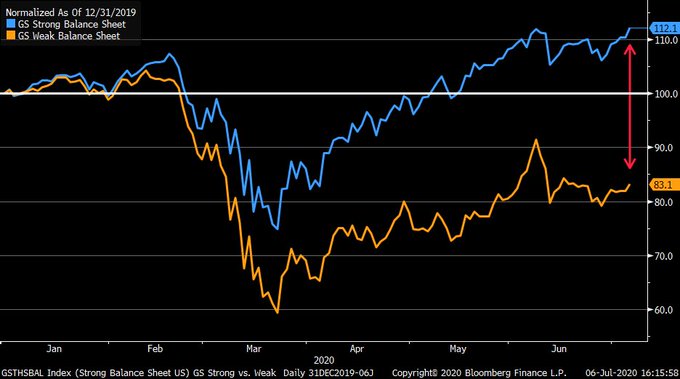 As you can see above, credit risk is driving equity prices. Well funded sectors (
 Since January, we have experienced over $4 trillion of deficit spending and $3T of balance sheet expansion from the Federal Reserve. Will the U.S. continue to borrow more, to print more, to stimulate more? A disastrous 11% unemployment number was greeted as a positive surprise.
  The latest bill passed by the Democrat-controlled House of Representatives concocts a $3 trillion infrastructure bill spending that represents a jump towards a Green New Deal, and unabashedly so. The Republican-controlled Senate knows not what to do: on the one hand, it doesn’t want an infrastructure bill it deems not truly an infrastructure bill, but on the other hand, rejecting what is touted as jobs creating legislation makes for bad optics politically. One would hope that some sort of infrastructure bill slithers out of the Senate before August recess. Assuming a compromise bill is signed in September, then what? Why, more trillions of dollars to state and local governments whose coffers have been emptied by lockdowns. Of course.
 Big credit expansion from the Federal Reserve and a colossal fiscal boost has significantly reduced credit card delinquencies and increased car purchases. Those two phenomena will reverse once the $600 a week safety net vanishes after July 31st. We expect Congress to extend the PPP program for small businesses, but in a more focused format that supports only the hardest-hit businesses. Extending the full $600 per week in Pandemic Unemployment Compensation (PUC) is highly controversial and will NOT last past July.
 With large fiscal plans coming out of China, the U.S., and the UK, the global commodity complex has caught a bid.
