
“Our indicators tell us, we’re very close to a Lehman-like drawdown,” argues Larry McDonald, a former strategist at Société Générale who now runs The Bear Traps report.
Financial Times, February 20, 2020
*Our institutional client flatform includes; financial advisors, family offices, RIAs, CTAs, hedge funds, mutual funds, and pension funds.
Email tatiana@thebeartrapsreport.com to get on our live Bloomberg chat over the terminal, institutional investors only please, it’s a real value add.
Don’t miss our next trade idea. Get on the Bear Traps Report Today, click hereAs of 8:30 AM ET, July 21, 2020
Metals Last 30 Days
Month over Month
Silver +18.4%
Copper +11.4%
Palladium +9.4%
Platinum +5.7%
Zinc +5.2%
Gold +4.9%
Nickel +3.8%
Aluminum +3.5%
Tin +2.3%
Cobalt -1.5%
Bloomberg data.
A client in our institutional Bloomberg chat, shared with permission:
July 17: “Since mid-May, the Bloomberg Dollar Index is almost 5% lower. This week the bid for long-dated TIPS (Treasury inflation-protected securities) has been very strong, telling indeed. Demand was so fierce, yields plunged down to -30bps. In April, we saw TIPS outflows, now capital is flowing in, large. Clearly, the market is pricing in the early genesis of inflation or stagflation.”
July 13: “We have looked at the S&P in EUR (Euro currency). I would love to see it in gold. I bet it doesn’t look nearly as hot in gold equivalent. Gold is a powerful global currency, especially right now!”
Unloved Silver is Finding Some Friends
 On July 21, 2020, Silver surged 6% before 9am. Keep in mind silver’s all-time high is over $50, while today gold is very close to its 2011 perch. Silver has some large scale catching up to do. We went to a full, “high conviction” silver position for clients in late March 2020.
US Dollar is 5% Lower Since Mid-May
 We have recently lightened gold but maintained a full 3/3 position in silver SLV and 2/3 XME materials and metals. We MUST NEVER forget how many investors globally are crowded into U.S. equities. When a stock’s performance in gold starts to look unattractive, U.S. equities will lose some portion of their global investor-base. So many things can be said about the chart below but we think what it really does is cancel out the Fed effect. Meaning, the Fed has caused the inflation of both stocks and gold – higher asset prices for sure. So, if you price stocks to gold – the Fed’s ($3T of balance sheet expansion) effect on the stock market more than disappears.
Commodities Year to Date
Lumber +37%
Uranium +30%
Iron Ore +29%
Gold +19%
Silver +8%
Copper +4%
Wheat -4%
Corn -13%
Bloomberg Commodities Index -18%
Oil -35%
Bloomberg data
So far in 2020, hard commodities (metals) are doing much better than their soft, ags (agricultural) brother. Investors are building up silver positions – prices head for a sixth straight weekly advance, the longest stretch in more than three years. Further gains are likely, with demand from investors and industrial users led by China, while supplies are constrained due to the coronavirus pandemic. Futures traded on Comex in New York touched the highest since 2016 this week, and exchange-traded funds backed by the metal are on course for the 12th week of net inflows, per Bloomberg.
July 13: Silver Making a Colossal Move, Major Breakout
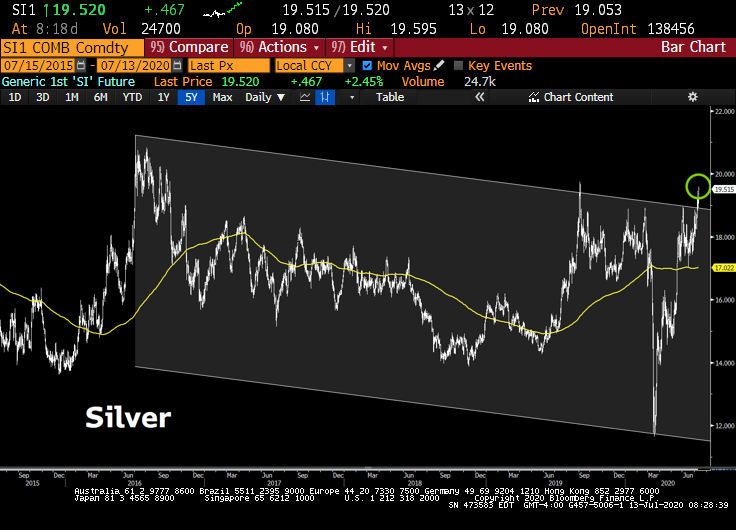 Lots of new paper wealth on the planet is looking for a hard asset hedge. During the week ending July 10th, another $1B flowed into gold and silver ETFs. Silver is a very small pond relative to the near $40T in US paper assets.
Shocking and Shocking
The most shocking moment of this shocking chart is that it quite recently made a big new low. It wasn’t a token new low. It was much much lower than the previous lows.
Just Wow
 We agree it looks much more natural. We think the price of the S&P in dollars is the ultimate Fed head-fake. The entire 2018 move has been canceled. It is really a revelatory chart. It’s super important! U.S. stocks in gold terms are trading at late 2017 level if my eye doth not misread, one ugly equity rally indeed. Poor foundation, in two words.
Colossal Inflows
In the first half of 2020, Gold-backed ETFs closed with a record $40B of net inflows. In June, gold ETFs added nearly 110 tonnes, this brought global holdings to all-time highs of nearly 3700 tonnes.
Capital Looking for a Hedge
 With over $35T in paper-promises; U.S. Treasuries $15T, U.S. Corporate Bonds $11T, Big Tech Stocks $7T, and U.S. Municipal Bonds $4T – all that new wealth is crowded in financial assets – looking for a real, hard asset (hedge) alternative. At some point, when the promissory note pool becomes too large, more and more capital starts to look for a hard asset (copper) hedge, WE ARE THERE.
July 10th’s PPI Inflation
June Producer Prices: fell -0.2% m/m vs. +0.4% est. & in prior month; core fell -0.3% vs. +0.1% est. & -0.1% prior… y/y -0.8% vs. -0.2% est. (unchanged); & y/y core (chart) +0.1% vs. +0.4% est. & +0.3% prior. With Liz Ann Sonders on the PPI Inflation data.
Don’t miss our next trade idea. Get on the Bear Traps Report Today, click here

