
Don’t miss our next trade idea. Get on the Bear Traps Report Today, click here
Breaking: *N.Y. FED’S 42-DAY REPO OP. OVERSUBSCRIBED; $42.55B OF BIDS – Bloomberg, December 2, 2019
$42B?!
Q: Who’s the Fed financing here? Leveraged loans??? Global hedge funds???
A: Fed financing lev loans: Why wouldn’t they? Easier to soak the ground now than be trying to put out the fire later (credit fund).
Looking Down the Road Ahead
Our 21 Lehman Systemic Risk Indicator Index (LSRII) was developed in 2007. It focuses on tracking the contagion effect and provides good and bad signals in terms of effectiveness with one important finding. Like a reliable caddie in golf, the longer you’re together – the better he / she is. There was a group of revolutionaries who tried to stop the madness at the ill-fated bank, but one by one they were silenced. We explore the legendary lessons below, enjoy.
The Crow’s Nest
 We know elephants leave footprints. Looking over the calm seas across markets, from the crow’s nest if a hedge fund manager David Tepper sees something meaningful risk wise, the first thing he does is takes 0.25% of this year’s p/l and deploys it at the cheapest, relative value protection. If David Einhorn joins him, Seth Klarman’s head trader as well, that’s fairly detectable. Of course, we have no idea what hedge funds are leaving the footprints, just using those three veteran investors as an example.
Our Global Bloomberg Client Chat
In daily interaction with over 300 institutional investors globally, our live Bloomberg client chat helps to provide clues throughout the year. From time to time we’ll hear about a large “print” either in HY CDX, S&P Futures, Forex vol futures, Eurodollar futures, etc. We’re attempting to measure the accumulation of hedges. More size, the more encroaching risk.
At Lehman, our team attempted to hedge the $6B ish of leveraged loans the bank got stuck with, so the origin of the idea comes from that painful experience.
Over the years, we have altered the index weightings relative to parts of the world where risk is most concentrated. In 2011, CDS on Eurozone banks (exposure to Greece debt) were an outstanding leading risk indicator for US equities, much the way US banks were in 2007-8.
Today, the index has been much more Asia focused. Italian bank CDS is still a decent Salvini political risk indicator as well. Above all it’s important to note, we’re starting to shift the focus – back on the US.
US high yield, leveraged loans, and CLOs are near $3.2T, add the $2.6T of BBBs, you get nearly $6T of risk assets. In the QT (quantitative tightening) world, the Fed cluelessly over-cooked the goose. They pulled too many dollars out of the system and tightened FCIs (financial conditions) far faster than they were aware of at the time (Q4 2018). The beast inside the market literally broke the Fed over its knee like kindling being thrown into the fireplace. It was a beautiful capitulation.
We MUST keep in mind – during the 2000-2002 credit cycle flame out, over 45% of the investment-grade universe oozed into “high yield” bond territory. Today that’s the equivalent of $1.2T of “fallen angels” (vs. $195B in 2000-2002) – a flood of junk near unimaginable proportions. It’s no surprise the Fed caved in such embarrassing fashion, they had a large gun pointing at their legacy (head).
Today, they’ve deployed the QE fire hose (term repo + $60B/m tbills) but when the mark-to-market of say $150B (20 or so idiosyncratic events) of HY, CLOs, loans and junk IGs falls quickly, the ability of banks / hedge funds to hold these assets is highly unknown, untested. It doesn’t matter if $5.5T of the risk pool is just fine, come near year-end everyone has to put some cards on the table.
U.S. Credit Risk Rising
In our view, leveraged loan funds and ETFs are the new shadow banks, outstanding debt in this dark corner of Wall St. has surged to nearly $1.5 trillion in the US. While Collateralized Loan Obligations are the largest buyers (about 50%), leveraged loan mutual funds and ETFs are the second-largest buyers comprising around 30% of the demand. Over the years we’ve learned, there’s a waterfall effect across credit markets. Stress in one pocket often leads to two and three fairly quickly. Credit spread contagion MUST be meticulously monitored, especially with an accommodative Federal Reserve. After 3 rate cuts and a $400B balance sheet reversal from contraction to expansion – why are we seeing stress on the rise? Let’s explore.
A Federal Reserve, Juicing Leverage on Leverage on Leverage
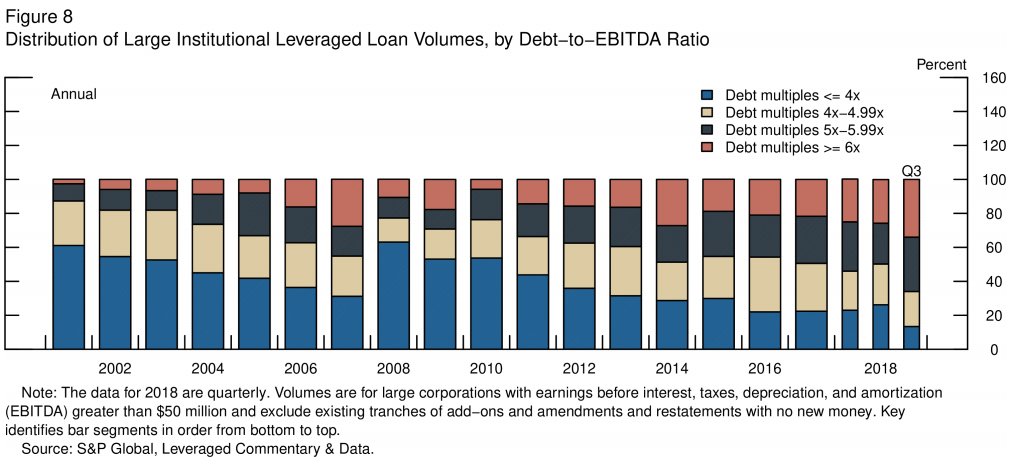 As you can see above, debt to EBITDA multiples at issuance > 5x have surged dramatically. It’s clear to us, the longer the Federal Reserve doesn’t allow the business cycle to function – clearing out the bad actors – leverage on leverage continues to pile up. Look at 2019 relative to 2007, it’s screaming moral hazard at Mr. Powell. Debt multiples < 4x make-up just 10% of loan sale volumes vs. close to 30% in 2007.
Don’t miss our next trade idea. Get on the Bear Traps Report Today, click here
The Liquidity Mismatch
Our friend Rod Dubitsky points out, leveraged loan funds offer the promise of daily liquidity, yet the underlying asset is fairly illiquid and the time to sell could be lengthy. Leveraged loans could take up to 21 days to settle, while the funds are required to meet redemption requests within 7 days, but in practice are expected to provide liquidity in one or two days. Innovation in financial products and ETFs has incentivized the unsustainable in our view. How can ETFs and mutual funds offer realistic liquidity on financial instruments inherently illiquid?
Cash Flow Coverage Fleeting in US Loan Market
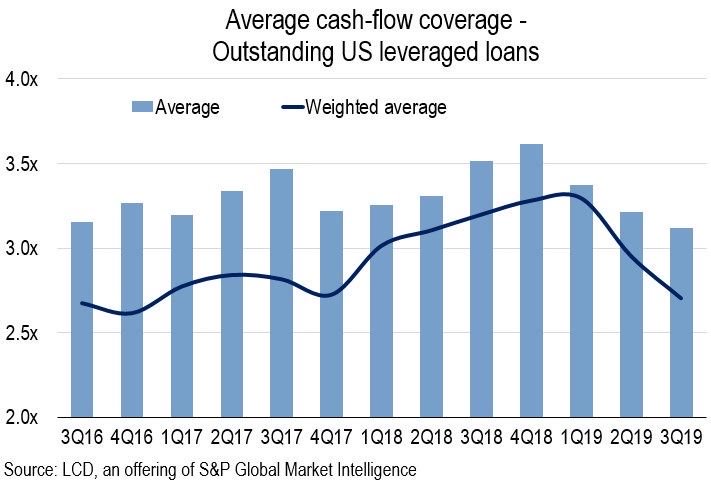
It’s a clear liquidity mismatch in our view, one that takes us back to the mid-2000s.
A Lehman Visionary
It was a morning in June 2005, one we’ll never forget. Michael Gelband, a Lehman Brothers managing director and the firm’s head of global fixed income, gave a presentation to our team of traders about the dark side of the real estate market. The meeting began just after 6:45 a.m. Each attendee was handed a dossier of about 30 pages.
In our 2009 global bestseller – A Colossal Failure of Common Sense (now published in 12 different languages), there’s an epic scene where Gelband described the stunning proliferation of “no-doc” mortgages and other toxic loans, sold by commission-driven salesmen and then purchased by Lehman and other Wall Street banks.
Steve Jobs once said of Einstein, “talent hits a target no one else can hit, genius hits a target no one else can see”. A true visionary, Mike could see the train wreck a mile away.
“He cited the shadow banks, the vast complex network of mortgage brokers that were not really banks at all but managed somehow to insert themselves into the lending process, making an enormous number of mortgages possible while having to borrow the money themselves to do so. He cited outfits such as Countrywide, New Century, HBOS, and NovaStar, among others, and he accused them of creating well over $1 trillion in economic activity that was comprehensively false money and would never be converted into genuine economic power.”
Gelband predicted that the house of cards could soon collapse — perhaps in 2007 or 2008 — producing serious consequences for the U.S. economy. After the meeting, Gelband didn’t stop pressing the issue. He used his position on Lehman’s executive committee to try to persuade the firm to pull back from its massive bets on the real estate market. But warnings from Gelband and others with similar concerns were largely ignored by senior management at Lehman Brothers.
We MUST NOT ignore the current signals coming from the leveraged loan market – they are screaming loud and clear.
Don’t miss our next trade idea. Get on the Bear Traps Report Today, click here
Are funds set up to meet a severe liquidity challenge in a distressed environment? We agree with Rod, “no way Jose”. While there have been redemption spikes (a surge in the number of people wanting their money back) even within the last year or so, they have been fairly brief, shallow and occurred during relatively robust economic times.
Fed’s Fire Hose
 In recent years, the Fed has saved the day numerous times. First on ending rate hikes after promising to march on, then on quickly shifting to rate cuts, and finally a colossal capitulation on their beloved balance sheet reductions plans ($2.5T in reduction promises to recent $400B expansion of their balance sheet). There have been runs on leveraged loan funds, but each time the Fed put out the fire with a reversal toward far more accommodation. Even so, with all the Fed love, stresses are NOT going away!
Even after 3 Rate Cuts, a Downgrade Surge
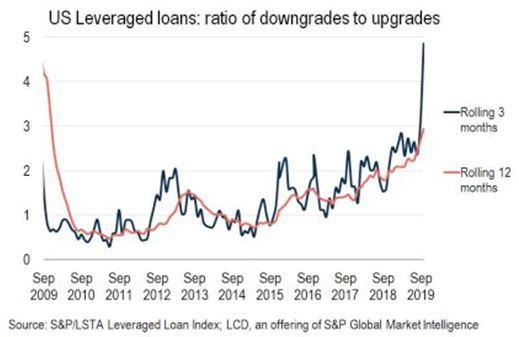 We believe the market is underestimating this liquidity risk should the market face a true, prolonged downdraft. In 2019, defaults in the U.S. leveraged loan space are approaching $30B. In October and November, defaults are nearly $10B, that’s about 40% of last year’s total in JUST two months.
Fitch Problem Loans of Concern Index
November: $112B / 8% of the market
July: $71B / 5% of the market
January: $71B / 5% of the market
*Fitch Leveraged Loan data, defaults spike to the highest level in 2 years, forecast year-end 2020 retail and energy default rates at 8% and 13%, respectively. A five-year-old can tell you the rating agencies are the last to get the joke in any default cycle. Looking back over the last 70 years, credit cycles are littered with embarrassing flashes of rating agencies playing catch up on defaults. Hence, if the Fitch “problem loan” basket is up to $112B, it’s safe to assume that the number is substantially higher in reality.
Cash vs. Low Quality “B” Holdings
To assess the risk for redemption fails, we looked at two key measures for the top 10 leveraged loan funds (about $60B in total). Specifically, pay attention to the percentage of holdings of Single-B rated and below assets and the percentage of cash held by the fund (cash being a proxy for the ability to meet a spike in redemptions).
Houdini Liquidity, now You See it Now You Don’t
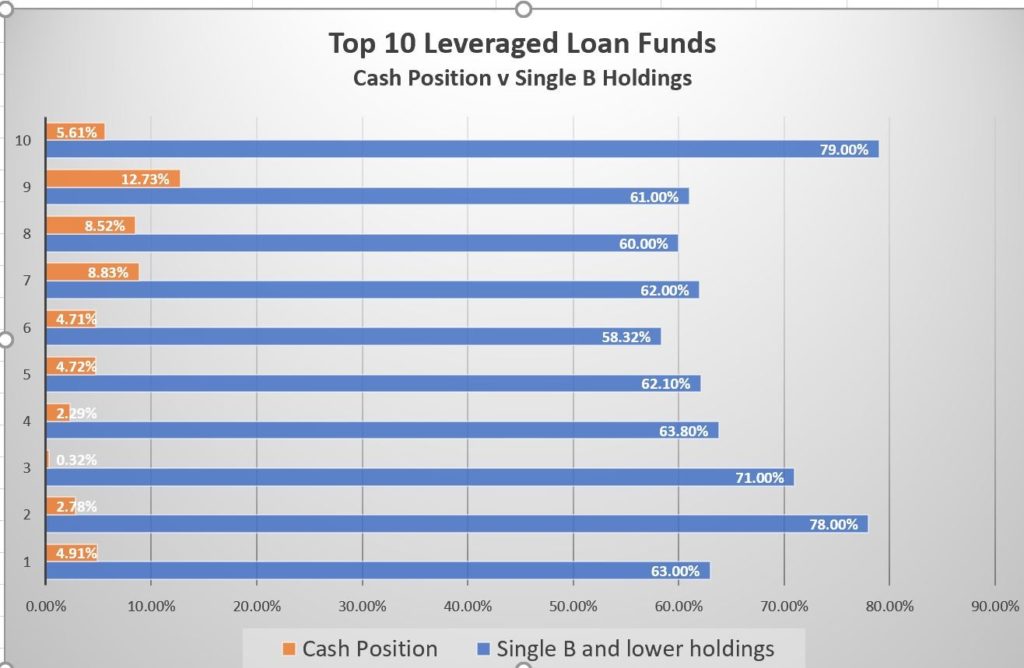 As the chart above shows, most funds have over 60% invested in single-B and lower-rated assets, yet typically have cash positions at just 5% on average. One fund held only 0.32% in cash and yet had over 70% in single-B and below assets. In a prolonged sell-off, the 5% cash would likely prove grossly inadequate in the face of reduced overall market liquidity, lengthening settle times and a spike in redemptions. In a severe downturn, it’s likely that a significant percentage of the loans would be downgraded to CCC, rendering sale much more difficult and all the while prices likely would be collapsing.
Cash Shortfall, Implications
While some funds may supplement cash liquidity with access to a line of credit and/or holdings in more liquid bonds, it’s not clear either of these would be sufficient. Lines-of-credit may not be available when needed and even if they are drawn they may create a senior claim on the remaining assets thereby amplifying risk for those who remain in the funds.
Credit Leads Equities
 The Blackstone GSO credit fund is loaded with lower quality (B rated) leveraged loans. It’s interesting with stocks ripping to new highs, B rated loans are under meaningful selling pressure as downgrades mount. If credit is weakening at this pace with a U.S. economy near full employment, what will happen when stresses mount?
Redemption Risk isn’t Theoretical
There is a history both during the financial crisis and more recently of funds having to freeze redemptions due to lack of asset liquidity (most recently the Neil Woodford managed funds in the UK). In fact, in 2015 the Third Avenue Focused leveraged loan fund collapsed amidst a flood of redemptions.
Finally, cascading redemption freezes would likely reverberate through the entire leveraged loan markets including CLOs which would face greater difficulty in trading distressed loans and a deterioration in recoveries.
Rod Dubitsky has over 30 years of experience in the financial services and global development sectors. Founder of The People’s Economist (TPE). The bulk of his career had been spent in financial services working for rating agencies, wall street dealers, banks and money managers developing a range of market-leading, award-winning research, and analytical platforms. Frequently quoted in the media including Time Magazine, Forbes, NY Times, WSJ, FT, and Bloomberg. While working in finance, he was a top-ranked analyst for Credit Suisse in the consumer ABS finance sector and led the newly create advisory analytics division for PIMCO with responsibility for overseeing some of the largest post-financial crisis bailout consulting engagements.
Don’t miss our next trade idea. Get on the Bear Traps Report Today, click here
 In an attempt to support the Eurozone economy, since 2014 the European Central Bank has expanded its balance sheet by $2.7T and kept its deposit facility rate between -0.20% and -0.50%, suppressing the Euro currency. If there was a score for cheating on the global trade playing field, ECB chair Mario Draghi has a perfect “10”. Over the same time period, the Fed hiked interest rates 9x and reduced its balance sheet by $600B, per Bloomberg (since this clear policy error, the Fed has recently expanded its balance sheet by $200B and cut the Fed funds rate upper bound from 2.50% to 2.00%). This bizarre policy divergence between the Fed and ECB has empowered the global wrecking ball that has become the U.S. dollar. Trump’s bid to stay in the White House hangs in the balance.
 In Q3, the U.S. Dollar’s surge to its October 1st peak of 99.67 (97.28 today) did some serious damage to manufacturing jobs in MI, WI, and PA (see the image below). This places TRUMP in a meaningful risk position, far more than U.S. equities are currently pricing-in. If you do the math, Trump CANNOT win these states in 2020 with a strong dollar. U.S. equities are at grave risk unless the White House / Fed can get the greenback down, and down fast.
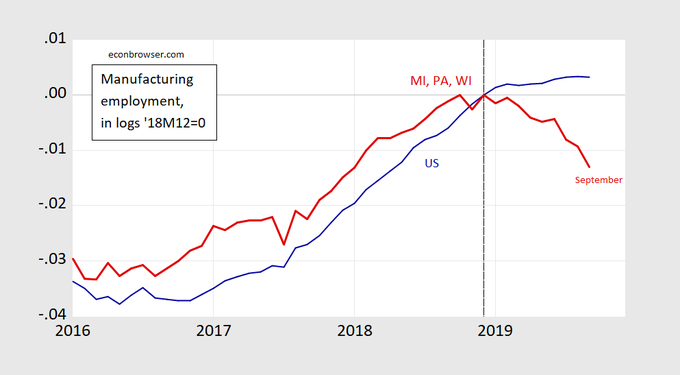 Similar to 2015-2016, this year as the dollar soared, U.S. export products to other countries became far more expensive and manufacturing jobs in Michigan, Wisconsin, and Pennsylvania plunged.
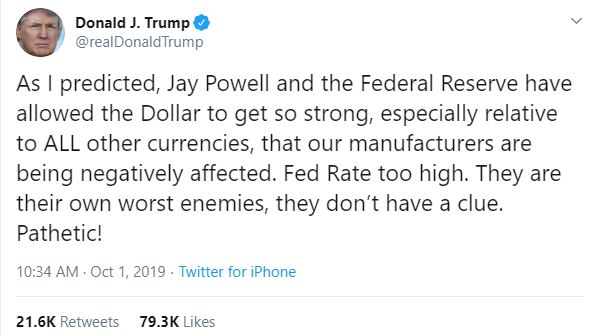
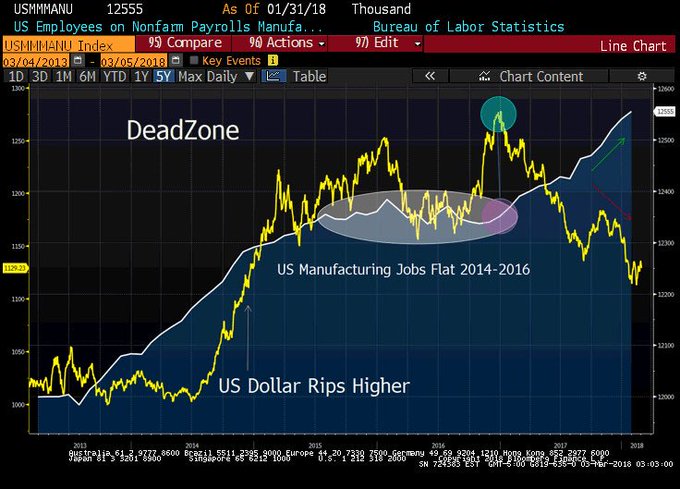 After the 2015-2016 US Dollar surge, manufacturing jobs in the U.S. came under serious pressure. We believe this factor, among others, cost Hillary Clinton the election. Heading into 2020, there are few things Treasury Secretary Steven Mnuchin and of President Donald Trump want more than a weaker Dollar. It’s probably not too much of a stretch to say that the Dollar’s 2014-2016 surge delivered Michigan, Wisconsin, and Pennsylvania to Trump on the back of undermined manufacturing and exports (see the above image, Dead Zone). The President clearly knows this and it’s part of the reason for his regular tweets and comments lamenting Powell’s interest rate 2018 rate hikes and the strong USD. Stay tuned.
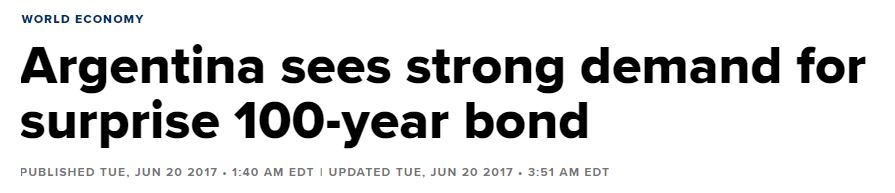
 The double-edged sword of duration is on stage here. Some investors like ultra-long maturities with low coupons because their prices rise dramatically when their yield falls. In the great race away from negative yields, over the last year, Austria’s long bond has doubled in value, while Silver is 32% higher, and gold up more than 29%.
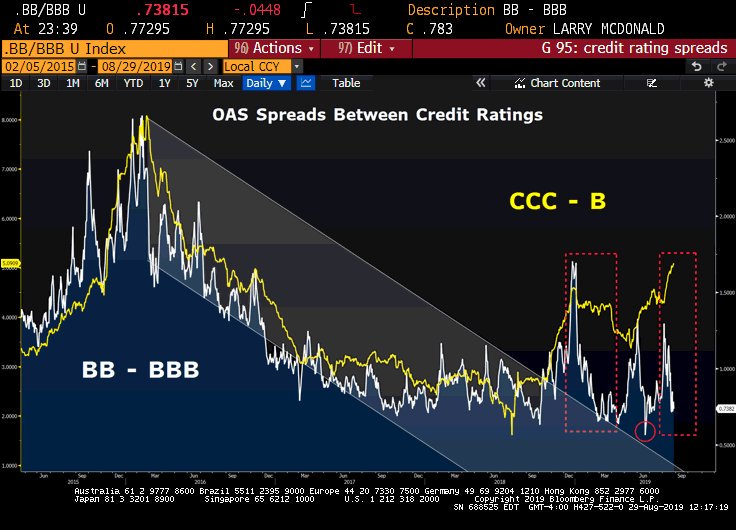 The junk of the junk, why has CCC-rated paper dramatically underperformed while capital is flying into BB credits in the U.S. In the middle of the ‘everything rally’ – one would expect beta-chasing to drive demand for the highest yield, worst rated high bonds. That’s NOT happening. To us, this is an important signal, we’re very close to the ugly credit saturation point. Even with colossal pressure from central banks to reach for yield, rising default risks are keeping investors away from CCCs. What does this mean for U.S. stocks? Pick up our next report, just click on the link below.
 Part I: The possibility of an island: In April, the SMH Semiconductor ETF enjoyed a parabolic (and, by implication, unsustainable) rise dotted by a plethora of up gaps, indicating desperation to buy. The April 3rd gap was particularly impressive, as there had been a violent up-move day in late March which was immediately reversed in dramatic fashion in the next one and a half trading sessions. The April 3rd gap happened at the peak of that reversal.
 A meaningful rotation is in the works here, near historic proportions in our view. Slow growth consumer staples have outperformed growth stocks in the semiconductor sector by 2200bps (22%) over the last year.
 Capital One COF was a standout this week, we noticed significant divergence to the upside relative to regional bank equities. A short squeeze was in play in our view, short interest in COF shares rose to nearly 6m shares in Q1, up from 3m shares short in September 2018. Strong earnings results were the driver of the squeeze, the company also put forth initiatives to boost margins as it lays out a path to become more efficient. It’s important to note, few stocks actually lost too much ground in Financials as the sector was firm this week but trust bank State Street STT was the worst performer. Organic growth at Trust Banks is facing a number of headwinds.
 The driving theme for the week across asset classes may have been the increasing emergence of relative value trades even as the S&P 500 Index climbed to a new all-time high. To be sure, being ‘long & strong’ has paid off for US stock investors again in April — the S&P 500 is up over 3.5% for the month. But April has also brought even greater returns from relative trades such as long Tech/short Healthcare or long the dollar vs. the euro over the past week.
 Stocks are partying like it’s 1999, while junk bonds are showing signs of cracking. We’re looking down the barrel of a high pace of credit rating downgrades. Per S&P Ratings this year, the ratio of downgrades to upgrades is the worst since 2016’s energy price collapse, back then oil was $26 vs. $64 today. We’re seeing a sharp breakdown, a meaningful underperformance of poorer quality credits. Credit deterioration is picking up even with CCC high yield index up +10.1% YTD, Q4 loss was near -10%. If you look at the frequency of bonds in a -20% or more hole (substantial sell-off in price), in 2019 we’re at double the pace of 2017 in terms of blow-ups in the CCC corporate bond space.
 It’s kind of a mind-blower. Since 2014, the European Central Bank has been in accommodation mode to the tune of a $2.7T bond-buying spree (see above) found in their colossal balance sheet expansion. At the same time in the U.S., the Federal Reserve has hiked rates nine times, eight since the 2016 election and REDUCED its balance sheet by $500B. Is the U.S. economy that much stronger than Europe’s? Clearly, there’s $62T of GDP OUTSIDE the U.S. and $18T inside – so Fed rate hikes tend to do a number on the global economy which feeds back to Europe in a negative way, which then comes back to the U.S. and stopped the Fed in its tracks (in Q1 the Fed put forth one of the most significant policy reversals in the history of central banking). A five-year-old can tell you this is a broken model. You can’t have one central bank hiking rates nine times in 3 years, and another buying up nearly $3T of global assets – markets just told us this is a highly unsustainable dynamic in modern central banking. We believe the Fed, ECB, PBOC (China), BOE (UK) now get the joke. Looking forward – we see a “convergence” in global central bank policy, NOT unsustainable divergence. This will have MAJOR implications for the dollar, precious metals and emerging market equities. Pick up
 Today, economic demand struggles are bottoming globally, and the Yuan (China currency) is beginning to strengthen. One of our favorite global economic indicators is found in 3-month China yuan volatility. As a currency is strengthening volatility plunges, while a weaker currency is often met with a surge in forex volatility. Looking back over the last 5 years you can see – above- the powerful impact on global equities. There’s an inverse relationship between equity prices globally and China forex vol. BUT, but , but; above all, the last time China currency volatility was this low, global equities were a lot higher – see the grey circle above.
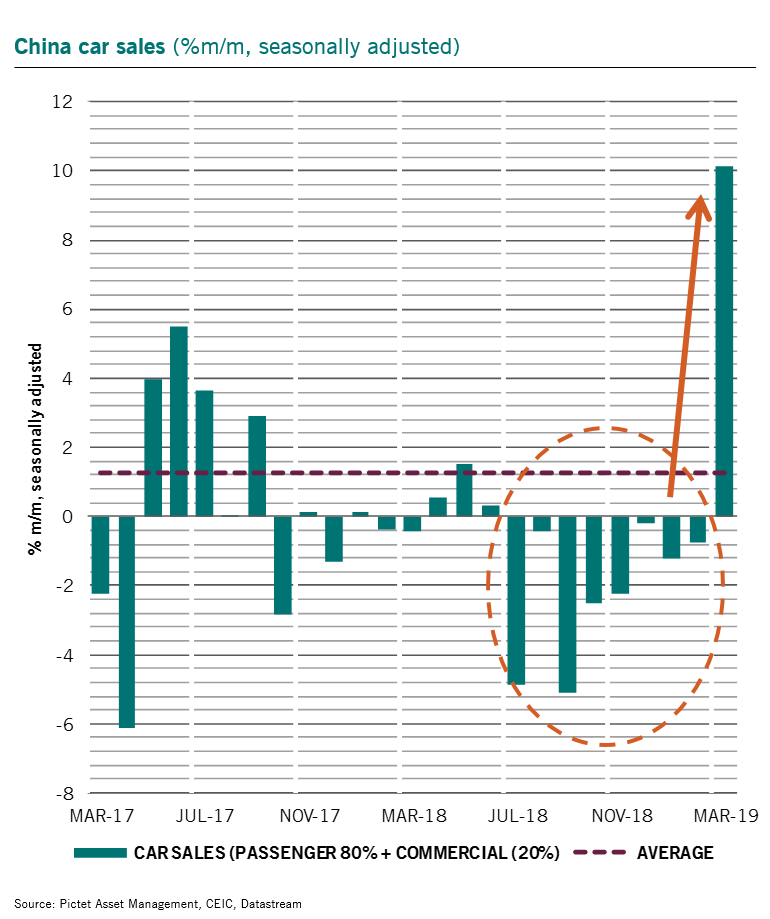 China’s easier economic policies transmission to consumption has not convinced so far. March jump in car sales may be the 1st sign of this happening. Car sales rose more than 10% over the month (strongest since April 2009), reversing the y/y trend growth from 22-year lows. Special thanks to our friend Patrick Zweifel and Pictet Asset Management for this observation.
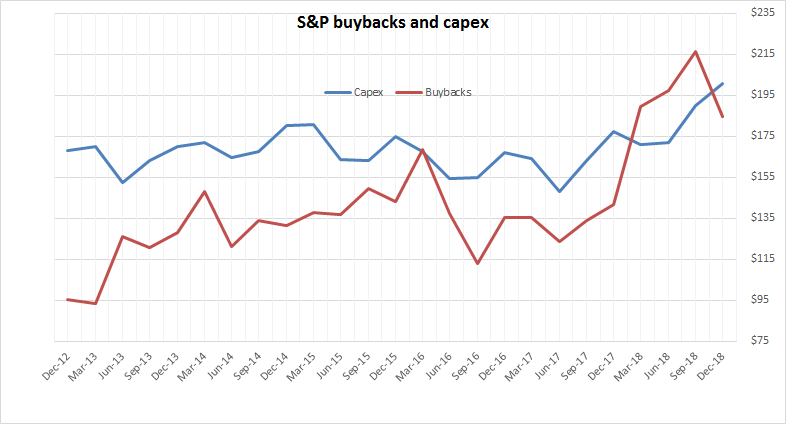 Our Bear Traps Report team developed this thesis in early January – see our chart above. We’re pleased to say, NOW Goldman is backing up our work. It’s very disturbing that the main street media continues to spin a narrative which is completely false. When looking at the numbers, Goldman’s US portfolio strategists David Kostin and Cole Hunter find many of these arguments (Buybacks > Capex) don’t hold up in reality! In particular, they emphasize that even as companies return a large amount of cash to shareholders, there is sizable reinvestment; in fact, growth investment at S&P 500 companies has accounted for a larger share of cash spending than shareholder return every year since at least 1990, with the largest share repurchasers far outpacing market averages in the growth of R&D and capex spending. They also find those executives who stand to gain the most from buybacks— those whose compensation depends directly on EPS—did not allocate a greater proportion of total cash spending to buybacks in 2018 than executives whose pay was not linked to EPS.
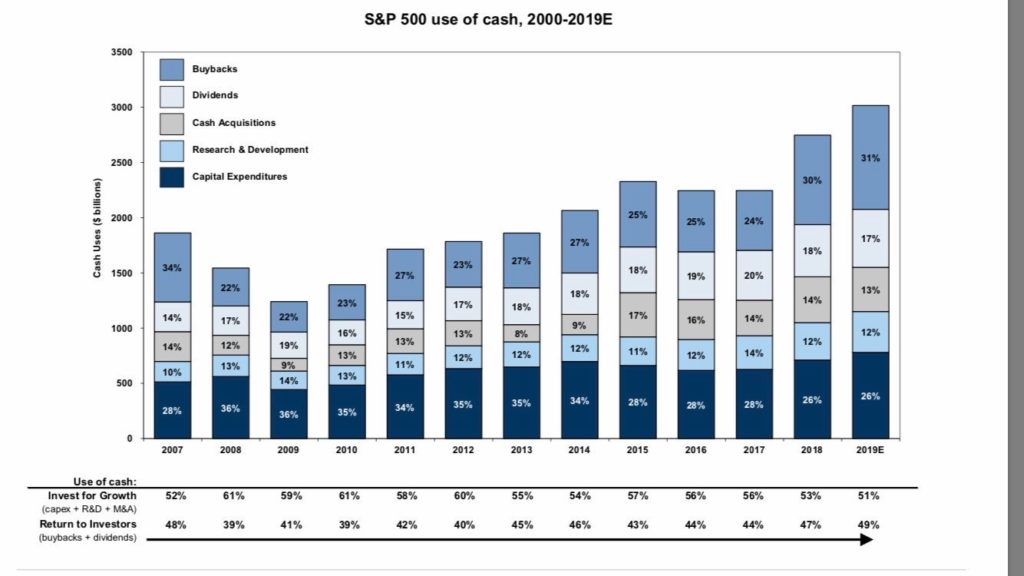 Aswath Damadoran, professor at New York University Stern School of Business, agrees that buybacks aren’t coming at the expense of investment. Rather, he argues that large, mature companies returning cash to shareholders allow that cash to be put to more productive uses; so it’s not that companies are investing less, it’s those different companies—with better growth opportunities—are investing instead.
 Tesla stock price is on the bottom end of a sustained trend channel, as investor’s optimism slowly dwindles. However, “proposed” legislation could be the boost the equity needs to bounce off nearby support – as long as it moves quickly trhough Congress.
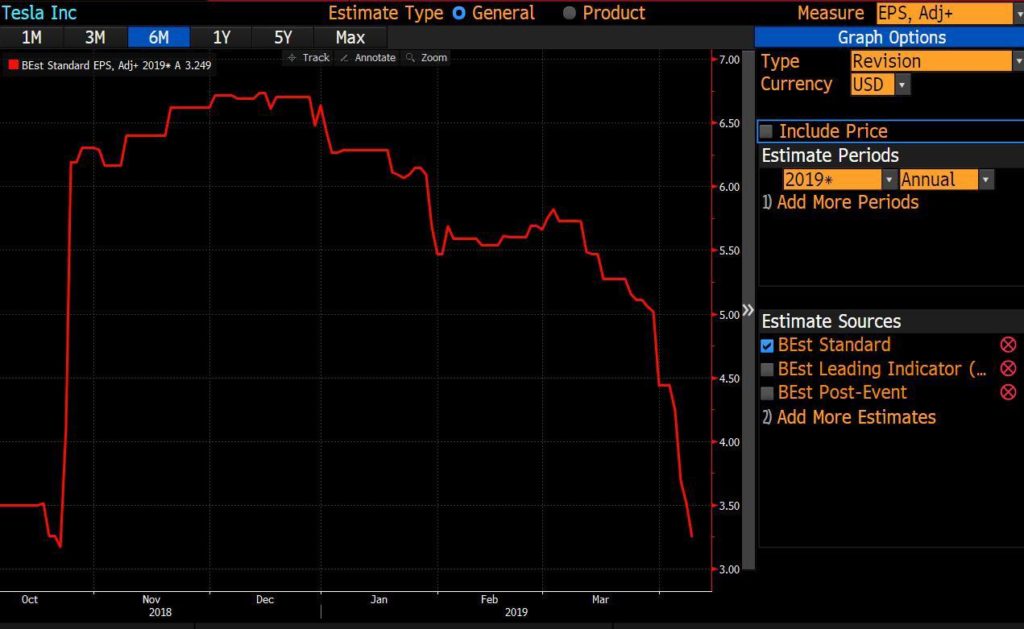 This year’s earnings expectations for Tesla have crashed down from their fantasy levels. At the beginning of the year EPS expectations were over $6.00 for the year, now they have fallen over 40% to near $3.25. Expectations slid due to increased competition in Europe and the company not hitting bullish delivery estimates – the loss of tax credit did not help their bottom line.
  In October of 2018, Tesla reported another rare profit. After 8 quarters of mounting losses, shorts were once again caught on the wrong foot (as you can see above – red circle). Why the sudden turnaround? Unlike almost any other mass car producer, Tesla delivers from their order book. With Model 3 production (finally) at adequate levels, Tesla first started delivering the top range Model 3s, which often go for ~$55K vs a $35K base price. To exemplify, Tesla makes an estimated $3,500 operating profit on the $45K version while it loses some $3,900 on the base Model 3. This is how Tesla showed a rare profit in Q3. Keep in mind, Tesla didn’t just turn profitable, it also showed positive cash flow – or more pain for shorts. This was mainly due to reversals in working capital and tax credits. All this came as huge surprise to the market and the stock ripped higher, as short sellers once again rushed to cover. We MUST look at the Tesla credit (5.3s due 2025). In late October / early November as the stock soared, Tesla’s junk bonds were NOT buying the price action in the equity and lost 4 points (early November to late December)! Sure enough, a few weeks later the stock caught up with the bonds on the downside.
