
“With a cross-asset view (emerging market currencies, eurodollar/Fed funds, gold, and silver); bets on a “one and done” Fed have dramatically outperformed U.S. equities in Q4 and are all pointing to early signs of a softer Fed policy path. Looking down the road ahead, the U.S. equity market will CRASH in 1987 style if the Fed plays tough guy, it’s that simple. Similar to the March 2016 landscape, the market is about to embarrass the Fed yet again. As we have stressed over the last few months, they will capitulate in our view. As we stressed in September, stay long gold GLD and the gold miners GDX.”
Bear Traps Report, November 15, 2018
Join our Larry McDonald on CNBC’s Trading Nation, Wednesday at 3:05pm ET
Pick up our latest report here:
Don’t miss our next trade idea. Get on the Bear Traps Report Today, click hereSpending nearly $1T on deficit overloading tax cuts, then lighting it on fire with 8 rate hikes (nine since December 2015) and an experimental $430B of Fed balance sheet reduction, will go down as one of the most destructive policy mistakes in the history of the Republic. From 2010-2016, central bankers enabled run-away corporate borrowing, now credit markets are telling them they’re pulling away from the steroids far too quickly.
More Rate Hikes?
 There have been far more rate hikes than meets the eye. As we can see above, financial conditions are already as tight as found during the 2015-2016 oil credit crisis / China currency devaluation equity market sell-off. Back then, the Fed went on (rate hike) hold for 12 months. Fed fund futures are now pricing in just under 10% probability of just one rate hike in 2019. The Fed and U.S. economists are saying 2-3, high yield (credit markets) market saying zero. Who do you believe?
Credit Risk Veto of the Fed Policy Path
Credit markets are freezing up, recently companies have NOT been able to raise capital through the $1.6T US high-yield bond market. The first full month since November 2008 (just after the failure of Lehman) that not a single junk bond has been able to price in December.
Redemption
Junk bond maturities will soar to $110B in 2019 from $36B in 2018, according to Moody’s Investors Services. And we expect that number to double to near $200B in 2020. For highly-levered companies who must roll their bonds over when the principal payments come due, a sharp rise in borrowing costs will catch them grossly ill-prepared, it’s a death sentence. When Chair Powell tells you the Fed will hike 2-3 times in 2019, he’s being Pollyannish, to say the least. In the real world, credit market functionality runs Fed policy, NOT backward looking U.S. economic data. If you give us a colossal debt maturity wall vs. a Fed chair, the wall wins EVERY time.
Junk Bond Maturity Wall
2018: $36B
2019: $108B
2020: $191B
2021: $293B
2022: $385B
*Moody’s data, combined leveraged loan and high yield bond maturities. Two to three more rate hikes? Who are they kidding???
Investment Grade Debt Maturity Wall also in the Ugly Category
“In the US, investment grade debt outstanding has grown from $2.3T in 2007 to $6.1T heading into 2019. In the next 3 years, a large load of $1.3T is coming due, which is 3.5x greater than what we faced in 2007. ” With our associate Ed Casey.
*U.S. LOAN FUNDS SEE RECORD $3.53B WEEKLY OUTFLOW: LIPPER
Mr. Powell, are you listening to Leveraged Loans?
 Credit spread contagion on stage here, the beast inside the market keeps moving from one victim to the next. Price discovery in the loan market found religion last week. For most of Q4, while investment grade bonds (see LQD above) suffered a bloody nose, secured bank loans were seen as a safe haven – then prices collapsed after the Fed meeting. Leverage is a very dangerous beast, the larger it becomes the more perfection it demands in capital markets functionality (the ability of HIGHLY leveraged companies and countries to sell investors more bonds, debt obligations). Leveraged loan sales in November dropped to $21B, while there was just $5.1B of high-yield bond issuance. That’s the lowest combined volume of speculative-grade debt supply since February 2016, according to LCD, a unit of S&P Global Market Intelligence. And that was BEFORE the Fed rate hike. December’s new issuance is close to zero, “the betting window is closed, Sir.”
Pick up our latest report here:
Don’t miss our next trade idea. Get on the Bear Traps Report Today, click hereThe True Cost of Rate Hikes, a Fed Smoking in the Dynamite Shed
The global debt markets – especially US credit – have ballooned in size since the financial crisis. If you think of the reasons behind a rate hike (besides reloading the stimulus quiver), they basically boil down to the Fed’s ability to reprice assets and slow capital formation to stave off inflation. The repricing of assets is first felt in the debt markets. The fact that these markets are now substantially larger than they have ever been (having grown at a double-digit clip in corporate credit and even faster in government-issued bonds), makes the impact of even a modest hike exponentially more powerful than ever before! With this fact in mind, Why are U.S. economists sooooo focused on domestic economic data? Their eyes should be on credit risk. This is a major flaw in our view – in the post-Lehman era credit risk has been driving the Fed policy path bus.
It is not hard to calculate the amount of monetary value being repriced by a mere 25 basis point hike and see that it is far more powerful than ever before. The term duration refers to the percentage of gain or loss in bond prices for a given shift in interest rates, usually 100b basis points. So, for instance, a pool of bonds with a duration of 2.5 would have about a 2.5% gain in value for a 100 basis point cut in rates and about a 2.5% loss in value for a 100 basis point hike in rates.
Colossal Losses, Impact of Fed Rate Hike in the Market
One of the most popular bond indices, the Barclay’s U.S. Aggregate, has a market value of $20.9 trillion today. This compares to a market value of $8.3 trillion at the time of the last rate hiking cycle kick-off on June 29, 2006. A look around the world is an eye opener; the Barclay’s Global Aggregate has a market value of $46.2 trillion versus $21.9 trillion on June 29, 2006. Some of this is already priced in of course, but the quick and dirty calculation tells you that for the U.S. Agg, a 25bps hike has 2.53x the impact of a 2006 era move and for the Global Agg, the impact is around 2.36x a 2006 era move in terms of the value of immediately repriced assets. This gives the adage “interest rates up, bond prices down” profound new meaning.
Put another way, the amount of losses by global bond investors in percentage terms for a given hike in rates is around 2.5x as powerful as it was the last time the Fed hiked rates over nine years ago. So might 25bps act a bit more like 62.5bps? Over the last few months, credit markets have been screaming this fact, are you listening?
Economic Data Still Strong? We must keep in mind, there are public and private economists who actively try and sell investors on economic modeling and follow-on equity market impact. Well, this crowd has been embarrassed in recent months. In November, ISM Manufacturing PMI came in with a healthy 59 handle. During the 2015-2016 equity market sell-off, she printed down at 48. There was NO warning for U.S. equities here. Bottom line, listen to credit markets, not economists.
Recession in 2019 or Does that Even Matter?
A 2019 recession will be more than an inconvenience for companies who rely on an easy money gravy train, or access to capital markets to stay afloat. Rolling over the debt during an economic downturn is no fun, especially when rates for high-yield paper shoot up, only adding to the pain of keeping debt on their already stretched balance sheets. “What blows my mind are the U.S. economists who are so focused on backward-looking economic data. With leverage this high, you need perfectly functioning capital markets period. Credit markets ALWAYS trump economic forecasting” said Larry McDonald, founder of the Bear Traps Report. Think of it this way, the St. Louis Fed and Goldman Sachs are both calling for 2.5-2.6% Q4 GDP growth, but does that even matter while companies cannot roll-over sky-high piles of debt?
Interest Coverage Ratio High Yield Junk Bonds
2018: 3.20x
2017: 3.50x
2016: 3.80x
2015: 4.50x
2014: 4.70x
2013: 4.75x
Bloomberg data, with leverage like this, there’s little room for error.
Colossal Losses, Impact of Fed Rate Hike in the Market
One of the most popular bond indices, the Barclay’s U.S. Aggregate, has a market value of $20.9 trillion today. This compares to a market value of $8.3 trillion at the time of the Fed rate hiked rates during the last credit cycle on June 29, 2006. A look around the world is an eye opener; the Barclay’s Global Aggregate has a market value of $49.2 trillion versus $21.9 trillion on June 29, 2006. Some of this is already priced in of course, but the quick and dirty calculation tells you that for the U.S. Agg, a 25bps hike has 2.53x the impact of a 2006 era move and for the Global Agg, the impact is around 2.36x a 2006 era move in terms of the value of immediately repriced assets. This gives the adage “interest rates up, bond prices down” profound new meaning.
Put another way, the amount of losses by global bond investors in percentage terms for a given hike in rates is around 2.5x as powerful as it was the last time the Fed hiked rates over nine years ago. So might 25bps act a bit more like 62.5bps? Recent price action in the stock and corporate bond markets are screaming this fact at us today.
Credit Leads Equities
 From late October to late November, U.S. equities were flat, but junk bond credit spreads over U.S. Treasuries were nearly 50bps wider, or higher in yield. Credit was telling you, there’s more pain ahead for U.S. equities. Goldman Sachs just shaved its growth forecast for the first half of next year, from 2.50% to 2.00%, once again credit markets have been two steps ahead here. Listen to credit risk, NOT economists.
Unintended Consequences
Junk bond companies trying to refinance their hefty debt load, also have to deal with the tax bill passed through Congress and signed by President Trump a year ago. The new legislation raised the cap on how much an issuer could deduct in interest payments from their profits. As a result, highly levered companies, who no longer qualify for the tax loophole, will have less cash to pay back the interest on their bonds. “Diminished ability of highly leveraged companies to service high-interest costs would worsen their refinancing opportunities,” warned analysts at Moody’s Investors Service.
Pick up our latest report here:
Don’t miss our next trade idea. Get on the Bear Traps Report Today, click here Dow Theory Triggers: Above you can see three lower lows in the (yellow) Dow Jones Industrial Average, -10.3% off her September highs and two lower lows in the (white) Dow Transportation Average, -18.3% off her September high.
 One important risk indicator we use is the Index of NYSE stocks % above their 200-day moving average. On Friday, she touched 23%. In the Post-Lehman era, this level has only been breached three times; 2011, 2015 and 2016. US equities as measured by the S&P 500 bounced 31%, 16% and 21% in the six months following these HIGH capitulation levels.
 “In trading, the pain and fear you feel — is in direct proportion — to the size of the opportunity. Buying right NEVER feels good”
 The U.S. economy is chugging along. Gross domestic product climbed a better-than-expected 3.5 percent in the third quarter on strong consumer and business spending, according to Commerce Department figures released Friday. The annualized rate of gains marks the best back-to-back quarters of growth since 2014.
 The GDP picture is loaded with inventory, consumption and government spending, BUT light on investment. The capex (capital spending by companies) boost from tax cuts has been drowned out by tariff / trade headwinds.
 Just five FANG (Apple 13%, Amazon 11%, Microsoft 10%, Alphabet 9%, and Facebook 5%) stocks make up 48% of the QQQ ETF. We witnessed record capitulation volume on Thursday, an 11% draw-down in just six trading days, that’s nearly $700B wiped out across 605 ETFs and funds.
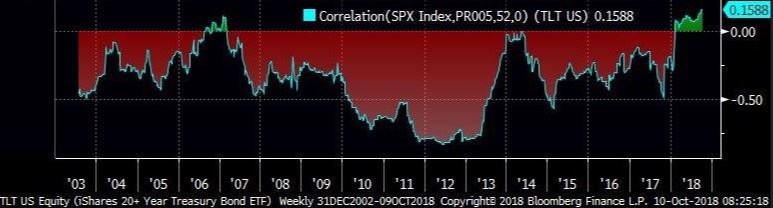 In the past 3 years, there have only been 14 trading days (including today) in which the S&P 500 (SPY) was lower more than 1% and U.S bonds (TLT) were also lower on the day. Keep in mind, eight of these 14 occurrences took place in 2018 alone. Today, stocks are bonds are wearing a very rare positive correlation. Above, see the negative correlation period (stocks DOWN vs. bonds UP)
  In a classic side effect of global tightening in monetary policy, investment-grade bonds dramatically underperformed earlier in the year while equities largely ignored this early warning. As an asset class, investment grade US corporate bonds are far more sensitive to global (tightening) financial conditions. US equities finally woke up to these risks this week.
 Think of the dentist in Cleveland, Ohio with $1M in stocks and $1M in bonds in a portfolio. For the first time in 30 years, he / she is looking at their brokerage statement and seeing NO wealth destruction OFFSET from bonds. We have an eye on credit quality globally (AAA rated corporates / sovereign credits are off 30-40% in terms of the amount of high-quality paper last 10 years). Next, shift your eyes on the debt to GDP in the G20, up from 70% to near 100% (maybe 110%). Then look at the EM dollar-denominated debt issued 2007-2017, in the trillions, there’s a new player at the table trying to sell / refinance a large debt load. All this speaks to a regime change, we’re in the 1-2 inning we believe, more to come.
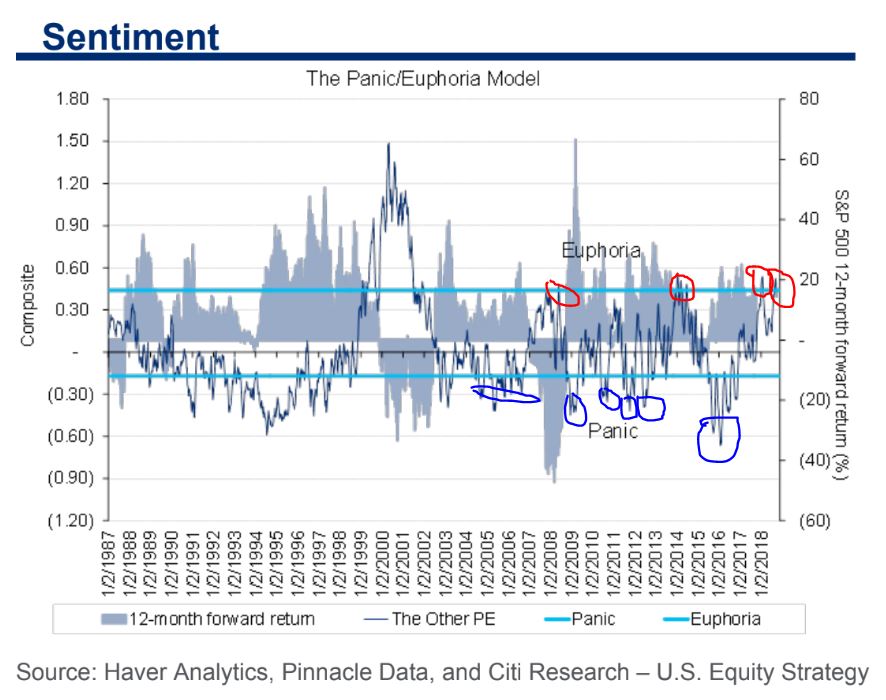
 As the Fed continues their quest for higher rates, something happened on the way to the next rate hike. – regional bank shares entered a “correction” this week. The BKX Index above is 10.6% off it’s January highs and flat since late November. BB&T Corp, M&T Bank, and PNC Financial topped out in late-February and are now under “death cross” formations.
 With mortgage rates at 84-month highs, the ITB iShares U.S. Home Construction ETF is 24% off its highs, in a deep bear market. At the same time, global oil prices have surged from $26 to $80 a barrel since 2016. Oil’s plunge created a massive $1.8T or 2.2% of global GDP income transfer between oil consumers and oil producers between 2014 and 2016, NOW that’s being reversed with major implications. Consumers globally are dealing with higher bond yields, higher oil prices and in many cases MUCH weaker local currencies in emerging markets. The global consumption DRAG is something we have NOT seen since at least 2008.
 The trade war impact on China’s economy is now coming into focus. The official and Caixin manufacturing PMIs both are in plunge mode, missing expectations in September. The latter falling to 50 — the threshold separating improving and deteriorating conditions, Bloomberg reported. The declines were broad-based across major components. Most notably, new export orders registered sharp drops, signaling the crunch from U.S. tariffs on $50 billion in Chinese goods over July and August, followed by another $200 billion in late September. The non-manufacturing sector was among a few bright spots. The private survey showed growth in the factory sector stalled after 15 months of expansion, with export orders falling the fastest in over two years, while an official survey confirmed a further manufacturing weakening. Taken together, the business activity gauges – the first major readings on China’s economy for September – confirm consensus views that the world’s second-largest economy is continuing to cool, which is likely to prompt Chinese policymakers to roll out more growth-support measures in coming months.
 Here’s our interview with the
 In our view, the new subprime risk is found in the emerging market’s embedded leverage. There is a lot of concern about emerging markets debt, especially about the amount of Dollar denominated debt. For instance, the Chinese banking system is $44 trillion in size. That’s almost three times the US banking system and the Chinese economy is already weakening. Total global debt (sovereign, corporate and household) has surged by nearly 75% since Lehman’s failure ten years ago, per the McKinsey Global Institute. The great enablers, Central Banks have blood on their hands in my view.
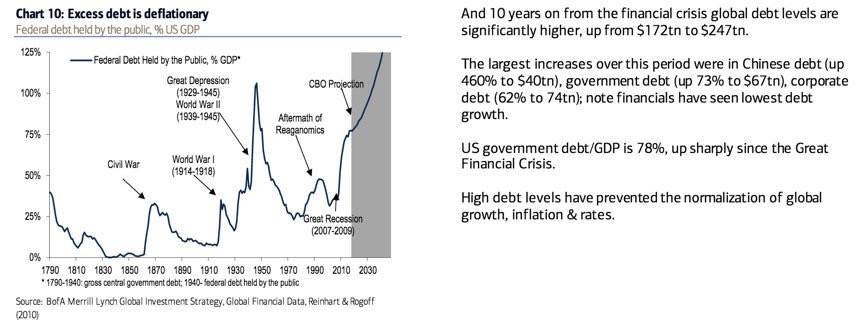
 It’s not just China. It’s Turkey, it’s India’s banking system*, it’s Brazil, it’s all these countries which have issued so much debt. Since Lehman, there are trillions and trillions of new Dollar and Euro denominated debt issued globally and now it’s starting to come into a massive default cycle. Ten years after Lehman’s failure, global debt levels have surged from $170 trillion to $250 trillion, per BofA. At the end of the day, the Federal Reserve and the European Central Bank are going to get the blame because they have been far too accommodative. In the U.S., corporate credit quality is in the worst shape.
 *India’s banking system’s overhang of (near $400B in our view) bad loans is another full-blown crisis that stymies growth and shows no signs of an early resolution.
 We are going to see this across all the FAANG stocks. It’s going to get really ugly and it’s probably going to happen in the next six to nine months. It’s going to be close to a 20% drawdown for the entire US stock market. But the FAANGs, these crowded stocks, are going to drop 30 to 40%.
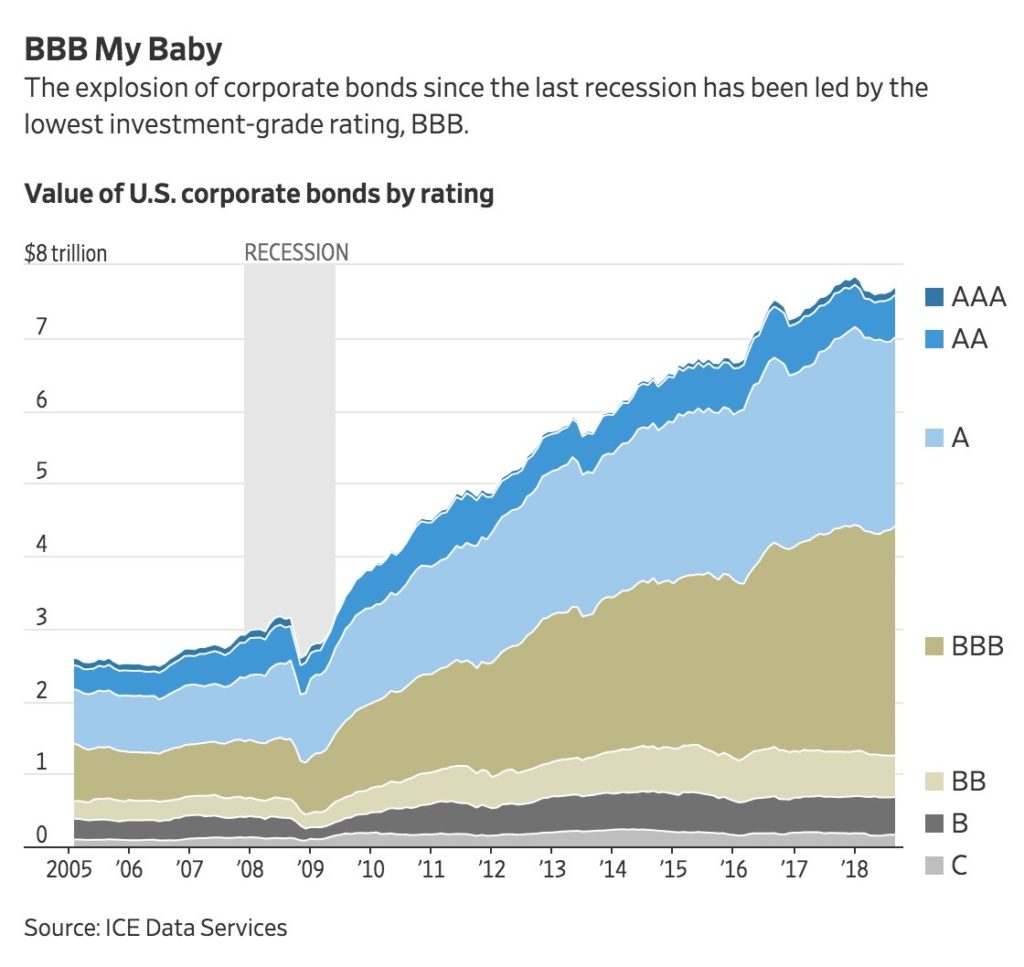 The Great Risk Transfer: Over the last ten years, all the risk has been transferred from the large US investment banks like Lehman, over to corporate (companies, BBBs above) and sovereign (government) balance sheets.
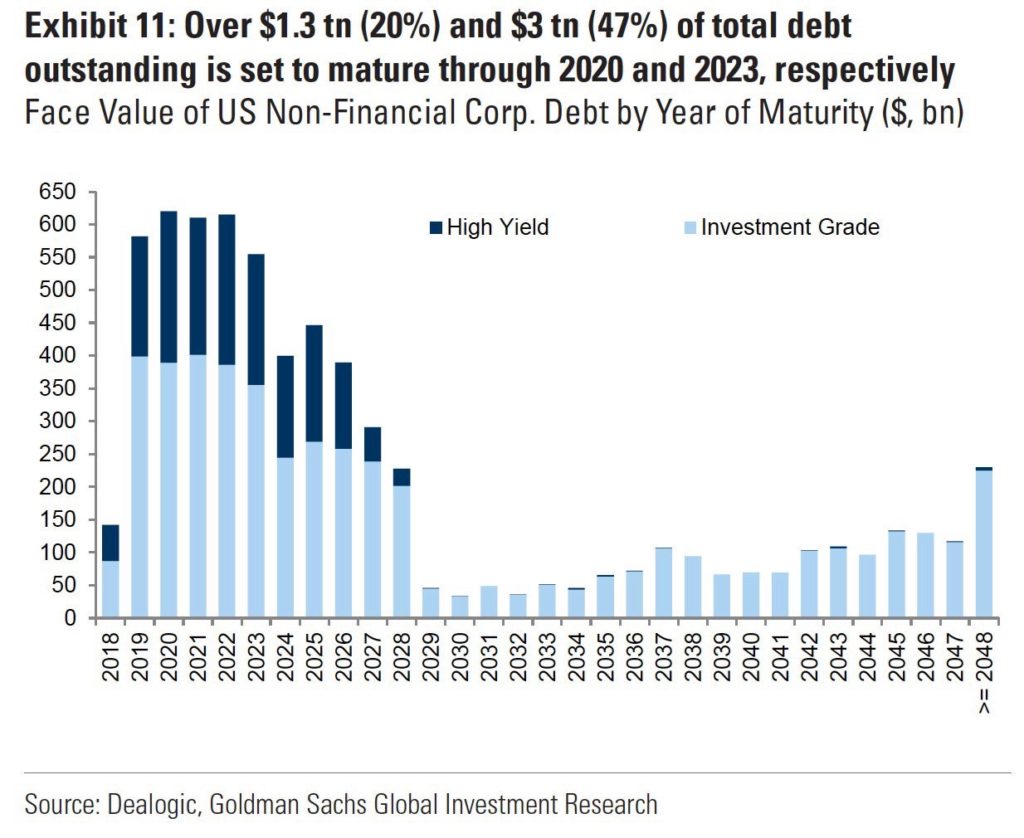 While the White House is playing games with tariffs and the global economy, $1.3 trillion of US corporate debt is coming due in the next two years. McDonald HAS NEVER seen a maturity wall of redemptions of this colossal magnitude.
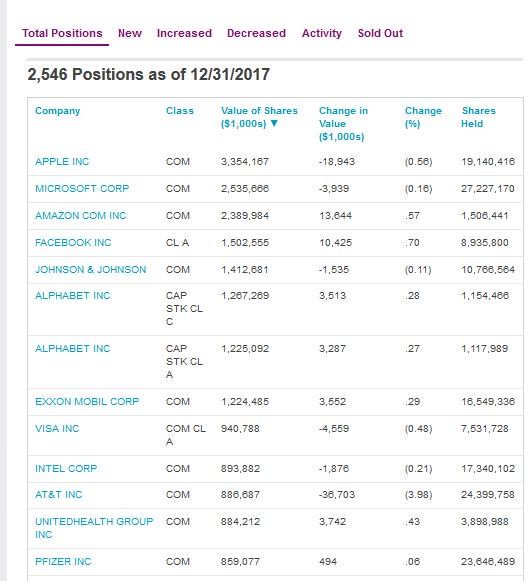 Right now, the most leveraged organization on earth might be the Swiss National Bank. They own all these FAANG stocks and it’s really concerning because the people of Switzerland are going to lose a lot of money when this crowded trade blows up. Just look at how much of that central bank’s money is in equities. It’s obscene. They don’t understand. In the last five years, $2 trillion has gone into passive asset management and there’s an untested liquidity mechanism when people head for the exits. A lot of that money has to go into the FAANGs. So, the Swiss National Bank has made a lot of money because of this passive revolution. They probably think they’re really smart. But they’re just benefiting from this move here in the United States where so much money has gone into passive strategies. Now, the Swiss National Bank is sitting on all these profits and they are going to look like complete imbeciles when the FAANGs blow up.
