Join our Larry McDonald on CNBC’s Trading Nation, Wednesday at 3:05pm ET
Pick up our latest report here:
Don’t miss our next trade idea. Get on the Bear Traps Report Today, click here
Special thanks to ACG Analytics
Blog updated May 29, 2018 at 7:44am ET
*FIVE STAR HEAD DI MAIO DEMANDED THE IMPEACHMENT OF PRESIDENT MATTARELLA OVER HIS VETO
*SALVINI SAYS WOULD SEEK FULL MANDATE IN NEW ELECTIONS
*SALVINI SAYS ITALY GOVERNMENT CAN’T START IF CONDITIONED
*SALVINI: ONLY ITALIANS DECIDE THEIR FATE, NOT FRENCH OR GERMANS
*ITALY’S DI MAIO, SALVINI PRESSED PRESIDENT ON SAVONA: ANSA
*ITALY’S PRESIDENT HAS VETOED SAVONA AS FINANCE MINISTER: ANSA
Italy’s UniCredit Bank Equity
 Italian banks led European financial stocks lower as the growing likelihood of new elections shook investor confidence. Banca Monte dei Paschi di Siena SpA, the habitually-volatile state-rescued bank, led declines with a drop of as much as 7.8 percent. The eight worst performers on the Bloomberg Europe Banks Index were all Italian lenders as of 12:07 p.m., with UniCredit SpA losing almost 4 percent and Intesa Sanpaolo SpAdown about 3 percent. At least a part of the pressure on equities came from the bond market. The yield on Italy’s benchmark 10-year sovereign bonds surged again on Monday to over 2.60 percent, it highest in nearly four years. – Bloomberg
Breaking: Italy Sells $5.7B of 183-Day Bills, Yield 1.213%
Previous T-Bill Sales Below
May: +1.21%
April: -0.42%
March: -0.43%
Feb: -0.40%
– This is an incredible surge in the cost of short-term financing as of Tuesday Morning May 29, 2018.
Two Year Bond Plunge – Yield Surge in Italy
 Italy 2 Year Bond Yields now through the US for the first time since November 2014.
10 Year Bond Yields and Recent Change
US: 2.80% (-30bps)
Australia: 2.68% (-24bps)
Italy: 3.16% (+143bps)**
Canada: 2.30% (-23bps)
UK: 1.22% (-34bpss)
Spain: 1.64% (+47bps) **
France: 0.68% (-32bps)
Germany: 0.29% (-47bps)
Bloomberg data
Rough Weekend
As the cost of credit default protection is surging on Italian banks, the Five Star Movement’s (M5S) Luigi di Maio and Lega’s Matteo Salvini managed to reach an accord on their coalition’s program. Likewise, the structure of a future cabinet and the candidate for the premiership are on the “Italy First” agenda. All that is left for the two is to seek out the mandate to rule from President Sergio Mattarella. Over the weekend, discussions have taken a sharp turn for the worse as all sides failed to agree on a new finance minister. Some in Lega party leadership insist on a Euroskeptic head of finance, others want a more centrist figure. Together, the M5S and the League (Lega) have an impressive majority of 37% in the 630-seat Chamber of Deputies, though a slimmer edge in the Senate. Their standing is up over 200% in recent years as the Populists have been able to steal political market share from center-left parties in Italy. See our The Bear Traps Report with Larry McDonald; Tocqueville’s Italy – January 25, 2018_
Populists Surging in the Polls, Can You Wonder Why???
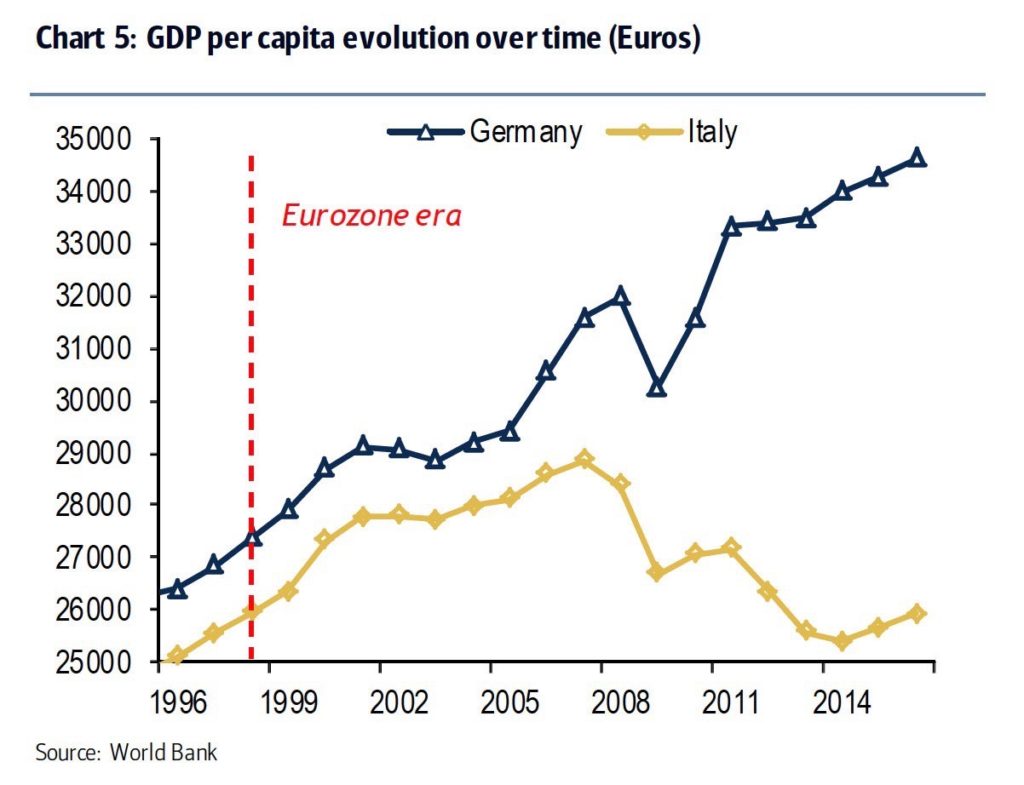 As you can see above, Italy’s raw deal on the Euro is an open wound – it can’t be swept under the rug for much longer. It’s an #ItalyFirst moment indeed. A recent poll for the daily La Repubblica put support for the Trump-like Populist League (or Lega) at close to 22 percent, up from 17 percent in March, which would make it Italy’s second most popular party. Support for the League’s (Lega) largest rival, 5Star, stayed steady at 33 percent, while support for the incumbent center-left Democratic Party dropped from 19 percent to 18 percent. Bottom line, populists now control 55% of the vote – Euroskeptic sentiment is on the rise.
“Italy First. Either this government gets started in the next few hours and we start working, or we might as well go and vote again and get an absolute majority. Although it would be disrespectful to Italians if this government doesn’t get started because it’s unpleasant to someone in Berlin or Brussels.”
Lega Leader Salvini told a rally near Bergamo in northern Italy late on Saturday (Bloomberg reported).
” President, Sergio Mattarella said he could not countenance their (Lega / Five Star) selection of an economics minister who he said threatened to take Italy out of the eurozone. He said even the threat of leaving the euro would have dramatic consequences on the markets, costing Italian families and investors money and its young people opportunities.” –
New York Times, reported Sunday evening, May 27, 2018
A Trump 2.0 in Italy
We believe the Salvini’s (Lega) surge in popularity is on par with Trump’s rise in 2016. If the Lega star was a stock, you would want to be long of it. Sunday evening, the leaders of the Five Star Movement were already discussing Mr. Mattarella’s impeachment, while Matteo Salvini, the leader of the League, who would not budge on his choice for a eurosceptic economics minister, and who has seen his popularity rise during the tortuous negotiations, is eager to go to early (new) elections.
Near-Term Debt Coming Due, a High Mountain
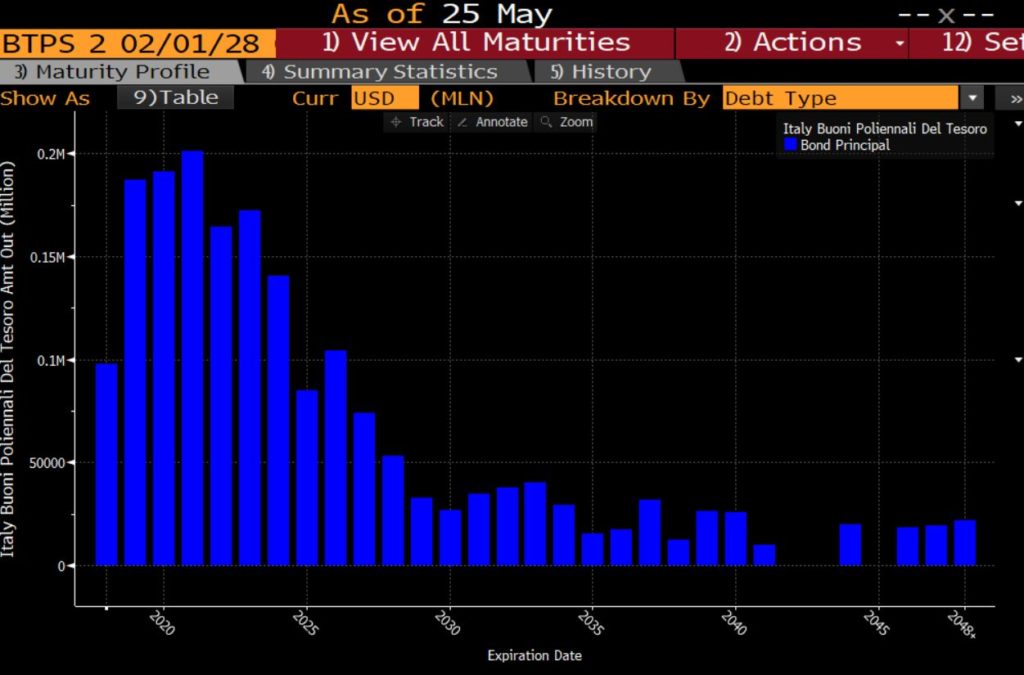 Populists in Italy (Lega – 5Star) calling for the quick deportation of an estimated 500,000 immigrants (Sky News) from Italy, with $2.4T of debts and $2.0T of economic output, they question the financial sustainability of EU migration policy? The cost of default protection on Italy’s bonds is climbing the most since dark days of the European debt crisis. Political uncertainty has unearthed risks inside the financial system of the southern European nation. The five-year Italian credit default swap rose about 42 basis points last week, the most since 2012, according to data compiled by Bloomberg. Populist leaders abandoned their attempt to form a government at the weekend after the president rejected their choice of a euro-skeptic finance minister, while Moody’s placed the country’s ratings on review Friday for a possible downgrade.
“Italy has over $800B of debt maturities coming due between now at 2022, that’s nearly 40% of their total $2.4T debt load – some bills have to be paid here indeed.” – The Bear Traps Report, January 2018
Bonds for Sale – Italy Needs Friendly Capital Markets
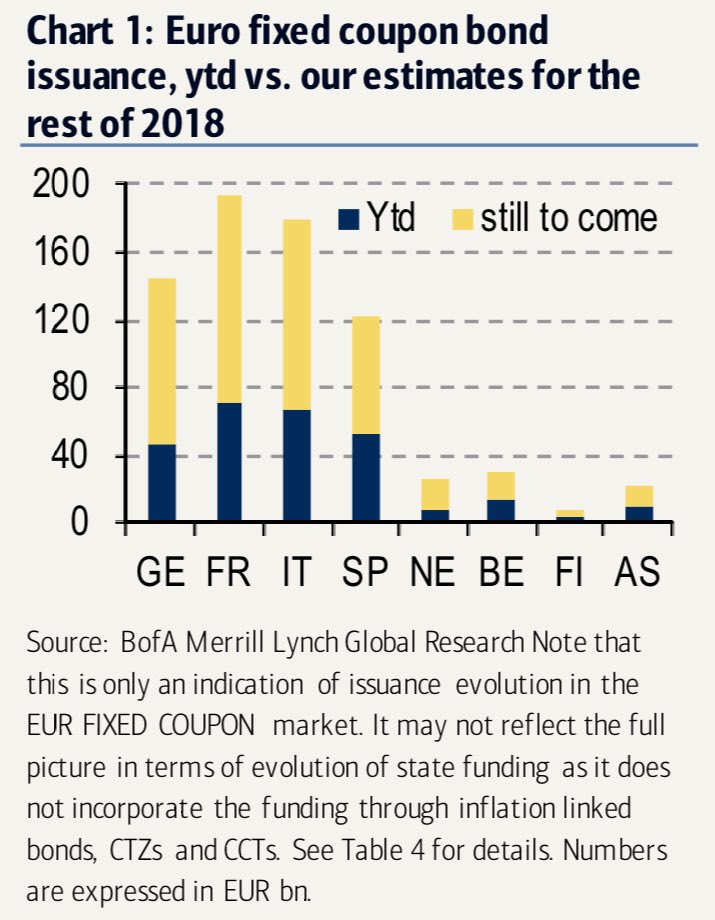
Highly in need of friendly (wide open) capital markets, Italy needs easy access to financing. If the beast inside the market continues to turn on Italy, this will place Mario Draghi’s ECB in a very difficult spot. Italy still needs to sell bonds worth $130B in the markets this year, according to BofAML. This figure will ONLY increase if populists get their way on an aggressive fiscal spending plan with tax cuts. We MUST remember, there are rules within the ECB’s “capital key.” The central bank cannot purchase large amounts of Italian debt relative to other EU countries. These capital key limits will be stretched to high-stress levels in the coming months. Draghi will need a sign off from Germany on additional capital key expansion for Italy. ” Angela, please get out the checkbook.” The rise of “Germany First” populists in Deutschland presents political stress on the other side. The AfD party has surged from 1% to 18% since 2013. Populists in German (Afd) and Italy (Lega) both have their hands on a very large rubber band and they’re walking backward at an accelerated rate.
Weekend Drama, Selection of New Finance Minister a Focus
According to Article 92 of Italian Constitution, it is the president who appoints ministers “following PM’s proposals,” (Lega wants Savona in a large way).
“Italy’s novice premier-designate Giuseppe Conte struggled to form a populist government throughout the weekend, stranded between a president who objects to a eurosceptic candidate for the economy ministry and a coalition ally threatening to force early elections. Conte, 53, is working on a list of ministers to propose to Sergio Mattarella, 76, the head of state whose task it is to name the government team. The talks are likely later Sunday (May 27), according to an official of the anti-establishment Five Star Movement who asked not to be identified because the plans weren’t public. Economist Paolo Savona*, 81, a candidate for the economy ministry, said in a statement on an Italian website on Sunday that he was in favor of a European political union and urged full implementation of objectives in the 1992 Maastricht Treaty. Efforts to form a populist government could be jeopardized by a tussle over Savona between the president and Matteo Salvini of the anti-immigrant League, which is Five Star’s junior partner, and lead to early elections possibly in the fall. The populists’ pledges of fiscal expansion and tax cuts would defy European Union budget rules, and the Italy-Germany 10-year yield spread reached the widest since 2014 on Friday.” – Bloomberg
* Savona, a company executive and former industry minister, has come under fire both for repeatedly calling on the government to plan for a possible euro exit and for his criticism of what he sees as German dominance of Europe. Mattarella, a former constitutional court judge, insists on his right to appoint government ministers, without pressure from outsiders. In our view, we’re looking at a Savona moment. If the new Italian government agrees with populists (Lega – 5Star) and chooses him as finance minister, it substantially raises the probability of a destructive EU conflict with Italy. It would be gasoline on the “risk-off” fire. If EU pressure prevents the populist agenda from moving forward, it will lead to a large surge in the polls for Lega – 5Star in the next round of elections (coming this year). That’s bad news for markets as political pressure on the ECB is surging to it’s highest level in years.
Eurozone Debt Load
Italy: $2.2T
Spain: $1.0T
Germany: $860B
Ireland: $156B
Portugal: $150B
Greece: $60B
Bloomberg data
So, Draghi (ECB) expands the capital key / bond buying mechanism for Italy? And the others??
A Tale of Two Banks
 Politics is driving asset prices here. After months of House delay in sending a Dodd-Frank regulatory relief bill to the President’s desk, President Trump signed the legislation this week. As you can see above, KRE Regional Bank ETF has been pricing in the good news for months. The bill is identical to the version which passed the Senate in March and provides relief aimed at community banks, while raising the systemically-important financial institution (SIFI) threshold from $50 billion to $250 billion (although the Federal Reserve may still subject banks between $100-250 billion for enhanced supervision). Among other provisions, mortgages held by banks with under $10 billion in assets are automatically designated as “Qualified Mortgages,” and community banks which underwrite fewer than 500 mortgages a year will be largely exempt from Dodd-Frank mortgage rules. The amended law also provides regulatory relief for appraisal requirements in rural areas, as well as broader relief to community banks in having to furnish Home Mortgage Disclosure Act (HMDA) data and lengthens the examination cycle for well-capitalized banks from 1 year to 18 months. – ACG Analytics.
Pick up our latest report here:
Don’t miss our next trade idea. Get on the Bear Traps Report Today, click here
A Placeholder President
Mr. Di Maio and Mr. Salvini presented the coalition’s Prime Minister (PM) pick to the President this week. The candidate, Giuseppe Conte, a law professor, is without governing experience. By selecting a political novice for the premiership, Di Maio and Salvini improved their chances of exerting influence on the likely future PM.
Deficit Spending and Tax Cuts
The coalition program plans to bolster the country’s spending by killing pension reform, introducing a flat tax, and by increasing expenditure on maritime migrant interception programs. While the major points of controversy were scrapped from the final proposal (the final version does not mention leaving the eurozone, or a plan to get bonds purchased as part of the ECB’s QE program), potentially fiscally worrisome measures remain.
Cost of Credit Default Protection, on the Rise
 Clearly, the new governmental program will lead to a clash with Brussels. The cost of credit default protection is surging in banks with heavy exposure to Italy. We haven’t seen this kind of credit risk divergence between EuroZone and US banks in six years. Our Index of 21 Lehman Systemic Risk Indicators is rising at the fastest pace since 2012. See our full report on The Bear Traps Report with Larry McDonald; Tocqueville’s Italy – January 25, 2018_
Cost of Credit Default Protection (Updated April 29, 2018)
Deutsche Bank: 306 (+101)
Intesa Sanpaolo: 397 (+225)
UniCredit: 396 (+230)
CommerzBank: 224 (+80)
Santander: 244 (+140)
Soc Gen: 180 (+87)
BNP: 178 (+88)
UBS: 102 (+28)
*(change since April), sub CDS, in basis points, Bloomberg data
Keeping Financial Commitments
The agenda is likely to divert Italy from abiding by EU fiscal regulation (i.e. the Fiscal Compact). France has already issued a preemptive warning with French Economy Minister Bruno Le Maire stating: “The stability of the eurozone will be at stake if a populist new government in Italy fails to keep its financial commitments.”
Italy’s 50 Year Bond Price Plunge
 Italy’s 50 Year Bond plunged 12 points last week. In October 2016, ‘Italy’s $5.6 Billion Sale of 50-Year Bonds Beats Peers’. Italy sold five billion euros ($5.6 billion) of the securities, exceeding deals by Spain and France for similar-maturity bonds. The country became the latest in Europe to issue super-long bonds, following debt agencies in Belgium, France, Ireland and Spain taking advantage of historically low-interest rates made possible by the European Central Bank’s 1.7 trillion-euro stimulus program. The ECB, whose asset purchases were expected to run to at least March 2018 (now at least March 2019), has acquired more than 900 billion euros of debt just from the Italian, Spanish and French governments. Political risk continues to fuel market volatility and uncertainty in the sovereign bond market, especially with regard to, short-term security issuance aimed at covering the state suppliers and tax rebates–which, if implemented, could cost the Italian taxpayers more than 5% of the Italian GDP.
Stocks in Italy, 10% off their April Highs
 Equities in Italy are approaching key technical levels.
Italy’s Baa2 Rating May Be Cut by Moody’s
 Moody’s says the key drivers for the placement are the significant risk of a material weakening in Italy’s fiscal strength and the chance that the structural reform effort stalls. Italy’s long-term and short-term foreign-currency bond and deposit ceilings remain unchanged at Aa2 and P-1, respectively. “What’s the point of going to vote if it’s the ratings agencies that decide?” Luigi Di Maio, head of Five Star said Sunday in frustration. He believed financial stress in markets played a roll in the veto of their proposed Finance Minister Paolo Savona.
No Strings Attached
The coalition agreement is not a legally binding treaty—the two populist heavyweights could resort to resuscitating the more radical among the scrapped measures in the future. Even though the coalition partners left out of their final program some more drastic measures, there was an original proposal which contained a draft to explore ways of leaving the euro (as well as recommended ECB debt jubilee, or forgiveness). Calling for the new government to stick to a responsible budgetary policy, the vice-president of the European Commission, Valdis Dombrovskis, noted that Italy’s borrowing was proportionally the highest of any euro-zone state except Greece.
Regime Change: Eurozone Equity Market Vol Crosses the U.S.
 For the first time in a year, we’re seeing the cost of equity volatility protection in Europe surge through that of the U.S. This is impressive since this year’s (White House trade and Fed interest rate) drama in equity markets has been U.S. centric. This speaks to a regime change in risk management to a more Europe leading focus moving forward. In the 2010-12 period, for months European credit risk moved well ahead of U.S. equity volatility. A solid leading risk indicator indeed.
Pick up our latest report here:
Don’t miss our next trade idea. Get on the Bear Traps Report Today, click here
A Back Away from High Drama, for Now?
The program has already inflicted High Drama on EU member states, especially within the eurozone. While M5S and Lega claim that the mini-BoTs proposal is not a veiled attempt at introducing a shadow parallel currency, many seem to doubt the honesty of their intentions. We witnessed this dangerous political gamesmanship during the early stages of the Greece crisis in 2010. When tensions are high, populist politicians in some cases leak sensitive parts of their agenda. Almost as a trial balloon, they are testing both the markets and EU political leadership’s reaction process. EXPECT A LOT MORE OF THIS TO COME.
The Di Maio-Salvini-Mattarella meeting will provide clarity on the new M5S-Lega administration, and reveal details on the coalition’s future program. It is not certain that the new government will actually move to implement all of the policies enumerated in the contract. With a small majority in parliament, it will be very difficult for the future government to pass radical legislation. Furthermore, President Mattarella retains the right to veto proposals.
Euro, Broke the Uptrend Line going back to 2014
 Deutsche Bank bailout rumors, falling PMIs (economic data), Populism in Italy and government stability problems in Spain have all taken the Euro down to 1.16 from 1.25. Spain’s opposition socialist party has filed a no-confidence motion against the prime minister, Mariano Rajoy, a day after his governing People’s party was found to have benefited from an illegal kickbacks-for-contracts scheme.
Full Term?
The new cabinet could be sworn in before the end of this week. The process would be finalized by a vote of confidence in both the Senate and the Chamber of Deputies. ACG Analytics does not believe that a M5S-Lega government can survive for a full term—the arrangement is likely to have a limited shelf-life, as the notable policy differences between the two parties and inevitable backstage influence of Berlusconi’s Forward Italy party on Lega is certain to exacerbate the tension between them.
Pick up our latest report here:
Don’t miss our next trade idea. Get on the Bear Traps Report Today, click here
Prime Minister nominee Conte served on the Board of Directors of the Italian Space Agency as a legal consultant to the Rome Chamber of Commerce, and as a supervisory board member to a number of insurance companies going through bankruptcy.
Two Year Bond Yields, Screaming Higher in Italy – 2012-2018
 Italy two year bonds, moving from -0.32% in early May to +0.48% this week. We witnessed the largest yield spread differential between Italy and Spain in over 5 years. Systemic risk is on the rise.
Further details of the coalition agreement cover:
“Parallel currency”: The new government plans to launch mini-BoTs, controversial securities similar to a parallel currency, as part of the administration’s plan to ramp up expenditure. These short-term securities would be used to pay overdue tax rebates and state suppliers.
Flat tax and universal income: The Lega made its flat tax policy for companies and individuals a part of the contract, with two tax brackets at 15% and 20%. The M5S inserted its basic income plan into the program, proposing a EUR 780 monthly compensation paid to those with no revenue.
EU policy: A number of measures introduced calling for the renegotiation of EU treaties and the EU’s economic regulation on several issues, including the single currency. Both parties pledged to tackle smuggling networks and illegal migration, calling for a new debate in Brussels on European migration. Furthermore, the program calls the immediate withdrawal of sanctions against the Russian Federation.
Pension reform: The program envisions the gradual scaling back of the “Fornero” pension reform.
Sovereigntist economy policy: The program aims to implement a legal minimum wage (not yet specified), ramp up savings protection, increase the responsibility of banking authorities, prevent the sale of Alitalia, and re-negotiate the Turin-Lyon high-speed railway project.
Pick up our latest report here:
Don’t miss our next trade idea. Get on the Bear Traps Report Today, click here

 Average hourly earnings jumped by 2.9 percent, above the 2.7 percent increase expected. The unemployment rate held near a generational low of 3.9 percent. The wage growth was the highest since April 2009.
 Average hourly earnings rose 2.9 percent for the month on an annualized basis, while nonfarm payrolls grew by 201,000. Economists surveyed by Reuters had been expecting earnings to rise 2.7 percent, payrolls to increase by 191,000 and the jobless level to decline one-tenth of a point to 3.8 percent.
 Italy vs. German 10-year bond yield spread is NOW through the Memorial day weekend wides, what a way to end the summer. The VIX Chicago Board Options Exchange Volatility Index touched 17 during the late May drama out of Italy, compared to less than 14 today.
 As the cost of credit default protection exploded higher on Italian banks in late May, the Five Star Movement’s (M5S) Luigi di Maio and Lega’s Matteo Salvini reached an accord on their coalition’s program. Likewise, the structure of a future cabinet and the candidate for the premiership were on the “Italy First” agenda. Over Memorial Day Weekend, discussions took a sharp turn for the worse as all sides failed to agree on a new finance minister. Some in Lega party leadership insisted on a Euroskeptic head of finance, others want a more centrist figure. Together, the M5S and the League (Lega) have an impressive majority of 37% in the 630-seat Chamber of Deputies, though a slimmer edge in the Senate. Their standing is up over 200% in recent years as the Populists have been able to steal political market share from center-left parties in Italy. See our
  Tesla equity investors obsessed with the stock price are measuring risk-reward with just a piece of the picture. Those you are NOT on top of the entire capital structure are sadly mistaken. In early April, with Tesla junk bonds (5.3% due 2025) near 87 3/8 the equity was trading at $252, today the relationship is 87 3/8 vs. $319, that’s a $70 premium in the equity vs. the credit. After just one-quarter of positive free cash flow since the fourth quarter of 2013, Tesla has $1.3B in debt maturity wall over the next 12 months. After the ferocious burn, cash in the bank is down to $1.3 after backing out $942 million of customer deposits on cars.
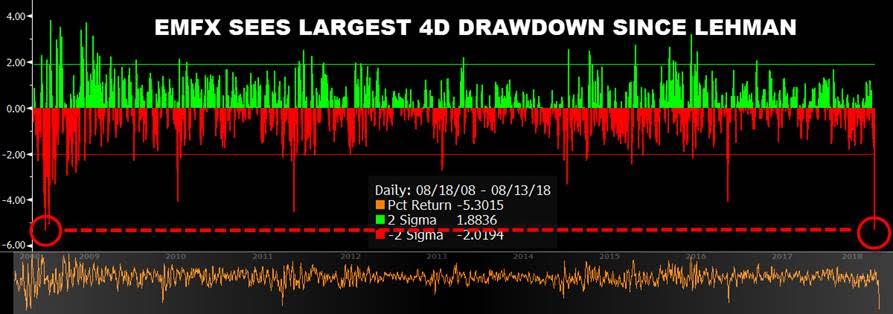 The emerging market foreign exchange basket just witnessed its largest 4D drawdown since Lehman. That’s a -5.3% shift for a 5.2 standard deviation move over a ten year period. This is an exceptionally powerful move which has NOT come to us without follow-on implications.
 Turkish Credit Default Swaps – a key instrument investors use to insure against financial turbulence – surged to their highest since the 2008 global financial crisis as the lira took another sharp dive in world currency markets. Five-year Turkish CDS jumped 78 basis points to 529 basis points, data from IHS Markit showed.
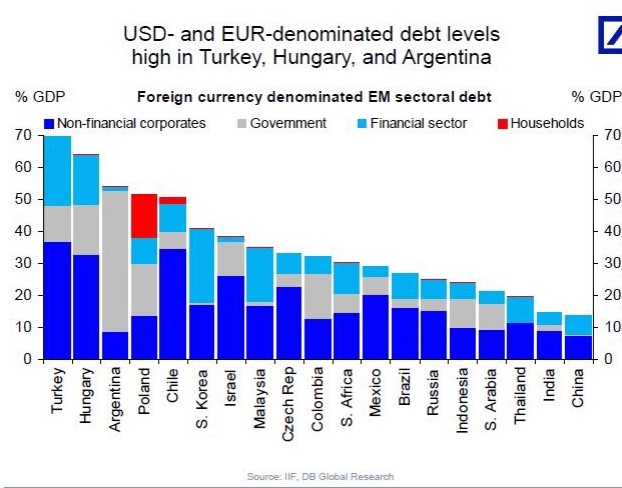 There’s a “Price to Pay” for the easy money Gravy Train which has come out of central banks. Thanks to a Reckless Fed and ECB, Turkey was able to pile up loads of debt – NOT denominated in Lira BUT Dollars and Euros, TURN OUT the Lights. The likeness of 2018’s Turkish credit crisis and the Asian credit crisis of 1997 is very real. If you think of Turkey’s external debt near $450B, that’s nearly 57% of GDP. Next, add on colossal corporate debt layers (see above) – you’re in a HIGHLY unsustainable neighborhood, near 70% of GDP. Back in 1997, Thailand’s external debt was $110B or 64% of GDP, the panic that followed rocked global markets. Over the last month against the US dollar, Turkey’s lira -48% (since July 6th) while one month into the Asian financial crisis the Thai baht was -24% against the US dollar. In rare company – the lira’s recent collapse exceeded daily losses during Russia’s 1998 default and Brazil’s 1999 real crisis.
 In June, in a rare public tongue-lashing, the Bank of India governor pleaded for the US central bank to relax balance sheet tightening plans, they didn’t listen.
 The Turkish Lira has plunged against the dollar to record lows this week, fueled by concern about the nation’s worsening relationship with the U.S. and authorities’ ability to anchor the nation’s assets. With close to $250B of US Dollar and Euro denominated DEBT, every 1% move lower in the Turkish currency brings a nasty 5 billion Lira interest coverage problem, it’s good night Irene.
 In nearly every substantial macro-driven risk-off period, as the crisis kicks off US equities ignore the drama. There’s a beautiful point in every market cycle; macro takes over lazy thinking. It’s a unique, special place in which all participants have to dig deeper into what’s actually going on within the solar plexus of the global economic system. WE ARE THERE RIGHT NOW, peace. Clients are asking if this is 1998 all over again? We say yes. A Lira move near seven (close to a 6 handle now) wipes out most of the equity in Turkey’s banking system, and that’s on a $1T economy. Contagion? EU banks are 7% – 10% lower this month!
 Europe is facing BOTH US sanctions and tariffs on their major trading partners (China, Turkey, and Russia). Above all, Europe’s banks are holding the bag – that’s the problem. Here are the bag holders. As of Q1 2018 Spanish bank exposure to Turkey 82.3bn dollars, France 38.4, UK 19.2, US 18, Germany 17.1 Italy 16.9 Japan 14. Switzerland 6.3 Canada 1.2 Austria 1.1. Portugal 0.3. Turkey’s Lira touched a record low of 7.23/USD, the Argentina peso and Brazil’s real reached their weakest point in a month, while the Russian ruble plunged to its lowest level in two years – DEFAULT risk is RISING fast.
 There’s clearly a flight to quality into German bunds, more disturbing is the price action in Italy’s yields moving higher on the heels of Turkish drama. Yields on two-year securities climbed to the highest levels in more than a week as stocks worldwide declined following a 29 percent tumble in Turkey’s lira this month. Bloomberg noted the Italian 10-year spread over German bunds hit the highest since May. Deputy Prime Minister Luigi Di Maio was reported as saying in an interview Monday that his country won’t be subject to an attack by speculators.
 Foreign banks in Turkey are exposed to the local government debt for $120 billion: French and English banks are first in line, with $40.4 and $23.9 billion respectively. – BIS Data. At the same time, momentum is building in the US Senate for additional sanctions punishing Russia for election-meddling. The run-up to the U.S. midterms in November is a critical period for U.S.-Russian economic relations. There’s clearly a Euro impact here. Not to mention Germany’s largest trading partner in China facing tariff risk.
 Too many investors are hiding out in US equities. Tariffs on China, US sanctions on Turkey and Russia – that’s over $15T of global GDP under substantial stress. It would be nice if the US equity market was on an island, protected from the global economy – but that’s not the case. Turkey’s exports to Russia soared 52.5% last year, up to nearly 6% of GDP. As a result, US sanctions on Russia just add to the Turkish economic dilemma, it brings DOUBLE trouble default risk. US Russia sanctions + Turkey Sanctions = Rising Credit Risk.
 “One of the side effects from the 2009-17 period of “global monetary radicalism” is found in the extreme financialization of the developed world’s economy. In the U.S., CFOs (corporate financial officers) have been incentivized to become financial engineers. In recent years, capital investment has been two standard deviations below previous economic recoveries. “Secular stagnation,” low growth rates, paltry interest rates, and worsening demographics, all favored an outperformance of “capital” over “labor.” In these periods, financial assets – like real estate, stocks, and bonds – outperform hard/soft assets like commodities. For U.S. companies, capital investment and other “real” economy-related risk-taking, offered very poor rates of return as the economy operated below its already low level of potential. To keep shareholders pacified, financial engineering through raising low-cost debt to fund share buybacks, ruled the land in recent years. Today, for the first time in nearly a decade, we have a sharp surge in fiscal spending, while the U.S. is operating above trend, and demand for labor (wages, capex) is picking up. Bottom line: we see a cyclical shift into a new regime. As central banks shrink their balance sheets, hard/soft asset (commodities) will outperform relative to overly expensive “financial assets.” This is a freight train coming at us – the only question remains – who’s getting on? We expect this under-loved asset class (commodities) to show leadership in the new regime. In our view, the global QE (asset purchases, quantitative easing, 2009-17) period marked the near term top of “financialization” and its gradual withdrawal into a late cycle landscape will lead to a “rebalancing” between cheaper commodity-related assets and overly expensive financial assets. The tipping point of this secular shift is the central bank taper and tightening process.”
 Bottom line, the parabolic (see the white line above) outperformance of the consumer discretionary names (ratio of XLY to XLP) has been incredible and is “classic” late cycle activity. The value depression end is in sight in our view. Value will crush growth over the next 12-18 months. A solid leading equity market indicator above, watch for a shift in consumer staples. The sector typically starts to outperform (after a period of blow off top underperformance) 12-18 months ahead of substantial equity market drawdowns and recessions.
