The Cobra Effect

“Our indicators tell us, we’re very close to a Lehman-like drawdown,” argues Larry McDonald, a former strategist at Société Générale who now runs The Bear Traps report.

Financial Times, February 20, 2020

*The Bear Traps Report’s institutional client platform includes; financial advisors, family offices, RIAs, CTAs, hedge funds, mutual funds, and pension funds.

Email tatiana@thebeartrapsreport.com to get on our live Bloomberg chat over the terminal.

Don’t miss our next trade idea. Get on the Bear Traps Report Today, click here

This is a really important read and expresses our look down the road ahead. Some commodities in the metals space are up more than 20% this month, what gives? Let us explore.

Bloomberg July 24, 2020

Breaking: Silver futures currently on pace to settle 18% higher in three sessions. If that holds, it’ll be the fourth time that’s happened since 1975 and the second time it’s happened in 2020. 

Bespoke July 22, 2020

A Bear Traps Report Excerpt – The Power of the Cobra Effect

Anthropologist Marilyn Strathern paraphrased an observation from British economist Charles Goodhart thusly: “When a measure becomes a target, it ceases to be a good measure.” According to this thinking, a change in inflation from a “measure” to a “target” destroys the informational content value of reported inflation statistics over time. Because the Fed has targeted inflation, reported inflation numbers have become more and more useless in recent years. This, oh by the way – has placed the bond market into a deep sleep. A corollary to this development is found when a policy is anticipated, then the markets subvert it. What’s more, last week’s Fedspeak (Brainard, Harker public speeches) was focused on the topic of a far more aggressive inflation policy path coming from the Federal Reserve. Keep in mind, this was a first and rare public admission that they’ve had it (plain 2% inflation targeting) wrong all along. A shift in the traditional interpretation of the dual mandate is near.** Think of a Fed with an eye on driving policy with a much higher level of heat. The new belief? There will be gains for marginalized workers which will accelerate at very low levels of rates. Think of it as a formal Phillips Curve funeral, complete with trillions of green, dollar shaped roses showered all across the casket. They’re all in the Larry Summer foxhole now, “we must NOT hike rates until we see the white’s of inflations eyes.” As we observed in June, the Fed most certainly will rollout a formal inflation targeting change in the coming months. It’s traditional forward guidance with an inflation-targeting kicker, a game-changer for asset prices. The large move in silver over the last 30 days (nearly 25%), is telling us as much. See our bullish note on the commodities sector here. 

**Inequality’s revenge. The Fed has been a LOUD, growing public target on the inequality front, and THEY SHOULD BE. The solution?  Think of a FAR more “social-justice” focused Fed.  As part of the dual mandate, additional targeting focused on helping marginal/minority workers in the Fed’s revamped policy review. “Modern monetary theory” MMT with social muscle sounds dangerous? We shall see.

Up from the March Lows

Silver Miners SIL: 178%
Brent: +174%
Gold Miners GDX: +152%
Silver: +96%
Oil Stocks XLE: +67%
Nasdaq: +64%
Copper: +51%
Dow Transports: +51%
Russell 2000: +55%
S&P 500: +49%
Gold: +28%

Bloomberg data.

Metals: Investors poured money into precious firms equity offerings. This could be an ‘incredible bull market for gold / silver equities’ – A year ago, you couldn’t get Wall Street to touch most gold miners’ stocks. Today, it’s throwing billions at the industry. Precious-metals miners once seen as too leveraged and high-risk for the typical investor raised $2.4 billion in secondary equity offerings during the second quarter, data compiled by Bloomberg show. That’s the most since 2013 and seven times more than the funds they raised a year earlier.

MMT Overdose, Monetary and Fiscal Engines

Goodhart’s Law grew from monetary policy issues in the mid-1970s. As he put it: ‘Any observed statistical regularity will tend to collapse once the pressure is placed upon it for control purposes.’ It became the primary intellectual counterpoint to the Thatcher regime’s use of broad and narrow money targets in its monetary policy conduct. Today, if we apply it to current monetary and fiscal policy, we should infer that since money is being created and disbursed based upon past relationships between money and GDP, in fact, the longer we continue on the current policy mix, the less of a normal relationship there will be between money and GDP, which is the precise opposite of current consensus.

From Campbell to Goodhart 

Goodhart’s Law grew out of Campbell’s Law, which states: “The more any quantitative social indicator is used for social decision making, the more subject it will be to corruption pressures and the more apt it will be to distort and corrupt the social processes it is intended to monitor.” Applying this law to the current governmental approach, we predict the current capital disbursements from the Treasury and Fed are destroying the relationship between capital and labor, as well as between the profit motive and capital formation. There is no more creative destruction. There is merely gaming the system.

Dollar Taking at Beating at the Hands of the Yen (Japan)
Has the Japanese yen become the world’s risk-off currency? Hard to process a $4 to $5 trillion federal deficit under a Republican Administration without concluding that either inflation is around the corner of the dollar is going to substantially weaken or most likely both. Some feel a blue-wave will lead to even more MMT experiments (modern monetary theory)?

The Cobra Effect

Campbell’s Law is in turn an example of the “Cobra Effect,” which highlights the unintended negative consequences of public policy and government intervention in economics. The Cobra Effect is when the solution to a problem makes the problem worse, specifically by incorrectly stimulating an economy. All of this has rendered incoming economic data relatively meaningless in 2020. The utility value today of an economist is far less than it was just 18 months ago, the data has become far too erratic with little predictive value.

Don’t miss our next trade idea. Get on the Bear Traps Report Today, click here

The Cobra Effect comes from a story from the British rule of India. Once upon a time, there were too many cobras in Delhi. So a bounty was offered for each dead cobra delivered. This proved initially successful, until, that is, entrepreneurs began breeding cobras for the income. Once the British authorities were aware of this unforeseen consequence, they stopped the program. So the breeders released their inventory, resulting in a larger cobra population than before the bounty was initiated. Hell hath no fury as a Cobra breeder scorned!

Inflation Expectations Surge
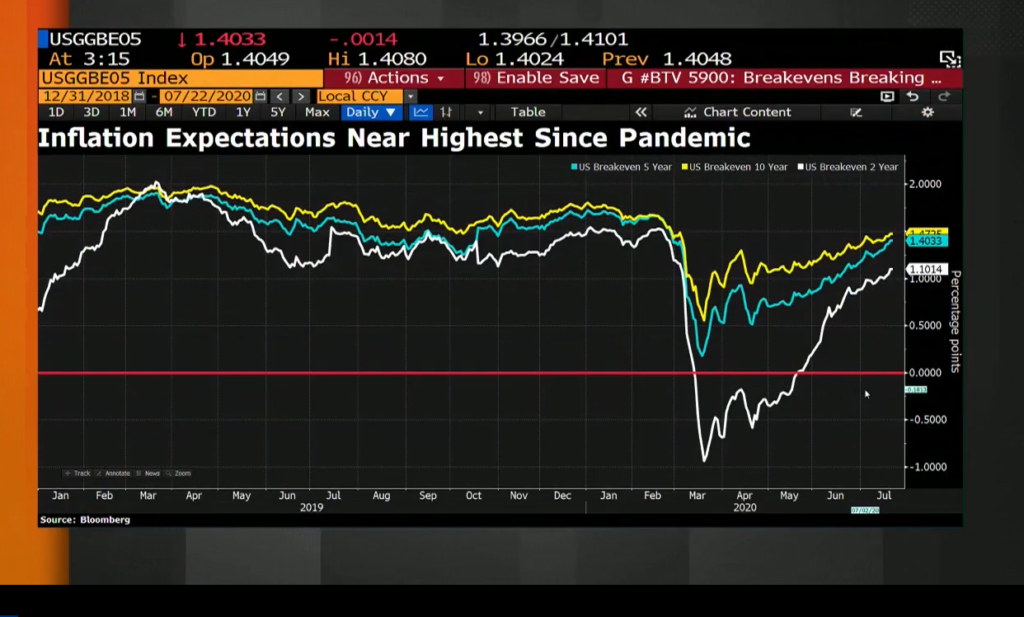
Real bond yields are plunging. Say you’re a billionaire in the middle-east with loads of short-term treasuries. Your return on investment, after inflation expectations, is paltry. What can you do? Buy commodities as a hedge, insurance. The TRUE cost of capital has never been this distorted. We now have $110T of debt on earth < 1.50% in yield, up from $35T in 2018. Inflation expectations rising with bond yields artificially suppressed by central bankers is a potentially toxic cocktail. When you do NOT allow the cleansing process of the business cycle to function over longer and longer and longer periods of time, there are two primary outcomes. 1) You create a proliferation of bad actors. Just picture 1000 Bernie Madoffs running around the Hamptons from one beach party to the next.  2) More and more money is searching for a “safe” new home. On earth today, there’s a lot more capital in the convexity risk zone, for sure. As more and more capital is sitting in places with an artificially suppressed cost of capital, return on investment – the potential wealth destruction becomes larger and larger if something goes wrong. “Don’t fight the Fed” in February, became trillions lost in March 2020.

After Years of Putting Up the Austerity Fight – The Iron Chancellor Caves

We believe we are at the early stage of the biggest Cobra Effect in the history of economics. As the massive monetary and massive fiscal stimuli (over $15T globally) conjoin to save the economy from a deflationary depression, they will cause instead a hyperinflationary economic collapse. If the government becomes aware of this beforehand and withdraws current policies, then indeed a deflationary depression will follow, but one much more severe than if the government had done nothing. How far has the world turned in twelve months? The “Iron Chancellor” in Angela Merkel has formally capitulated this week, agreeing to issue common debt on a large scale. We’ve gone from a “black zero” – Germany’s austerity obsession, over to fiscal handouts to mathematically unsustainable debtors in the periphery. Somewhere Alexis Tsipras (Greece’s Syriza) and Dick Fuld (Lehman) are into their 4th bottle of burgundy wondering why they were born twelve years too early. They were dealt a far different austerity and moral hazard sword, one that doesn’t exist on planet earth today. On the fall of Lehman, in our New York Times bestseller – now published in 12 languages – we end the book with the words, “it didn’t have to happen.”

 Gaming the System

Returning to Goodhart’s Law, we note that any system can be gamed, as Jerome Ravetz’s research has shown, especially if the goals are complex. Essentially, those who are most capable of implementing a complex task, do so to their own benefit and thus to the detriment of the task. When these goals are quantified, used as a measure, and targeted, we have Goodhart’s Law.

Real Yields and Gold – Bonds Driving the Bus
The gold bugs have been lost for decades, precious metals have always been a game played on the fixed income field. Just take a look at 5-year U.S. Treasuries, after inflation your yield is -1.17%, that’s well on its way to a ten-year low – pure precious metals afterburner fuel.

“If I had to bet my life on higher or lower inflation, I’d bet a lot higher.”

Warren Buffett, Berkshire Annual Meeting, May 2018

Lucas Critique and Unintended Consequences 

This leads directly to the “Lucas Critique” on macro-economic policy when it is based purely on observed historical aggregated data. The basic idea of the Lucas Critique is that the consumption function used in Keynesian models cannot be structural (i.e. invariant) because they vary too much under pressure from government policy, which is to say, the relationship between consumption and disposable income varies according to many different stressors, and is much complex and difficult to predict than in standard neo-Keynesian models. In other words, if you change the rules of the macro-game, the structure you assumed wouldn’t change, in fact, does change, thereby destroying predicted outcomes. The Lucas Critique led directly to an increased focus on micro-economics. We may thus be assured of one thing, whatever the Fed and the Executive and the Legislature are doing, will have massive unintended consequences that are simply unimaginable.

In essence, our thesis is that Goodhart’s Law, Campbell’s Law, and the Lucas Critique are all being ignored by those implementing current monetary and fiscal policies. Basic economic assumptions, or structures, will turn out to be much more fluid than policymakers can anticipate. Therefore the results will be disastrous and unimaginable, we’ll survive and thrive after the adjustment process for sure. Assumptions on how markets work are derived from a shattered past. All predictions derived from the past are meaningless at best, counterproductive at worst.

Don’t miss our next trade idea. Get on the Bear Traps Report Today, click here
Facebooktwittergoogle_plusredditlinkedintumblrmail

Facebooktwitterrssyoutube

Gaming the S&P 500 Inclusion Process

“Our indicators tell us, we’re very close to a Lehman-like drawdown,” argues Larry McDonald, a former strategist at Société Générale who now runs The Bear Traps report.

Financial Times, February 20, 2020

*Our institutional client flatform includes; financial advisors, family offices, RIAs, CTAs, hedge funds, mutual funds, and pension funds.

Email tatiana@thebeartrapsreport.com to get on our live Bloomberg chat over the terminal, institutional investors only please, it’s a real value add.

Don’t miss our next trade idea. Get on the Bear Traps Report Today, click here

Breaking: TESLA GAAP income was $104MM. This means that without a record $421MM in regulatory credit sales it would have negative GAAP earnings… – ZH
The Big Day

Our view on ‘Earnings” as of 6 pm ET, July 22, 2020

Warning: Tesla appears to be “selling” regulatory credits based on cars they may not have yet sold to people who have not paid for them. They gave a fresh, weird explanation for accounts receivable. The quarter is a conjured profit to get in the S&P (no surprise there).

This is the TSLA accounting disclosure: “We recognize revenue on the sale of automotive regulatory credits at the time control of the regulatory credits is transferred to the purchasing party as automotive revenue in the consolidated statement of operations.”

Our Conclusion on S&P 500 Inclusion

One question. How on earth can the committee at S&P, vote to include Tesla at this point in time?  Such a declaration would be built on the basis of the last twelve months “earnings” in the red to the tune of $675m to $685m.  After we exclude the EV credit sales, there is NO there, there. Even Tesla’s CFO says; “we don’t manage the business with the assumption that regulatory credits will contribute in a significant way in the future.”

In summary, S&P 500 inclusion needs the sum over the past 4 quarters to be profitable on a GAAP EPS basis, with the most recent quarter being profitable as well, thus TSLA has NEVER been in the index.

A Dramatization

Translation: “Recognize revenue… at the time control… is transferred to the purchasing party”

Hello: “Hey FCA CFO – this is Frenchy over at Tesla. Do you understand that pooling arrangement? I’m passing control of those credits now to you over to the second half of the year. Relax, you will NOT have to make payment at this point. On our end, we will place this in the accounts receivable accrual process. With our multi-year contract, it won’t impact you one bit.”

They admitted it’s all in accounts receivable. Smells like a fraud???

Tesla reported Wednesday, July 22 after the close. The implied move (↑↓) on the earnings – as priced by the options market – was ~20%.

**For our previous report on gaming the S&P 500 index inclusion process, see our post here. 

Credit Markets Are Sending a Message to Mr. Musk
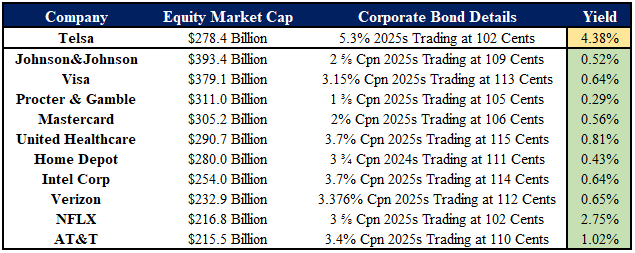
This is remarkable data, Tesla’s five-year bonds are yielding nearly 400bps more than their possible market capitalization neighbors in the S&P 500.

A $30B Bid?

Tesla more than a week ago reported that Q2 deliveries totaled 90.6K, strongly beating consensus of 70.3K. In a recent email, Musk told employees “breaking even is looking super tight,” seemingly suggesting a substantially greater outcome in 2Q than the loss many analysts were looking for. Musk can inflate these results with one-time items such as ZEV credit sales or releasing deferred revenue associated with autonomous driving features. He’s done that before and he has every reason to do so now. If Q2 is profitable, TSLA is eligible to enter the S&P. On our calculations, funds tracking this bellwether index would then need to buy $30bl of TSLA stock (see calculation below).

Note that Wall St is still expecting a modest non-GAAP loss of 22 cents and a GAAP loss of $1.8.

Free Float and Influence

*Buying pressure from S&P inclusion: There is approximately $3.9Tr of pure index capital following the S&P 500. These are mostly index funds, including ETFs and mutual funds that mimic the S&P. TSLA market cap is $278bl but Musk owns 18.4% of the stock. The free-float market cap is therefore $220bl. Base on the S&P 500 market value of 27.8TR that means TSLA should get a 0.8% weight in the S&P. This implying $30bl of buying power from index buyers. Note that every $100 on TSLA stock price means $3bl additional buying power from index trackers and vice versa.

The Musk Payday

Musk’s big payday: Based on the 2018 performance award program, TSLA has achieved its 3rd milestone needed to unlock the first of the twelve tranches of stock option awards to Musk. The first tranch unlocks if TSLA has a market cap of $100bl for 6 months (and sales/EBITDA milestones) and allows Musk to buy 1.7ml shares at $350 p.s. That means he locks in a cool $1.8bl. The caveat being that Musk would need to hold these shares for 5 years.

The Great Front-Run

In summary, S&P 500 inclusion needs the sum over the past 4 quarters to be profitable on a GAAP EPS basis, with the most recent quarter being profitable as well, thus TSLA has NEVER been in the index. After years of consistent negative EPS prints, starting in Q3 2019 Tesla began reporting positive EPS. The past 3 quarters have now been positive, meaning if this quarter is also positive (sum of past 4 positive + most recent positive), Tesla will be eligible for S&P 500 index inclusion. Keep in mind, even if they post a small loss, the company could still be eligible next quarter if they report positive EPS and the sum of the previous 4 quarters is positive. With a total enterprise value now close to $300B, and Tesla reports on July 22., people are betting the people at S&P are eager to add. By buying up the stock now, speculators are forcing the S&P to give the stock a higher and higher weighting. Thus, ETFs / Indexes will be forced to pay up, buying even more shares. Then the hot money exits, leaving indexes holding the bag.

The Facebook Lessons

S&P 500 Index Committee; all members are full-time professional members of S&P Dow Jones Indices’ staff. The committee meets monthly. At each meeting the Index Committee reviews pending corporate actions that may affect index constituents, statistics comparing the composition of the indices to the market, companies that are being considered as candidates for addition to an index, and any significant market events. Facebook $FB – S&P published its decision on Dec 11, 2013, front-runners pushed the stock 140% higher from June into the big day. $FB was eligible for several months to enter that index the Committee passed over $FB at several meetings until deciding to include the company.

Facebook $FB vs. Tesla $TSLA

IPO Date: May 2012 vs. June 2010
S&P Entry: Dec 2013 vs. ???
Market Cap on Entry: $150B vs. $300B?

In Conclusion, Three Key Points, July 20, 2020

1.       They will almost certainly make a profit.  Last year they lost $400 MM in Q2.  This year they sold almost exactly the same number of cars.  They sold them at lower prices.  They operated two car factories instead of one, which drives up fixed costs.  There is no reason they should genuinely do better this year than last.  But, since we are all willing to be blind to this obvious book cooking, they will, for sure, announce a profit.

2.       Eligibility in the S&P does not equal inclusion.  TSLA stock is up many billions of dollars on the most widely discussed catalyst (S&P inclusion).  It’s up to the committee to decide whether the millions of investors who have chosen to index will be forced to sell 499 other stocks to make room for TSLA.  Even if they don’t believe its fraud, they may understand that they are being gamed.  They may add it right away…or they may take a wait and see.  Tough spot for them.

3.       There is something called “completion funds” which own all the stocks, not in the index.  There is a ton of money in these, as well.  Due to TSLA’s outsized market cap, it is by far the largest component of completions funds.  The completion funds will have to sell TSLA when it gets added to the index.  This will offset a great deal of the index buying power.

Josh Brown and Larry McDonald Break it Down
See our video analysis here.

Don’t miss our next trade idea. Get on the Bear Traps Report Today, click here
Facebooktwittergoogle_plusredditlinkedintumblrmail

Facebooktwitterrssyoutube

Leadership Failure, Sending a Message

“Our indicators tell us, we’re very close to a Lehman-like drawdown,” argues Larry McDonald, a former strategist at Société Générale who now runs The Bear Traps report.

Financial Times, February 20, 2020

*Our institutional client flatform includes; financial advisors, family offices, RIAs, CTAs, hedge funds, mutual funds, and pension funds.

Email tatiana@thebeartrapsreport.com to get on our live Bloomberg chat over the terminal, institutional investors only please, it’s a real value add.

Don’t miss our next trade idea. Get on the Bear Traps Report Today, click here

Tremors Before the Quake

At close to 7% off this month’s sky highs, U.S. equity market leadership found in Microsoft is fleeting. Trading at nearly 12x sales, MSFT investors have started to rotate out of big tech this week. The insanity of paying 12x sales for large-cap stocks speaks to the greater fool theory. You really need the next guy to come in and lift you out of your shares at an even higher price. At nosebleed valuations, that’s your ultimate investment philosophy. After founding Sun Microsystems in 1982, years later Scott McNealy once said, “At 10x revenues, to give you a 10-year payback, I have to pay you 100% of revenues for 10 straight years and dividends. That assumes; shareholders approve, zero-cost goods sold, zero expenses, no taxes, zero R&D, + we maintain the current revenue growth run rate. Now, having done that, would any of you like to buy my stock at $64? Do you realize how ridiculous those basic assumptions are? You don’t need any transparency, any footnotes. What were you thinking?”

“If everyone is thinking alike, then someone is NOT thinking.”

General George S. Patton

Size Matters

It’s now very close to 40% of the S&P 500, yes BIG TECH. Looking back, the only other sectors to ever position themselves even remotely close to this lofty level is Energy** at 29% in December of 1980, and Financials*** at 28% in 2007. We know what happened next to those two sectors. Beware, the inmates are running the asylum.

**Exxon $XOM lost 45% 1980-1982
***JP Morgan $JPM lost 74% 2007-2009

Microsoft Earnings Come Wednesday

Wall St.’s collection of brain trusts just love Microsoft MSFT, they’re falling all over themselves to upgrade the stock. With the energy of a mad mob, thirty-six analysts cover Microsoft equity; 32 “buys” vs. 4 “holds” and ZERO sells. Of course, when MSFT was on sale in March-April we heard crickets from this crowd, they were too focused on the “great depression.” Today, they’re in a better mood, expectations for MSFT’s sales growth are up at 8%, near $37B, with earnings per share close to $1.40. The situation is much like the analysts’ former darling, Exxon $XOM. In the summer of 2014, the stock was priced for absolute perfection. There wasn’t a bear to be found across all the Wall St. banks -then shares lost 71% of their value. By now, who doesn’t know Microsoft’s cloud portfolio products are clear beneficiaries in the “work from home” boom? The Information points out, “In this quarter, it is worth watching the rate of growth for Microsoft’s Slack-killer product, Teams, which saw surging usage in the March quarter. A related question is whether people are taking advantage of Teams’ video function, which competes with Zoom. And will Microsoft executives talk about their success in dealing with capacity shortages in their cloud business?”

Memories of 2011

Of course, back in 2011 when the stock traded at 12x earnings (vs. 36x today) and sported a healthy 4% dividend yield (vs. 1% today), the Street was all beared up on Microsoft at $28, comedy.  Keep in mind, from 1999 to 2016, the stock was unched – bulls were hard to come by. In Q1 2002, it looked like Microsoft was on a comeback, the stock rallied to $35 and the Wall St. upgrades came rushing in, by September of that year the shares were down to $21. They wouldn’t see $35 again until 2007, but by the end of 2008, the shares were back down at $15. The stock goes on sale a lot, don’t chase.

Microsoft MSFT From the Lows

Mar 2020 Lows +63%
Dec 2018 Lows +130%
Feb 2016 Lows +350%
Mar 2009 Lows +1354%

Love this Quote

“Higher prices bring out buyers. Lower prices bring out sellers – size opens eyes. Time kills ALL trades. When they’re cryin’ you should be buyin’. When they’re yellin’ you should be sellin’. It takes years for people to learn those basics – if they ever learn them at all.”

Larry McCarthy, Former Head of Distressed Fixed Income trading at Lehman Brothers

Major Trend-Break Alert – Microsoft
Microsoft, very quietly lost $100B this week. On Friday, MSFT equity closed BELOW its March 2020 trendline, a VERY bearish signal for BIG Tech. When leadership acts poorly, lookout.

Passive Overdose

ETFs now hold nearly $5T up from $500B a decade ago. Per Bloomberg Intelligence, new research has directly connected the explosive growth of passive investing to deteriorating corporate performance over the long haul.  In a paper posted this month, a trio of academics tracked share-buyback activity for a range of companies and found those with higher passive ownership spent more on stock repurchases but saw worse financial outcomes. Having disengaged owners “lowered the association” between buybacks and future performance, according to authors Brian Bratten and Jeff Payne of the University of Kentucky and Meng Huang of the University of Toledo. It was also positively associated with “suspect” repurchases — those that resulted in companies meeting or beating near-term earnings expectations. “Our study provides evidence that passive investment may allow opportunistic management behavior that negatively affects future firm performance,” they wrote. “The growing influence of passive investment may lead firms to make repurchase decisions that are inconsistent with the interests of investors.”  The findings are the latest twist in the raging debate about the rise of passive investing. A growing body of literature has raised issues such as the erosion of rivalry between companies, but research over the role of index-tracking funds in corporate governance has delivered mixed conclusions. One notable study in 2016 strongly connected passive investing to improved management.

The Active vs. Passive Debate
As passive flows surge, they flow into MSFT, not Berkshire*. Over the last 5 years, there’s an additional $2T that’s flowed into the passive bucket relative to active asset management. Total returns last 5-years? MSFT 380% vs. BRK/B’s 32%. But the flows since March are all about the colossal overweight tech crowd (pure madness) and the perception of a new US cloud-based economy. So you have a double barrel mania going on here. First, the explosion of PAM (passive asset management assets under management) and then the afterburners kicked in. You have a large number of asset managers trying to keep up with the S&P 500 index performance, and a panic that they’re not long enough of our new cloud-based, remote living world companies (like Microsoft). Over the last 50 years, Berkshire BRK/A does not trade at valuations of < 1.2x book for very long. Most times, significant rallies ensue regardless of the rest of the market’s performance. In the summer of 2016, there were only $32B of (passive) assets in QQQs vs. $121B today. A large portion of those new assets have been forced into MSFT shares, there is NO choice on the matter, see below.

*For every $100B slowing into passive asset management (S&P 500 Index Funds), close to $6B of those new assets under management moves into MSFT vs. a little over $1B into BRK/B.  The QQQs offer the real juice, for $100B of new AUM, $11B flows into MSFT vs. $0B for Berkshire. Some of the AUM above is price appreciation, not necessarily new dollars in the QQQs.

Indexing and Share Ownership Structure, Beware

Indexing doesn’t ramp value like growth because “value” has a far more dispersed ownership-base and higher float. Growth tends to be “new” money with high internal ownership, with a small float easily pushed around.  The bottom line, the distortion is caused by indexing.

Microsoft MSFT Key Technicals
In another disturbing turn of events, for only the second time since the March lows, MSFT closed BELOW its 20-day moving average (purple line above). In our view, this is sure to bring in algos and momentum selling next week. Some of the high impact machines are (programmed) triggered to exit on key technical levels. MSFT has held the 20-day since March. Holding this level brings in momentum buyers, failing will bring in a flush of exiters. The SELL Signals are lining up at the traffic light.

The Great Rotation
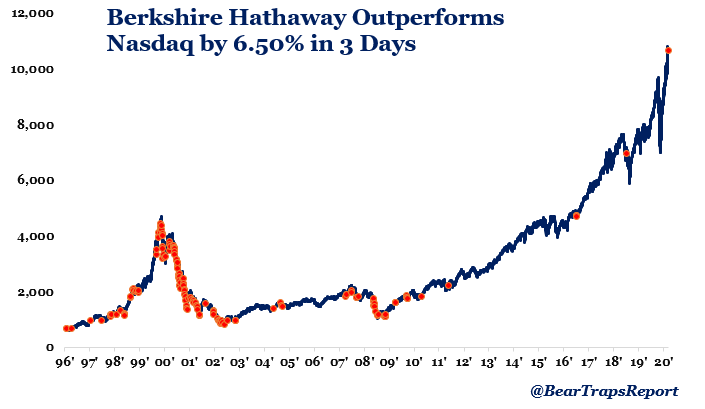
The Russell 2000 Index ripped higher by nearly 4% on Wednesday while the Nasdaq was relatively flat. Looking over the past 2 decades, when the Nasdaq (growth stocks) experiences this severe an underperformance vs. the Russell 2000 (value) it has usually coincided with the peak and/or downtrend of a cycle. A similar dynamic has played out with Berkshire Hathaway which as of yesterday’s close, has outperformed the Nasdaq by over 6.5% in the past 3 days. This is only the 3rd time since 2012 where BRK outperformed the Nasdaq by this much.

Watch Global Capital Flows

This week it’s important to note, as the US technology sector moved close to correction territory – capital was flowing into China. The total value of shares trading on the Shanghai and Shenzhen exchanges surged to near $10T, the best level since 2015. The U.S. dollar’s recent plunge puts big tech in an uncomfortable position. In recent years global calamities (Brexit, Trade Wars, COVID Phase 1) have pushed capital into the USA, NOT out.  As the U.S. struggles relative to the RoW (rest of the world), for the first time in years, dollars are leaving U.S. shores. 

Don’t miss our next trade idea. Get on the Bear Traps Report Today, click here
Facebooktwittergoogle_plusredditlinkedintumblrmail

Facebooktwitterrssyoutube

Volatility Divergence, Sending Us a Message

“Our indicators tell us, we’re very close to a Lehman-like drawdown,” argues Larry McDonald, a former strategist at Société Générale who now runs The Bear Traps report.

Financial Times, February 20, 2020

*Our institutional client flatform includes; financial advisors, family offices, RIAs, CTAs, hedge funds, mutual funds, and pension funds.

Email tatiana@thebeartrapsreport.com to get on our live Bloomberg chat over the terminal, institutional investors only please, it’s a real value add.

Don’t miss our next trade idea. Get on the Bear Traps Report Today, click here


Nasdaq Volatility Surge, Divergence from VIX
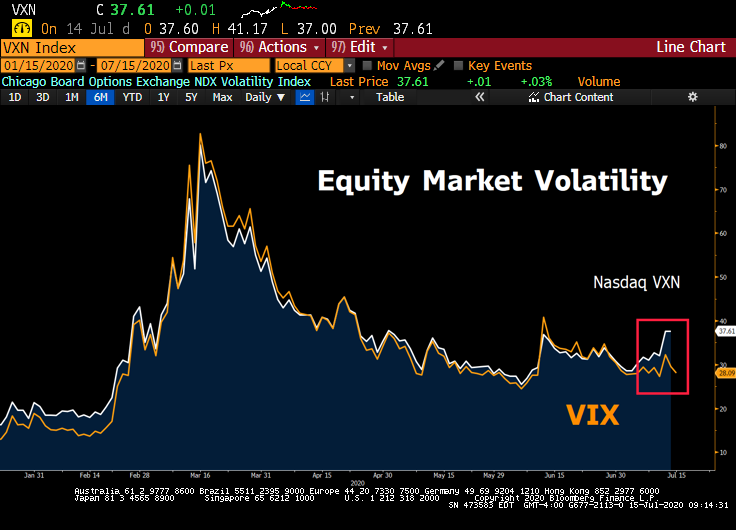
The Chicago Board Options Exchange NDX Volatility Index rose to 38 on Tuesday, an 8+ points premium to the CBOE VIX Index. That’s the widest spread since 2004. The gap between volatility in large-cap high fliers and the broader index has run the gamut in a matter of months, going from negative to non-existent to a multi-year high. Investors are paying-up for downside protection on NASDAQ high flyers.

Facebooktwittergoogle_plusredditlinkedintumblrmail

Facebooktwitterrssyoutube

Even the Bulls are Wrong, Spells Trouble

“Our indicators tell us, we’re very close to a Lehman-like drawdown,” argues Larry McDonald, a former strategist at Société Générale who now runs The Bear Traps report.

Financial Times, February 20, 2020

*Our institutional client flatform includes; financial advisors, family offices, RIAs, CTAs, hedge funds, mutual funds, and pension funds.

Email tatiana@thebeartrapsreport.com to get on our live Bloomberg chat over the terminal, institutional investors only please, it’s a real value add.

Don’t miss our next trade idea. Get on the Bear Traps Report Today, click here

Breaking *ELON MUSK PASSES WARREN BUFFETT ON BILLIONAIRES RANKING

Breaking: Monday, Tesla $TSLA:  close to an -18% interday-reversal on a $300B equity market cap company, today’s high to after-hours low, significant price action, TELLING. BEARISH.

Oh, The 90s

Besides Michael Jordan’s Rings, The Clinton’s and White Ford Bronco’s – what we remember most about the 1990s was the colossal spread which formed between Wall St’s 12-month price targets on stocks and the actual insanity found in the last trading price. Across the Street, in many cases, the analysts could NOT keep up with the mad mob bidding shares higher. Very large spreads were formed. What does this tell us about the summer of 2020? Let’s explore.

You Can Drive a White Ford Bronco through this Spread
Both at Bullish and Bearish extremes, when analysts are this wrong, bad things happen. Tesla’s shares closed at $1544 on Friday, July 10, 2020, but the Street’s twelve months price target is down at $780? Close to 40 analysts cover TSLA stock; 16 Sells, 11 Buys, and 9 Holds. The highest price target is $1500, the lowest is $70, Barclays and Cowen are down at $300, JP Morgan at $295. In June, Goldman downgrades the stock to Neutral and kept their $1300 target. 

Don’t miss our next trade idea. Get on the Bear Traps Report Today, click here

What on Earth is Going On?

Call it the great Front-Run. To be considered for S&P 500 inclusion, the company needs more than 3 consecutive quarters of profitability, thus TSLA has NEVER been in the index. With a total enterprise value now close to $300B, and Tesla reports on July 22., speculators are betting the people at S&P are eager to add TSLA equity to the index.  By buying up Tesla TSLA now, front-runners are forcing the S&P Indexes to give the stock a higher and higher weighting (the S&P 500 is a market-weighted index, the higher the companies value, the higher the weighting). Thus, ETFs / Indexes will be forced to pay up, buying even more shares. Then the hot money exits, leaving indexes holding the bag. If inclusion doesn’t happen, look out below.

Buying pressure from S&P Inclusion

There is approximately $3.9T of pure index capital following the S&P500. These are mostly index funds, including ETFs and mutual funds that mimic the S&P. TSLA market cap is $278B but Musk owns 18.4% of the stock. The free-float market cap is therefore $220B. Base on the S&P market value of $27.8T that means TSLA should get a 0.8% weight in the S&P. This implying $30B of buying power from index buyers. Note that every $100 on TSLA stock price means $3B additional buying power from index trackers and vice versa.

All Important July 22, 2020

Tesla reports earnings on July 22nd after the close, if they’re able to able to churn out even the smallest profit, there’s a real chance it could happen, one large new addition to the S&P 500. On Friday, well over $1B was traded in TSLA’s options expiring July 17th, with millions betting on the $2500 strike (stock closed at $1544 Friday). Insanity.

*To be included in the index, a company must meet eight primary criteria having to do with market capitalization, liquidity, financial viability, and other factors. Share-based compensation affects GAAP earnings. S&P inclusion requires a minimum of 4 quarters of GAAP income. Musk’s award was $770m, they previously accrued most of it and ‘delayed’ performance reviews for all the other employees. Some say this part is covered. With Kunal Shah, we believe this to be true.

“As an index committee member (local) in the past. Inclusion is not on autopilot. They may still refuse if they think accounting is dodgy. Second, if it goes in it should be on some watch list for a while, so inclusion is more likely in Dec. That’s a long time. But in a big picture yes – if he manages to pull it off, he (Musk) would take his billions in bonuses and do a huge offering, which might allow for the shenanigans with reporting to be reversed.” – Grigoriy Isaev

NY Fed on Inclusion

Per the NY Fed, the pre-inclusion changes in firm characteristics are substantial. “For our sample, on average, the increase in market capitalization in the two years preceding inclusion, adjusted for changes in the aggregate market level, is 56%. ” The increase in market value reflects the pre-inclusion price momentum, and it coincides with the strong earnings performance of the event firms. The total increase of EPS in the fiscal year before inclusion and the year of inclusion is about 57%, per the NY Fed. In other words, there’s a heavy incentive for companies to juice earnings ahead of inclusion. 

On the Changes to the Index Inclusion Effect with Increasing Passive Investment Management

Per the University of Pennsylvania, empirical analysis of the S&P 500 index inclusion effect for additions to the index between 1981 and 2015 is revealing. The analysis finds that between 1990 and 2015 the average excess return for additions from the announcement to effective day was 5.64%. This is a low number because of all the gamesmanship pre-inclusion. Over the years, more and more investors have been drawn into this front-running game. The large the colossal passive index flows (now in the trillions), the bigger this contest will become. UPenn’s research was executed before the recent explosion of capital coming into passive index funds.

The bottom line,  more passively linked funds create a larger shift in the demand curves for the stocks around inclusion, but some results do not yield such conclusions. Keep in mind, UPenn was NOT looking at a MONSTER $300B new addition to the S&P 500, this is a rare event indeed (by far the largest ever). S&P 500 inclusion is a career decision indeed, we wouldn’t want to make it. The life cycle of Tesla as a public company has been highly unusual, to say the least. For years, there have been questions about the company’s accounting and departing CFOs. Busier than musical chairs, Tesla has had more chief financial officers than Lehman Brothers went through during the company’s last years before its “Colossal Failure of Common Sense.” For years, the company’s junk bonds provided a yield of 7-9% in a land of near 0% cost of capital (thanks to central banks). At the same time, the company commanded a $50B to $100B equity market cap. For a number of reasons, the company has NEVER been included in the S&P 500, Tesla is one VERY late bloomer indeed. One can make the argument that true capitalism died years ago. Without a mountain of assistance from the federal government (solar / energy subsidies) and wide-open capital markets forged on the back of central banks, Tesla would not be with us in its current form.

A Top 15 Position Weighting in the S&P 500?

Keep in mind, Procter & Gamble is the 10th largest position holding in the SPY SPDR S&P 500 ETF Trust with an equity market capitalization of $306B. So we can safely assume Tesla with a current market cap close to $300B, TSLA would crack the top 15 upon entry (if the shares hold on to current, extreme valuation level). This is one colossal addition to the index, a significant event.

Don’t miss our next trade idea. Get on the Bear Traps Report Today, click here

The Bulls Case

The most optimistic bulls are looking for $21 to $23 earnings per share in 2021, so TSLA is trading nearly 71x those rosy assumptions, and made $0.20 last year per Bloomberg.  Tesla is trading near 11x sales with a total enterprise value of just under $300B. Last year’s sales came in at $24B, with $27B expected this year, and close to $40B is the Street’s outlook for 2021. The bulls will tell you TSLA has just a 0.5% share of global seasonally adjusted annual running rate (SAAR), or 16-18% share of electric vehicle sales worldwide. The bottom line, the bulls assume large market share additions in the 2021-2030 period.

*Tesla Model 3 = 1/8 Of World’s EV Sales In 2019. Tesla accounts for 1 out of every 6¼ global plug-in vehicle sales. The Tesla Model 3 alone accounts for 1 out of every 8 global plug-in vehicle sales, 13% of the global market. – Clean Tech.

“I have spoken to battery engineers at NON-frauds; i.e., not Tesla. The realistic hope is that solid-state batteries will bring a 30% to 40% improvement in energy density with considerably more safety. Toyota & the Germans will have them in production by 2025.”

Mark Speigel, Stanphyl Capital

Lithium Mining, Still in a Bear Channel, Why?
Optimists say, with the help of a Biden White House, by 2030 close to 100% of SAAR will be in the electric vehicle space. With a battery mileage range of 1000-1200, the bulls say the ICE (Internal Combustion Engine) will be nearly obsolete. But, if this is the case looking forward, why aren’t large lithium miners a lot higher? During 2017’s electric vehicle excitement phase, when investors were piling into anything and everything EV, Albemarle was near $150 a share vs. the $78 today.  As one of the largest lithium producers on earth, Albemarle is uniquely positioned and a far more attractive value relative to Tesla. In 2015, ALB finished its $6.4B takeover of Rockwood Holdings (one of the Big 4 lithium producers globally), the company is an anchor tenant in the lithium space. The Street expects Albemarle to capture a LARGE share of global lithium-demand growth over the next several years. An oversupplied market risk in 2020 has been the question mark. Some analysts point to the negative impact of the coronavirus on electric-vehicle demand. The company slowed the pace of its lithium expansion to help balance the market while it continues to consolidate its position in catalysts.

*Lithium is the key component of batteries in electrically-powered vehicles and other battery-powered applications. Rockwood’s lithium-based compounds are used in a variety of high growth applications, including base chemicals for numerous industries, drug intermediates, elastomers for car tires and rubber soles, lithium batteries, thermoplastic materials, and high-performance greases. Rockwood has lithium production facilities in the United States, Chile, Germany and Taiwan.


Don’t miss our next trade idea. Get on the Bear Traps Report Today, click here
Facebooktwittergoogle_plusredditlinkedintumblrmail

Facebooktwitterrssyoutube

Tarnished Stocks Moving into Gold and Silver

“Our indicators tell us, we’re very close to a Lehman-like drawdown,” argues Larry McDonald, a former strategist at Société Générale who now runs The Bear Traps report.

Financial Times, February 20, 2020

*Our institutional client flatform includes; financial advisors, family offices, RIAs, CTAs, hedge funds, mutual funds, and pension funds.

Email tatiana@thebeartrapsreport.com to get on our live Bloomberg chat over the terminal, institutional investors only please, it’s a real value add.

Don’t miss our next trade idea. Get on the Bear Traps Report Today, click here

As of 8:30 AM ET, July 21, 2020

Metals Last 30 Days

Month over Month

Silver +18.4%
Copper +11.4%
Palladium +9.4%
Platinum +5.7%
Zinc +5.2%
Gold +4.9%
Nickel +3.8%
Aluminum +3.5%
Tin +2.3%
Cobalt -1.5%

Bloomberg data.

A client in our institutional Bloomberg chat, shared with permission:

July 17: “Since mid-May, the Bloomberg Dollar Index is almost 5% lower. This week the bid for long-dated TIPS (Treasury inflation-protected securities) has been very strong, telling indeed. Demand was so fierce, yields plunged down to -30bps. In April, we saw TIPS outflows, now capital is flowing in, large. Clearly, the market is pricing in the early genesis of inflation or stagflation.”

July 13: “We have looked at the S&P in EUR (Euro currency). I would love to see it in gold. I bet it doesn’t look nearly as hot in gold equivalent. Gold is a powerful global currency, especially right now!”

Unloved Silver is Finding Some Friends
On July 21, 2020, Silver surged 6% before 9am. Keep in mind silver’s all-time high is over $50, while today gold is very close to its 2011 perch. Silver has some large scale catching up to do. We went to a full, “high conviction” silver position for clients in late March 2020.

US Dollar is 5% Lower Since Mid-May
We have recently lightened gold but maintained a full 3/3 position in silver SLV and 2/3 XME materials and metals. We MUST NEVER forget how many investors globally are crowded into U.S. equities.  When a stock’s performance in gold starts to look unattractive, U.S. equities will lose some portion of their global investor-base. So many things can be said about the chart below but we think what it really does is cancel out the Fed effect. Meaning, the Fed has caused the inflation of both stocks and gold – higher asset prices for sure.  So, if you price stocks to gold – the Fed’s ($3T of balance sheet expansion) effect on the stock market more than disappears.

Commodities Year to Date

Lumber +37%
Uranium +30%
Iron Ore +29%
Gold +19%
Silver +8%
Copper +4%
Wheat -4%
Corn -13%
Bloomberg Commodities Index -18%
Oil -35%

Bloomberg data

So far in 2020, hard commodities (metals) are doing much better than their soft, ags (agricultural) brother.  Investors are building up silver positions – prices head for a sixth straight weekly advance, the longest stretch in more than three years. Further gains are likely, with demand from investors and industrial users led by China, while supplies are constrained due to the coronavirus pandemic. Futures traded on Comex in New York touched the highest since 2016 this week, and exchange-traded funds backed by the metal are on course for the 12th week of net inflows, per Bloomberg.

July 13: Silver Making a Colossal Move, Major Breakout
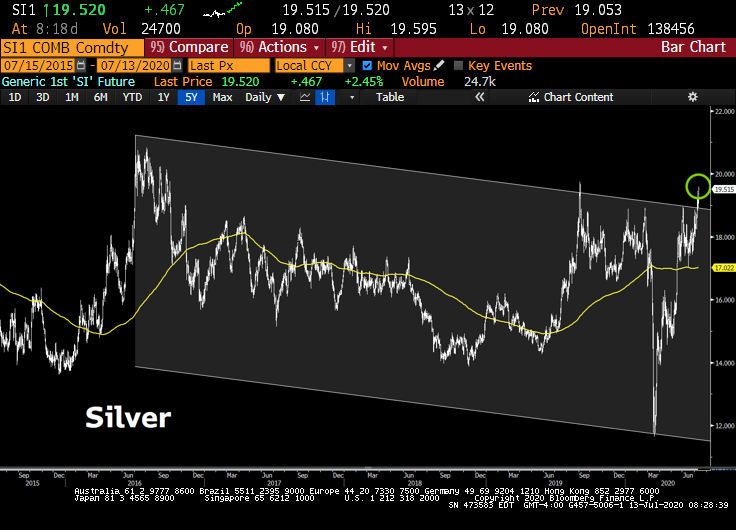
Lots of new paper wealth on the planet is looking for a hard asset hedge. During the week ending July 10th, another $1B flowed into gold and silver ETFs. Silver is a very small pond relative to the near $40T in US paper assets. 

Shocking and Shocking

The most shocking moment of this shocking chart is that it quite recently made a big new low. It wasn’t a token new low. It was much much lower than the previous lows.

Just Wow
We agree it looks much more natural. We think the price of the S&P in dollars is the ultimate Fed head-fake.  The entire 2018 move has been canceled. It is really a revelatory chart. It’s super important! U.S. stocks in gold terms are trading at late 2017 level if my eye doth not misread, one ugly equity rally indeed. Poor foundation, in two words.

Colossal Inflows

In the first half of 2020, Gold-backed ETFs closed with a record $40B of net inflows. In June, gold ETFs added nearly 110 tonnes, this brought global holdings to all-time highs of nearly 3700 tonnes.

Capital Looking for a Hedge
With over $35T in paper-promises; U.S. Treasuries $15T, U.S. Corporate Bonds $11T, Big Tech Stocks $7T, and U.S. Municipal Bonds $4T – all that new wealth is crowded in financial assets – looking for a real, hard asset (hedge) alternative. At some point, when the promissory note pool becomes too large, more and more capital starts to look for a hard asset (copper) hedge, WE ARE THERE.

July 10th’s PPI Inflation

June Producer Prices: fell -0.2% m/m vs. +0.4% est. & in prior month; core fell -0.3% vs. +0.1% est. & -0.1% prior… y/y -0.8% vs. -0.2% est. (unchanged); & y/y core (chart) +0.1% vs. +0.4% est. & +0.3% prior. With Liz Ann Sonders on the PPI Inflation data.


Don’t miss our next trade idea. Get on the Bear Traps Report Today, click here

Facebooktwittergoogle_plusredditlinkedintumblrmail

Facebooktwitterrssyoutube

Follow the Money

“Our indicators tell us, we’re very close to a Lehman-like drawdown,” argues Larry McDonald, a former strategist at Société Générale who now runs The Bear Traps report.

Financial Times, February 20, 2020

*Our institutional client flatform includes; financial advisors, family offices, RIAs, CTAs, hedge funds, mutual funds, and pension funds.

Email tatiana@thebeartrapsreport.com to get on our live Bloomberg chat over the terminal, institutional investors only please, it’s a real value add.

Don’t miss our next trade idea. Get on the Bear Traps Report Today, click here

Follow the Money

So far in 2020, investment-grade bond issuance is approaching $1.3 trillion, that’s more than double the $595 billion IG debt issuance pace at this time last year.  In the history of U.S. capital markets, four of the top six best IG new supply months are found in 2020, with April being the mother-load, up close to $300 billion.

Credit Risk, Who’s Funded?
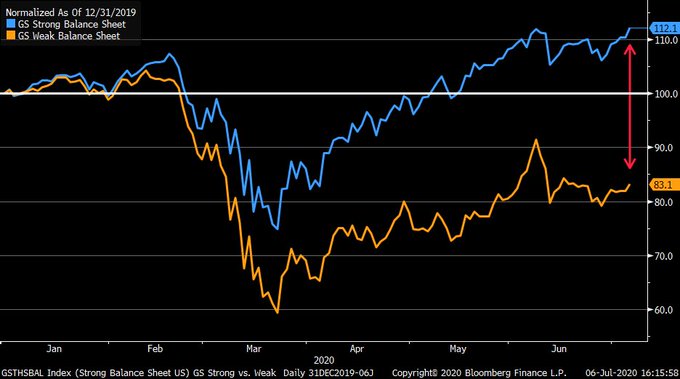
As you can see above, credit risk is driving equity prices. Well funded sectors (blue Goldman strong balance sheet) have performed well since the market highs of June 10th, while under-funded balance sheets are falling behind. Likewise, the S&P Equal Weight equity index is down almost 10% over the last month. Everyone knows – a few, well-funded companies inside the S&P 500 are running the show with hundreds of other companies left behind.

The Eye-Opener

Here’s an eye-opener. Below we take a look at the BB and higher credit quality new issues – year to date by sector. That’s right, YTD debt sales in 2020 vs the FULL YEAR 2019, the data is telling:

1) Financial $427 billion vs $546 billion (increase in deposits, record money market fund inflows, equal lowered funding needs);

2) Consumer non-cyclical $175 billion vs $228 billion (cash flows steady, COVID19 favors staples)

3) Consumer cyclical $153 billion vs $108 billion (levering up, get it while you can);

4) Communication $117  billion vs $87 billion (deals, 5G expansion funded for now);

5) Energy $116 billion vs $133 billion (companies disappearing, capex (drilling) imploding vs. 2017 levels);

6) Industrials $113 billion vs $98 billion (again, get the money while you can);

7) Technology close to $110 billion vs $68 billion (explosive inequality, monopolistic advantages all funded by the Fed, continue the debt build);

8) Utilities $75 billion vs $100 billion;

9) Basic Materials $36 billion vs $48 billion (There are 10,000 fewer holes (metals and mining) on earth being dug today than a decade ago. From a CAPEX overdose to starvation, NO supply!

Don’t miss our next trade idea. Get on the Bear Traps Report Today, click here

The Bloomberg Financial Conditions Index is now at the mid-point of the February 2020 range, yet IG issuance clearly is set for issuance records unforeseen back then. A one-week all-time issuance high was set in April at $110 billion.

The cause is well known: a near-infinite Central Bank bid allows IG companies to raise as much money as they can dream of despite poor economic conditions. Meanwhile, after multiple fiscal stimulus rounds, the White House is pushing for another $1 trillion before the August recess.

Debt markets may have found an equilibrium point. Treasury just had a record 3-year issuance of $46 billion, up-sized by $2 billion, and a full $8 billion above the norm that has held since December 2018. At 0.19%, it is the richest on record. The cover was 2.44, lower than last month’s 2.55, and a touch below the average 2.45 of recent times. So we have now the first sign of some investors on the sidelines.

Second-quarter earnings are soon, with S&P earnings forecasted down 30%. Earnings may not be quite that bad, but cash flow to interest ratios are set to deteriorate markedly. It will be interesting to see if this quarter’s earnings season “puts a lid on it.”

Don’t miss our next trade idea. Get on the Bear Traps Report Today, click here
Facebooktwittergoogle_plusredditlinkedintumblrmail

Facebooktwitterrssyoutube

Investment Newsletter

Show Buttons
Hide Buttons