
Join our Larry McDonald on CNBC’s Trading Nation, Wednesday at 3:05pm ET
Pick up our latest report here:
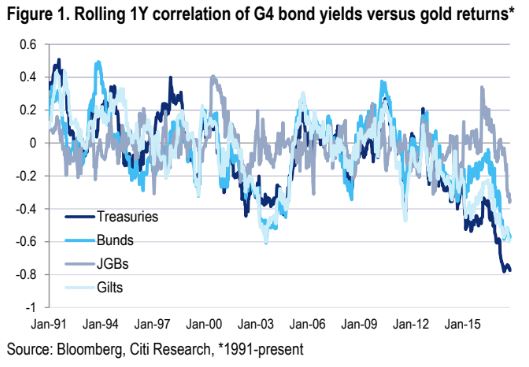
Don’t miss our next trade idea. Get on the Bear Traps Report Today, click here“We believe inflation is set to finally pick up in 2018. Much of the passive and quant-side (a $1.5T shift in asset management) has become heavily invested in the “risk parity” model which involves being long equities and bonds on a risk-adjusted basis. One of the fundamental problems with this strategy is you’re effectively really long disinflation. Sure, it’s worked very well in the post great financial crisis period, but it’s a grossly crowded trade and has all the makings of a gruesome slaughterhouse. In this case, the risk tail is a period where equities and bonds fall together, which is not that uncommon in a late cycle inflationary environment (see 1980s and 1990s). Other than out of the money puts in rates (bonds) a big way for these guys to hedge inflation is to increase commodity exposure. As long-time bulls, we’re now ‘pounding the table’ bond bears for 2018.”
Bear Traps Report, January 2, 2018
 The 2.6 percent headline rate doesn’t do justice to fourth-quarter GDP where consumer spending rose a very strong 3.8 percent that reflects a 14.2 percent burst in durable spending. Bloomberg noted Residential investment, which is another consumer-related component, rose at a very impressive 11.6 percent annualized rate. Turning to business spending, nonresidential fixed investment rose at a 6.8 percent rate which is the fourth straight mid-single digit result.
What does this mean for bonds? We have an important note coming out, pick it up here.
Government purchases at a 3.0 percent rate, also added to GDP in the quarter. What pulled down fourth-quarter GDP were net exports, at an annualized deficit of $652.6 billion, and inventories which rose at a slower rate than the third quarter. Looking at final sales to domestic buyers, which excludes inventories and exports, GDP comes in at a robust 4.3 percent.
Prices also showed some vigor in the quarter, with the index at 2.4 percent vs the third quarter’s 2.1 percent. This is a standout report led by the consumer that shows the economy accelerated into year-end 2017 with strong momentum going into 2018.
What are the key Takeaways?
There are both positive and negative views that can be extrapolated from today’s data.
- The consumer savings rate fell to its lowest since November 2007, down from 3.3% to 2.6%. If it had stayed the same, Real PCE would have been 0.8% (annualized) instead of 3.8% and GDP would have been 0.6% instead of 2.6%. Clearly, business and consumer confidence levels are nearly 2 standard deviations higher than the 1010-16 mean, thus spenders seem to be more confident dipping into savings with visions of better times ahead.
- The GDP came in lower than expectations, but net of hurricane-impacted inventories and exports, 4.3% is an objectively impressive number.
Pick up our latest report here:
Don’t miss our next trade idea. Get on the Bear Traps Report Today, click hereLooking ahead into Q1, and Beyond
This adjusted 4.3% rate isn’t unprecedented growth, however, even in recent memory. We saw 3% YoY in first half 2015. So, then, how sustainable is the growth? In the short term, a decreasing savings rate will boost demand. The near-term outlook is bond bearish, and it should be. Prices are rallying, savings are down, and over the next quarter or two we should see some legs on consumer demand; something that has been notably weak in recent memory. There is a reason to be optimistic into early 2018 from a consumer spending perspective, and perhaps even beyond, depending on the timeline for infrastructure spending.
Economic activity built on a foundation of lower savings, in the absence of wage growth, will eventually drag output lower. Lower consumer savings is likely overstated; we regularly see upward revisions.
Cycle-low savings rates don’t stay low forever. Companies have shown a resilient hesitation toward raising wages. Americans are borrowing to finance their own spending and with any reasonable stall in consumer spending into 2018, our current annualized growth rate will be under significant pressure.
Pick up our latest report here:
Don’t miss our next trade idea. Get on the Bear Traps Report Today, click here
 The total amount of gold above ground is 190K tonnes or $6Tr at current value. Half of that is in jewelry so left with $3Tr. Half of that is in reserves at central banks so that leaves a physical gold market size available to investors of $1.5tr (excl derivatives). Today, total cryptos are remarkably 23% of gold liquid (physical) market capitalization. The total value of all cryptocurrencies out is now $350bl of which bitcoin $250bl. So cryptos are 23% of physical gold available to investors now.
 Thursday’s decision to raise the seven-day repurchase rate to 1.5 percent was forecast by 18 of 24 analysts surveyed by Bloomberg. The rest expected the central bank to leave the rate at a record-low 1.25 percent, where it has been since June 2016. As you can see above, markets widely anticipated this move – interest rates in China and S Korea have been on the rise for 15 months.
  This week’s fears pushed China government bond yields to a 3-year high, taking U.S. two year Treasury bond yields north with them.
 iShares 20+ Year Treasury Bond ETF seeks to track the investment results of an index composed of U.S. Treasury bonds with remaining maturities greater than twenty years. Over the last decade, wedge breaks in the technical chart pattern of the TLT have led to large moves in interest rates. Today. an important wedge is near a breach again, a true Bull – Bear battleground is forming (middle right above).
  Bill Ackman’s Pershing Square Capital Management owns 44.7 million shares of FNMA, per the Bloomberg terminal. The LIFO cost basis is listed at $3.37 acquired over the last two years. This week, shares closed below their 200-day moving average. In the past five years, Fannie Mae crossed below this level 26 times and fell an average 1.7 percent in the next five days. It declined 17 times for an average loss of 3.9 percent, and advanced eight times for an average gain of 2.9 percent.
 The cost of insuring Saudi Arabian debt from default is approaching two-year highs, even as oil prices globally are ripping upward. On our Bloomberg terminal, five-year CDS soared another 20 basis points last week. On the heels of a destabilizing “anti-corruption” purge in the kingdom, credit risk is on the rise. Increasing tensions with Hezbollah, an Iranian-backed militant group, have compounded investor concerns about rising political risks in the region. The last time the nation’s CDS jumped as much in a single week was in January 2016 at the height of the oil-market crash. Back then, Brent was $27, compared to $64 last week. The Kingdom’s debt profile has broadly expanded. Public debt outstanding in 2014 was down at $44B, today she’s approaching $300B, per Bloomberg data.
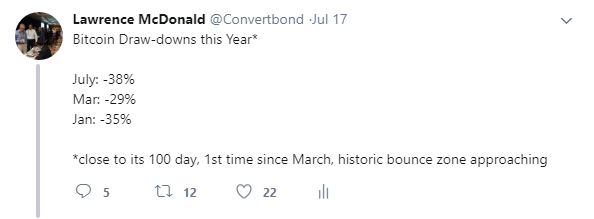
 A 2013 investment in bitcoin took nearly three years to get back to even after a nearly 80% loss. Indeed, Bitcoin is not for the faint of heart.
