Join our Larry McDonald on CNBC’s Trading Nation, Tuesday 2/5 at 6:00am ET
Pick up our latest report here:
Don’t miss our next trade idea. Get on the Bear Traps Report Today, click here
It was 5:30 pm Monday evening, after the largest single-day percentage move in the history of VIX. And then it finally happened.
Short Volatility ETFs, like Credit Suisse’s VelocityShares Daily Inverse VIX ST ETN (XIV), plunged like never before. The XIV was down 81% after-hours, from where it closed (-15%) during Monday’s trading session. At $18.60 per share of the ETN, traded 87% cheaper than its recently-minted all-time highs of around $145. It was a game changer after hours.
Breaking: *VIX SURGES ABOVE 50 FOR FIRST TIME SINCE AUGUST 2015, February 6, 2018 at 7:15am.
What happened to the SVXY?
We believe XIV and SVXY covered nearly 200,000 VIX futures just after Monday’s close. That’s 200 ish million vega. This was a major contributor to the colossal VIX futures spike from 4-4:15pm and added to the S&P selloff pain.
Stepping in Front of a Freight Train to Pick Up a $20 Bill
A look at the weighted 1-month VIX futures basket tracked by these ETNs (XIV SVXY), shows that they’re weighted roughly to 34%-36% Feb VIX futures and 64% – 66% March VIX futures. These contracts went from 15.20 (on Friday, February 2nd) to close at 29.81 on Monday, February 5th. Hit by a train? That’s a nearly 97% single-day increase or a lot of PAIN for volatility sellers.
Net Asset Value
VelocityShares has officially reported the XIV NAV of $4.22 for February 5th (down 96% from the February 2nd’s value). As for ProShares Short VIX Short-Term Futures (SVXY), the situation is far more opaque, but most likely the NAV is around $3 to $6, down from January’s $140 high.
Introduction To The Problem. Late Last Year, we laid it all Out for Clients in our Bear Traps Report
In the present environment of low volatility and low yield, many investors have reached out to yield enhancing strategies by selling volatility. When yields are low, investors sell volatility to generate extra income. The supply of yield seeking risk premia strategies has grown by $1bl vega in recent months, equal to 30% of S&P options market.
RIP XIV
Over the last year, a strategy that sells 1-month VIX futures has yielded a total return of 200%. During that time the XIV soared, but ultimately she was not long for this world. Trading at $5.70, down from $145.40 just a few days ago, sustainability is the topic of the day. The popularity of this strategy is manifested in the doubling of VIX futures’ open interest in the past year. Some strategies that target volatility are embedded in many equity-linked insurance products and risk parity funds. Risk parity funds tend to hold bonds and equities (parity) and have an estimated half a trillion of assets.
Bad Incentives
A low volatility environment encourages more option selling (and more leverage) in a self-reinforcing feedback loop. Another popular short vol strategy has been the selling of (levered) VIX ETFs and buying of inverse VIX ETFs. The popularity is demonstrated by the 6-fold increase in VIX ETF outstanding.
Off the Recent Highs, Global Pain
Japan Nikkei 225: -12.6%
Russell 2000: -12.6%
S&P 500: -12.1%
Nasdaq: -10.9%
China Hang Seng: -8.6%
Eurostoxx 600: -8.4%
India Sensex: -8.1%
China Shanghai: -6.1%
Brazil Ibovespa; -4.9%
*including futures markets, Bloomberg terminal data. The Cboe Volatility Index climbed as much as 35 percent early in New York, surpassing 50 for the first time since August 2015. It traded at 49.21 as of 7:52 a.m., a level that would mark its highest since the stock-market bottom of March 2009 if held through the close.
The vega in levered VIX ETFs is close to extremes, as well. Vega measures the change in the price of the underlying asset for every 1% change in underlying volatility. The combined vega in levered and inverse ETFs has reached $200M, so even a spike in volatility similar to August 2015, would force VIX ETFs to buy an incredulous $37B exposure in short term VIX futures. Such a spike can even get more exacerbated in case liquidity dries up as the market realizes certain structures need to rush in and cover their shorts at whatever the cost.
This $200M vega creating $37B in demand for short term VIX was based on a 45% spike. Today VIX closed up 89.77%. The forced buying therefore could be much, much bigger.
The Ugly Resolution
When the gross Vega outstanding in inverse and leveraged VIX ETFs was approximately $200ml (for the AUG 2015 +45% VIX spike), if volatility increased, these inverse and levered volatility products become overexposed to short volatility and need to buy volatility via short-term VIX futures, to adjust their exposure. At the same time leveraged long VIX ETFs become underexposed and they too need to buy more short-term VIX futures to adjust exposure. Should the VIX futures go up by 50% in one day, these levered and inverse ETFs would need to buy 70,000 VIX futures to rebalance their portfolios. Many of these funds must rebalance by the end of the day.
The danger ahead is now twofold. In addition to the significant increase in exposure to short volatility strategies by all types of investors, the low absolute level of the VIX causes it to increase more in percentage terms with any move in the S&P.
Goldman on the Vol ETN Crash
Early Warning Signs
Back in August of 2015, when Chinese authorities unexpectedly devalued the Yuan, implied volatility surged almost 200% in a matter of days. But if such an event would happen these days, with $200ml Vega in VIX ETFs alone, the managers of these ETFs would -theoretically- need to buy $37bl in VIX futures. Open interest in the VIX future contract is not nearly enough to absorb such a burst in buying volume, especially if volume dries up as the market realizes certain structures need to rush in and cover their short at whatever the cost. ETF managers, as per their prospectus, can hedge via alternatives if the VIX futures market becomes inaccessible.
ETF managers and their investors are not the only ones being caught short volatility at the worst possible time. Hedge funds, in an effort to pick up extra yield by shorting vol, are now short $250ml vega as well, according to Morgan Stanley.
Options open interest is also significant from investor selling of options to generate extra income. As of the end of Q1, market makers had almost $700bl in long options positions. Since market makers are on the other side of an option selling strategy, it implies investors are short nearly 700bl in options, up from $500bl a year ago. While this is not the entire market and many of the options may offset a long position, it is a reflection of different facets of short vol exposure.
All these structures risk becoming unhinged if volatility spirals upward in an uncontrollable surge. The large concentration of assets in passive and quant funds, and their current dominance in liquidity, combined with the dramatic buildup of exposure to volatility ETFs, sets the stage for a systemic sell-off. When ETF managers have to rush in the market to buy volatility and at the same time quants and passive funds rush to the narrow door of liquidity to get out, the market could go into a free fall. The nature of the “unknown unknown” risk is that we don’t know it until it hits us in the face. So the timing of such an event is fluid, it could happen today but it could also never happen.
Short-Term VIX Buying; Front-Month Led Backwardation Across The Curve Today we saw backwardation across the VIX curve (above UX2-UX8) at levels on-par with Brexit, and much above election night. With all this forced buying happening — and left to happen– are we going to see even higher levels tomorrow?
A Case Study: August 2015 VIX Spike
Taken from August 14, 2017 The Bear Traps Report, “Regime Change”:
“A record number of VIX options traded on Thursday, as well as $11.5B of VIX ETPs, the second-biggest value ever. That led to the third-largest day for VIX futures rebalance, with nearly $55M vega bought on the close. There are two inverse ETPs that sell the front of the VIX futures curve – XIV (an ETN) and SVXY (an ETF). With VIX futures at higher levels, the risk of a blowup in ETPs because of large rebalance — and the potential for inverse VIX ETPs to be stopped out — is less likely. XIV could liquidate with a 80% move* or more in the underlying in one day, while SVXY could start getting margin calls with a 60%+ move. *According to the prospectus, for XIV (in possession of nearly 75k short contracts) would be forced to unwind if the NAV falls more than 80% intraday, with investors receiving the end of day value. Keep in mind, this is a publicly known trigger – therefore as market stress moved toward that figure would likely bring on buying (by the ETN provider and/or market participants) in anticipation of the unwind. As an ETN, XIV investors receive the theoretical value of the index based on its rules, not what the provider actually trades.”
UVXY Prospectus – Was Today An Act Of God?
From the Proshares UVXY prospectus: In the event position price or accountability rules or position limits are reached with respect to VIX futures contracts, the Sponsor, in its commercially reasonable judgment, may cause a Fund to obtain exposure to the Index through swaps referencing the Index or particular VIX futures contracts comprising the Index. The Fund may also invest in swaps if the market for a specific futures contract experiences emergencies (e.g., natural disaster, terrorist attack or an act of God) or disruptions (e.g., a trading halt or a flash crash) which, in the Sponsor’s commercially reasonable judgement, prevent, or otherwise make it impractical, for the Funds to obtain the appropriate amount of investment exposure to the affected VIX futures contracts. Each Fund will also hold cash or cash equivalents such as U.S. Treasury securities or other high credit quality, short-term fixed-income or similar securities (such as shares of money market funds and collateralized repurchase agreements) as collateral for Financial Instruments and pending investment in Financial Instruments. Each Fund may invest up to 100% of its assets in any of these types of cash or cash equivalent securities.
Pick up our latest report here:
Don’t miss our next trade idea. Get on the Bear Traps Report Today, click here

 Oil bulls have their minds on 2012. As the U.S. launched touch sanctions with a bullseye focused on Iran’s oil industry. Exports plunged by over one million barrels a day. As we look toward the May 12 deadline on the Obama era Iran deal, a repeat of the drama six years ago would DOUBLE the expected supply deficit in the second half of this year.
 The surge in three-month libor matters because the entire ecosystem of U.S. short-term corporate finance is being repriced. The Street is finally waking up to credit risk tied to rising rates. In recent months we’ve warned, at the current pace of spending in Washington – a year from now we’re looking at quarterly Treasury auctions in the neighborhood of $23B – $26B for long bonds vs. $13-$15B now. But above all, we must keep our eye on short-term, adjustable rate corporate finance.
 In the 70s and 80s this was very common – over 21 instances where stocks and bonds sold off together two weeks + (clearly inflation-driven). In the 90s only a few (3) instances, From 2000-2018 there had been nearly zero 2-3 periods where stocks and bonds moved lower together – UNTIL NOW. As you can see above. In the 2010, 2011, 2014, 2015 and 2016 equity market drawdowns – bonds rallied in a substantial fashion. In every “risk off” regime, it has been stocks DOWN – bonds UP for as far as the eye can see. This month, for the first time in nearly two decades, the negative correlation between stocks and bonds turned positive. This is a MAJOR game changer for the wealth management industry.
 While ISM’s measure of prices paid increased to the highest level since May 2011 (keep in mind, U.S. 10 year bond yields were up near 3.50% in the Spring of 2011). What’s driving all the bearish bond sentiment? One major reason is found in the “growth to bold yield” disconnect. For most of the last fifteen years, the U.S. 10 year bond yield was “tied to the hip” of manufacturing ISM prices paid. In our view – as you can see above – the current level of ISM prices paid should be associated with U.S. Treasury bond yields 60-70bps (+0.60% to +0.70%) higher than current levels. In recent years as inflation expectations plunged, the disconnect between ISM and 10s (Treasury bonds) widened. Over the last month, as inflation expectations surged, these two long lost friends are spending far more time together.
  Is increasing wage growth (finally) here? Above, Friday’s average hourly earnings beat expectations; showing 2.9% vs. the 2.6% expected. The 8:30am data release was a catalyst for the day’s bloody sell off in both bonds and stocks. The DJIA finished 666 points off; the U.S. bond selling rattled the global markets, prompting additional declines in nearly all major global indices since. Previously included in
  On May 22, 2013, the Federal Reserve announced that it would begin tapering back their roughly $70 billion a month in bond and mortgage-backed securities program. A series of positive economic developments in the spring of 2013 led Federal Reserve Chairman Ben Bernanke to testify to Congress on May 22, 2013, that the Fed would likely start slowing— tapering—the pace of its bond purchases later in the year, conditional upon continuing good economic news. Similar to this week’s price action in markets, bond yields surged with equity market volatility as investors exited stocks and bonds together.
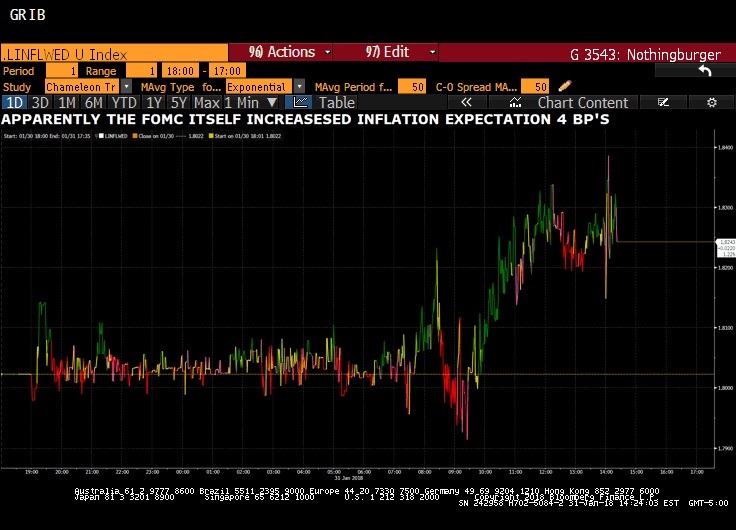
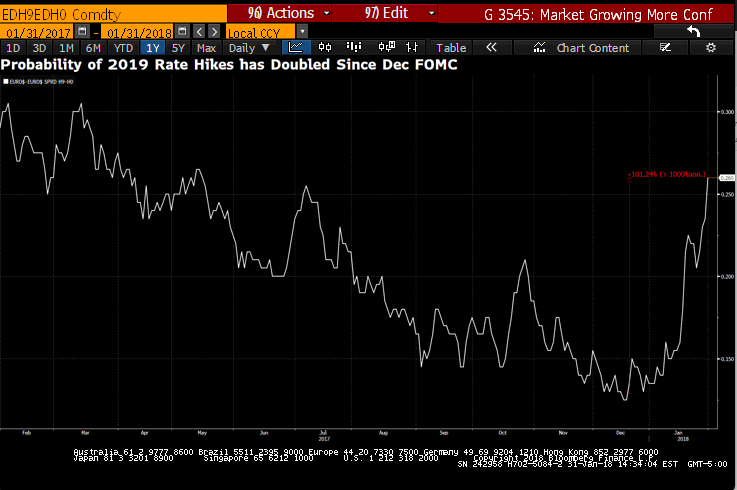 The thing to keep your eye on, in our opinion, is the probability of four hikes in 2018, instead of the three (the recent consensus). The Street was hawkish today before the meeting. Much of the debate comes from the Fed’s word choice on near-term risks to the economic outlook. The Fed reiterates these risks as “roughly balanced,” a nod away from Goldman Sachs’ expectations that these risks would now be just “balanced”. Chair Yellen left today as dovish as she came, and the Street is looking at the Powell team as by definition, more hawkish (more likely to pull back accommodation).
