Pick up our latest Bear Traps Report here
The key to trading around Fed policy comes down to understanding credit risk. The serpent inside the market will ultimately over power the Federal Reserve, take the steering wheel out of Janet Yellen’s hands once again.
Yesterday, the all important Fed minutes referenced the month of June, 7 times. After spending much of February and March talking rate hike expectations far out into the future, in recent days they’re just starting to prepare the market for a summer rate hike.
Although, yesterday’s Fed minutes are from formerly private conversations between Fed governors during the April 27 FOMC meeting, more recent comments from Governors Williams and Lockhart are clearly talking up possible summer rate hike action.
Likewise, as we noted yesterday morning recent economic data has been more supportive.
Over the last two years, central bankers (in particular the Fed) have moved the student body all the way to the left, then all the way back to the right, over and over again. Understanding this disingenuous game is the key to trading around the vicious market moves in equity, foreign exchange and credit markets.
Pick up our latest Bear Traps Report here
Justifying Lower for Longer
It’s interesting to note, if you examine the Fed minutes, over the years there have been some startling developments. From 1995-2005, references to “economic growth” took up 45% to 51% of the conversations behind closed doors. Today, focus on growth only makes up 23% to 28% of the minutes in recent years.
On the other hand, references to “inflation” have surged from 8% to 10% in the 1995-2005 period, to over 23% today. As the Fed has had to justify their foolishly shallow policy path (not hiking interest rates 2008-15) in recent years, they’ve used low inflation as the excuse De jure. This data is from LDA Analysis and ACG Analytics.
In the pre-QE ZIRP era, it took just $1.50 to generate $1.00 of GDP, today it takes $7.00. This is the price of leverage / debt on a society. “This is extremely rare and dangerous” says billionaire Stan Druckenmiller.
“Credit risk will veto the Fed’s desired policy path in 2016.”
Our Larry McDonald, on CNBC, December 2015
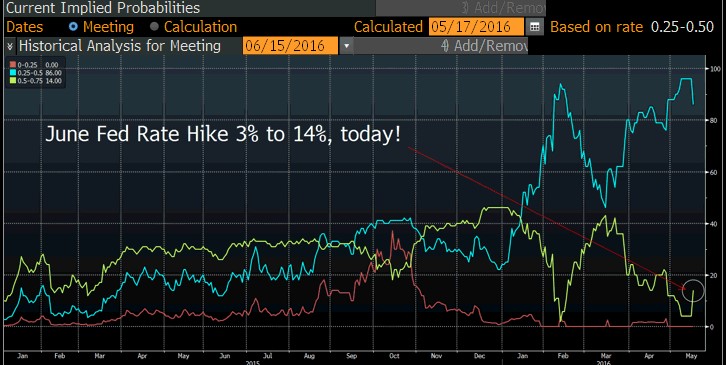
The chances of a July rate hike have surged from 14% to 40% in recent days (see below).
The yield on the U.S. 10 year Treasury popped 10bps higher yesterday.
One big problem? There is less and less liquidity in the global bond markets than ever before in modern times, U.S. Treasuries are no exception.
Pick up our latest Bear Traps Report here
Over the years, the “sell side” (global banks) had been the natural lubricant providing liquidity between “buy side” accounts (mutual funds, hedge funds, asset managers). As Dodd Frank has morphed global banks into a fraction of their former selves, we’re seeing more and more violent swings in the global bond markets.
According to work compiled by the Bear Traps Report, from 2014-16 on both FOMC rate decision and Fed Minutes release days, the moves in the U.S. 10 year Treasury are 2 standard deviations greater than normal market periods. Markets have become a meat grinder to asset managers, managing risk has become much more difficult.
Ten years ago, a typical Wall St trading desk had $2-3B of capital at their disposal, today that number is in the $200-$400m neighborhood.
The unintended consequences of regulation have been found in disturbing market dislocations. Get out the popcorn, we’re looking up at the stage, watching just the first act of this show.
We have a report on trading ideas for illiquid markets, join us…
Pick up our latest Bear Traps Report here