
Last July and again in December, as credit risk was surging globally, we strongly recommended our subscribers take down risk to equities.
“US equity markets continue their slow climb higher, pushing the S&P 500 back near the highs, while the junk bond market is selling off”. – Bear Traps July 24, 2015
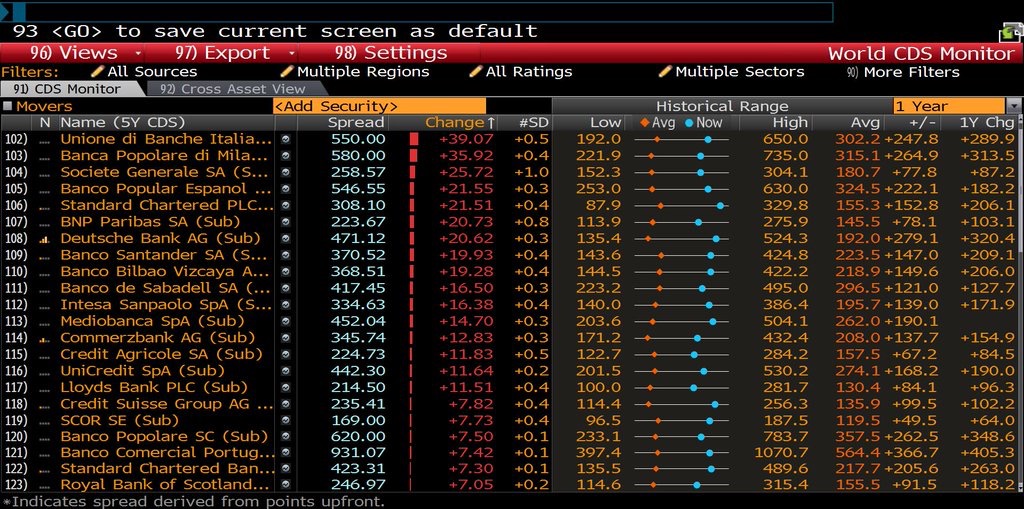
The chart above is a look at European and Asian 5 year CDS’ credit risk on banks this morning. Notice the correlation among these credits are still high.
It’s still too early to tell the side effects of Negative Rates in Japan but there is no doubt, many participants are losing faith in central banks, putting a bid under gold as the “fear trade” and leading to more misallocations of capital.
As long as commodities stay at depressed levels, volatility and Credit Default Swaps on Banks will remain expensive.
In simple terms, a Credit Default Swap (CDS) is a hedge against an asset falling in price. When an investor assumes a company or security (i.e. bonds) may default, investors will buy insurance protection in the form of a Credit Default Swap to protect against loss. When the price of a CDS rises it is a sign that a default has a higher probability.
Over the last few days, 5 year Credit Default Swaps on US banks have come in substantially (less expensive meaning less risky), leading to a rally in equities globally.
However, Asian credit, especially Japanese banks are still at elevated levels. Meaning the recent surge in stocks isn’t confirming what credit is suggesting. Therefore, all rallies will remain suspect and should be sold until the price of CDS on banks (insurance protection) falls.
The chart below shows us the cost/price in which an investor must pay to buy a 5 Year Credit Default Swap on Japanese and U.S. Banks. You can see at the present time, the Bank of Tokyo-Mitsubishi, 5 year CDS is the highest. Nomura Securities is on the rise and Mizuho Bank resides in the middle.
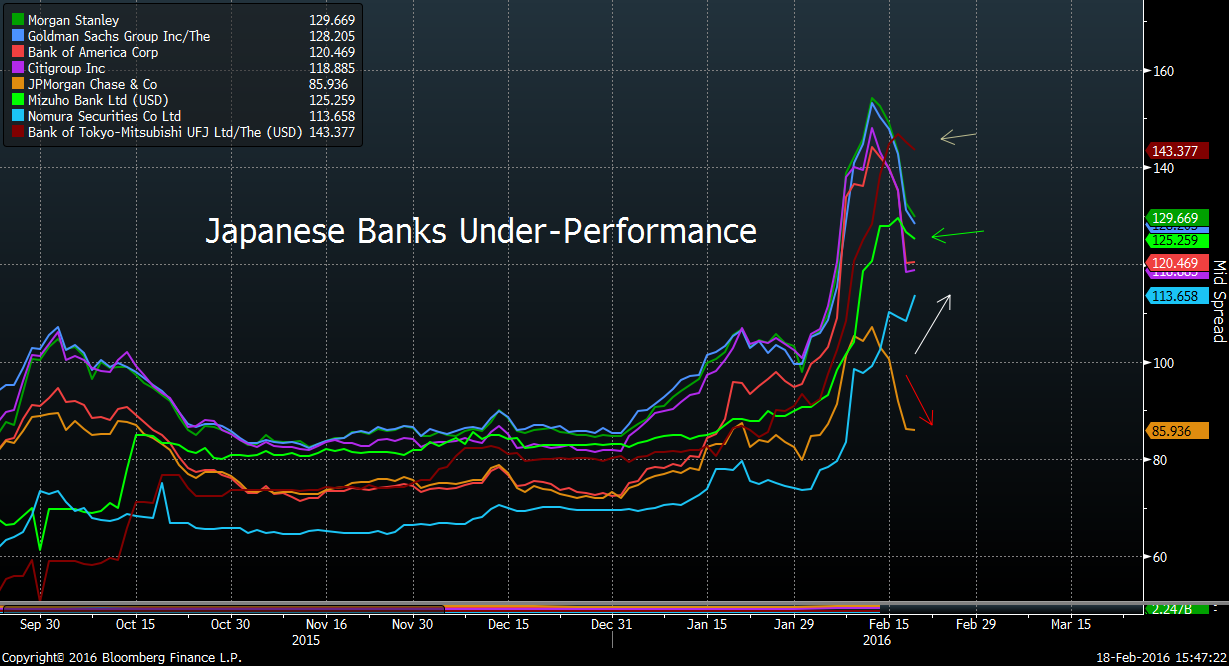
With these elevated prices, we believe the market is pricing in more risk for Japanese banks, much of which is tied to negative rates, a strong US dollar, emerging market debt load, China hard landing and the commodities trade.
Japanese banks 5 year CDS is still on six month wides (expensive), while US banks have improved.
For the rally to stay intact, we need to see Asian credit risk come in (cheapen).
We have a model using 21 Lehman risk indicators which tracks credit risk globally, helps US equity investors avoid land mines.
Many investors don’t believe that China will let their currency stay this strong through 2016. We’ve been in this camp since the beginning of 2015, something we highlighted in our Bear Traps reports.
As we stressed last year to subscribers. The global epicenter of risk has shifted over the years.
US 2007-8
Europe 2010-12
Asia 2015-17
It’s much more important to meticulously measure credit risk near the epicenter, that’s what our model is built to do.
Bottom line, credit leads equities. Every rally much be sold.

