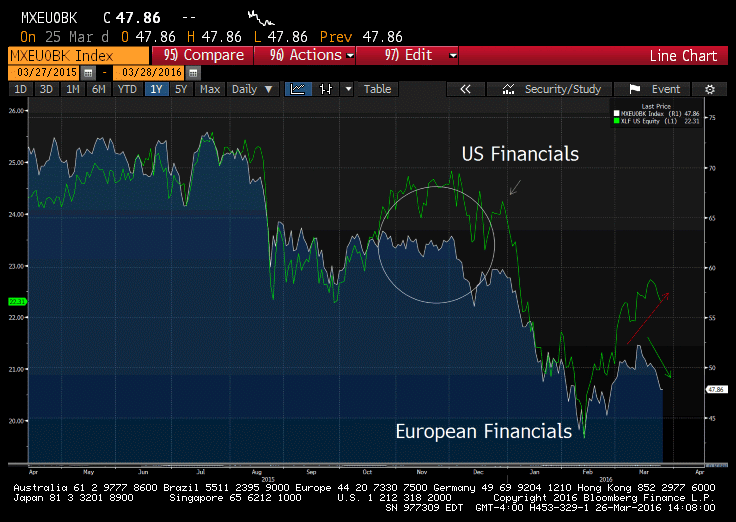
European financials started to rollover last fall, before US banks followed suit. We are seeing the same pattern today (chart below). Strong sell signals in the Eurozone financials have us on alert, our Lehman systemic risk indicators are on the rise.
1 Year Chart of US Financials vs European Financials
With over $250B of exposure to the oil patch, the EU’s 25 largest banks have done it again, exposed themselves to a dangerous asset bubble. In 2011, they were too deep in the $450B Greece bond debacle, it wasn’t all over until MF Global failed. Today, oil exposure is enough to wipe out 27% of their common equity. Sure banks have less leverage today, but far less return on equity. We would argue, a $1B loss today is equivalent to a $3B loss in 2007, the lack of liquidity compounds the problem.
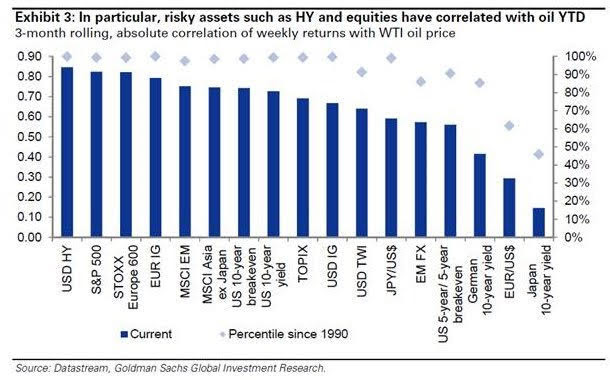
Oil bringing down the house? As you can see below, the correlation between high yield bonds and oil is near 90%, meaning nearly 1 for 1. As oil moves back to re-test the lows, so will banks, US equities and junk debt, another “risk off” move a cometh.
Any attempt by the Fed to continue liftoff, strengthens the dollar, puts pressure on commodity prices and the banks.