Join our Larry McDonald on CNBC’s Fast Money, Wednesday May 18, at 5pm.
Find value in our menu here.
The brisk pace of Federal Reserve fueled U.S. corporate debt sales for the second quarter means that 2016 may come close to reaching last year’s record-breaking $1.3 trillion of deals.
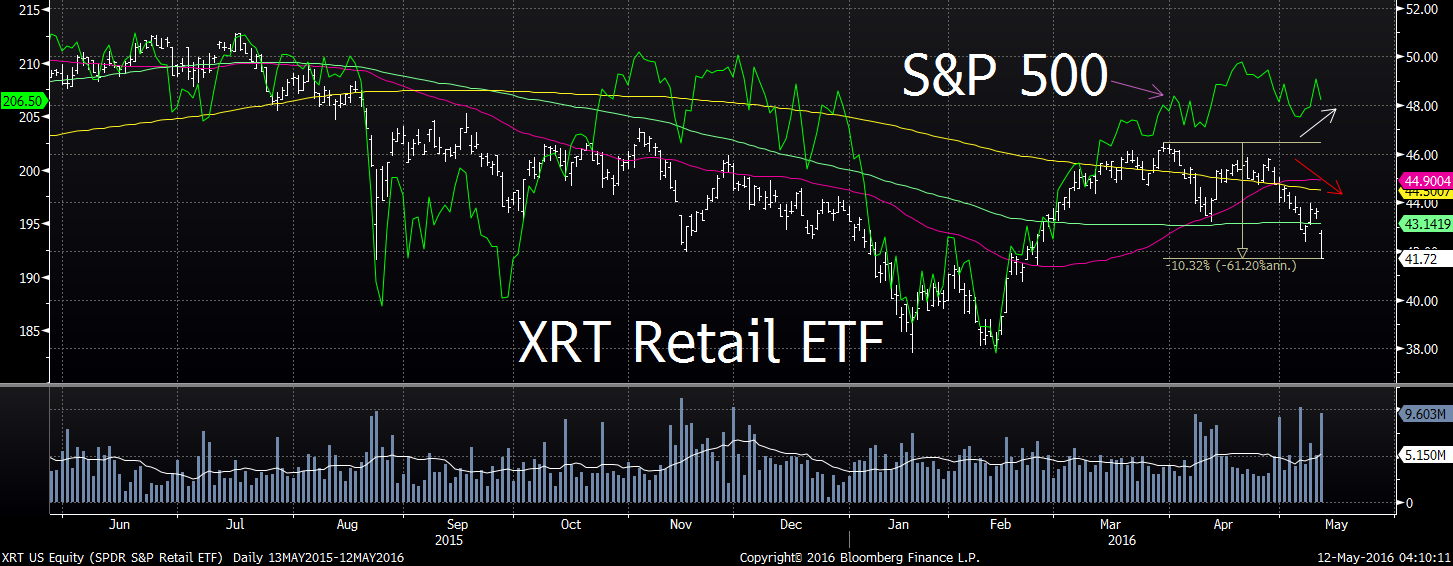
Debt is a double edged sword, as net debt relative to the underlying earnings power of the S&P is at froth levels historically.
S&P 500
Net Debt to EBITDA*
2016: 1.5x
2015: 1.4x
2014: 1.25x
2013: 1.1x
2012: 0.83x
2011: 0.9x
2010: 1x
2009: 1.1x
2008: 1.15x
* x financials
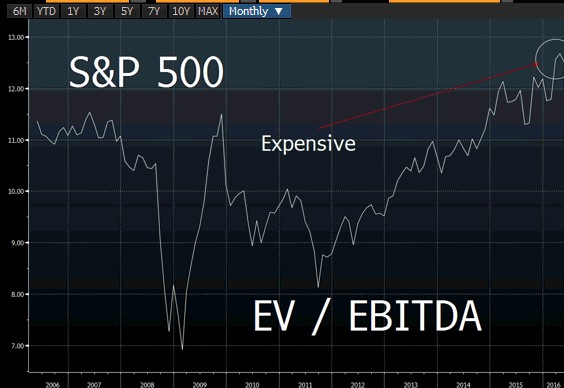
Enterprise value (EV below in the chart) takes debt + equity market capitalization into consideration. In the S&P 500, if you think of a pie with 12 pieces, five full of debt the other 5 equity, it’s foolish to just focus on the stock portion of the market’s value, especially after eight year debt binge!
As the Fed has kept rates wrapped around zero going on 8 years, investor’s thirst for yield has companies reaching new dark heights in terms of their debt loads. As the U.S. equity market has raged “risk on” since February, after the Fed agreed not to hike interest rates, stocks have become extremely expensive. SELL Signal.
What keeps us up in the middle of the night is a surge in credit quality deterioration in the face of rising bond sales. That’s NOT the way it’s supposed to work Janet Yellen! S&P Global Ratings expects default rates among junk-rated U.S. cos. to jump from 3.9% in March 2016 to 5.4% in March 2017.
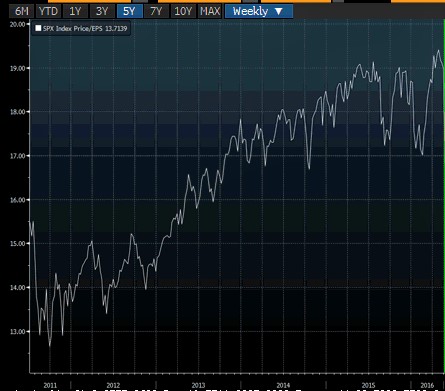
S&P 500 2006-2016
Investors are paying record prices for stocks when the debt portion of value is factored in relative to raw earnings power (EBITDA = earnings before, interest, taxes, depreciation and amortization).
The “Lower and Beat Game” is on Full Throttle
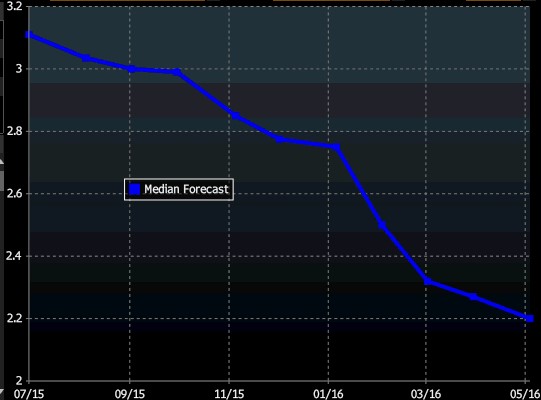
A look inside the S&P 500 shows, of the 460 companies that have reported, over 75% beat lowered consensus forecasts.
Keep in mind, if the bar is set so low, anyone can massage the numbers to exceed — and analysts had been aggressively cutting estimates for the quarter in the weeks before it ended. Bottom line, Q2 will come in at -9% on the earnings front and -2.5% on the top line sales decline.
Buy Fear – Sell Complacency
We recommended subscribers buy fear in late January, there was value found in stock prices, today not so much.
“We’ve been putting cash to work as we believe a substantial relief rally is near and the Fed won’t be able to hike rates. Great bull markets don’t end overnight. This bull withstood a violent blow in October 2014 with a 10% plunge and subsequent rally in stocks over 17 days. Last August / September, the bull took another sword, suffering nearly a 13% drop. We believe he has some fight left.. Buy the IWM Russell 2000 ETF.”
Bear Traps Report, January 20, 2016
A look at earnings year to date is not pretty. We’ve crossed into our third of (year over year) declines, the S&P 500 is now trading at 19x earnings vs. 17x three months ago.
Over the last 40 years, 19x earnings multiples in the S&P 500 have been associated with 4-6% U.S. GDP growth, not 1.8% as we wear today.
S&P 500 PE
After the first two quarters, the S&P 500 is on track to make $107.70 this year vs expectations of $121.70. We think the S&P will finish 2016 at $111.50 in earnings.
We are in search of value, join us here. Join us.
How Rich?
S&P is at 2054
Earnings of $111.50 x 16 = 1784 S&P
Earnings of $111.50 x 17 = 1895 S&P
The data above is from Bloomberg and Reuters.