Join our Larry McDonald on CNBC’s Trading Nation, Wednesday June 1st, at 2pm.
Pick up our latest Bear Traps Report menu here.
MAY ISM MANUFACTURING: 51.3 vs 50.3 exp.
PRICES PAID: 63.5 vs 58.5 exp.
Sub Indices:
– New Orders Index: 55.7 vs 55.8 prior
– Production index: 52.6 vs 54.2 prior
– Employment Index: 49.2 vs 49.2 prior
– Inventories 45.0 vs 45.5 prior
– New Orders Index: 55.7 vs 55.8 prior
– Production index: 52.6 vs 54.2 prior
– Employment Index: 49.2 vs 49.2 prior
– Inventories 45.0 vs 45.5 prior
(So higher prices drove the beat in ISM, most other components weak/unched)
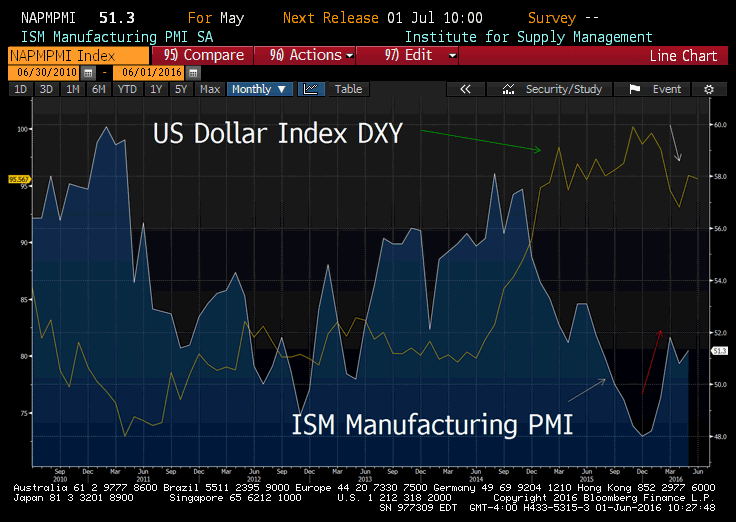 Over the last year, the global wrecking ball that is the U.S. dollar index has ripped apart the global economy. The pull back from February – April in the greenback was a breath of fresh air for markets. Last year, U.S. ISM Manufacturing was hammered by the dollar’s surge, today it surprised to the upside.
The price of a Fed “liftoff” (strong dollar) is a lot higher than economists tell you, they don’t look at risk.
We have our top 5 trading ideas looking ahead at the Fed’s next move, pick up our latest Bear Traps Report menu here.