
Join our Larry McDonald on CNBC’s Trading Nation, this Wednesday at 2:20pm
Don’t miss our next trade idea. Get on the Bear Traps Report Today, click hereUpdated March 14, 2017
Positioning in High Yield, Net % Overweight Longs
2017: -12%
2016: +17%
2015: +28%
2014: +41%
2013: +36%
2012: +43%
2011: +9%
2010: +22%
2009: -17%
2008: -28%
2007: -10%
Merrill Survey data, March 2017
Our institutional clients are growing far more concerned with the insanity in the junk bond market. There’s a lot of crummy coupons on crummier credits. As credit quality moves down yields should move higher, this has not been the case over the last year. High yield is starting to show real signs of a crack in the foundation, for the first time since 2009 long – overweight positioning is negative. This is one of our 21 Lehman Systemic Risk Indicators, click here for more:
Don’t miss our next trade idea. Get on the Bear Traps Report Today, click hereOil’s Pain is High Yield’s
Over the last week, junk bond funds posted their biggest outflow this year as investors yanked more than $2 billion from BlackRock Inc.’s iShares iBoxx High Yield Corporate Bond ETF.
Companies issuing high yield debt now see their borrowing costs close to the obscene cheap levels observed just before the 2008 crisis. We’re seeing asset managers are buying protection against losses, while junk-bond funds posted the biggest redemptions since November.
Junk is Rolling Over While Equities are Smiling
Cash high yield bonds traded very weak today as hedgers sprayed the street over the last hour of trading. Both investment grade and high-yield debt moved wider (higher yield – lower bond prices) without much support. Oil’s plunge kept many buyers on strike. Likewise, there’s $19B of new high yield supply, banks are hedging their books in size.
In March, we’ve seen a divergence between high-yield bonds and equities, this speaks to trouble ahead. As we witnessed in 2015 and 2016, credit (junk bonds) led stocks lower (weeks in advance).
Junk Omen
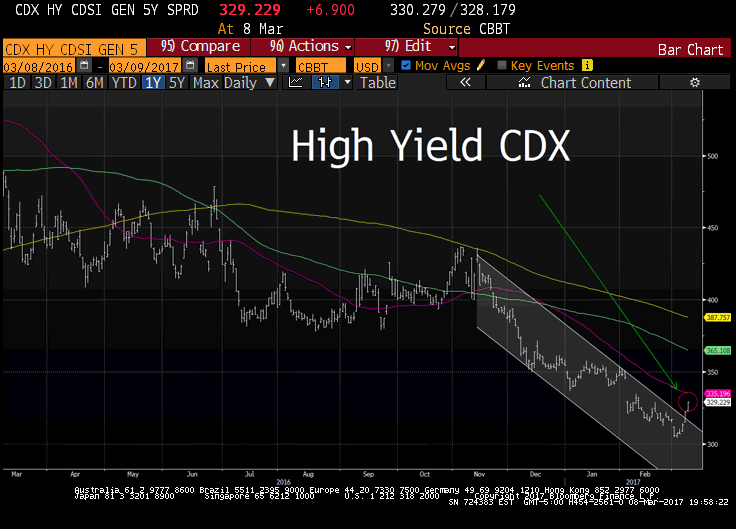
Markit CDX North America High Yield Index is composed of 100 non-investment grade entities. The index is nearly 30bps wider this month, a move from 300bps to 330bps. Average borrowing costs on the debt rose by the most in four months, according to Bloomberg index data.
Oil and Junk: Connect the Dots
Large shale companies announce substantial increases in (capex) spending for this year, and the U.S. government says domestic oil output next year will surpass the record high set in 1970. OPEC ministers have said they are keeping a close watch on shale production to decide in late May whether to extend their oil-supply cuts into the second half of the year. U.S. shale is MASSIVELY levered to oil. Their colossal debt load keeps them pumping out supply, placing a ceiling on prices.
U.S. Oil Production*
2017: 9.1m
2016: 8.2m
2015: 9.6m
2014: 8.5m
2013: 7.1m
2012: 5.5m
*High yield bonds, syndicated loans sold to fund this binge? $3T!!
BIS Data
Oil prices plunged 5 percent on Wednesday to their lowest level this year, falling just above $50 a barrel, on investor concerns about unbridled growth in America’s shale basins swelling U.S. inventories.
With the S&P 500 relatively steady in the last week, the HYG high-yield bond ETF (below) has taken a leg lower, this is a ominous sign for market pros.
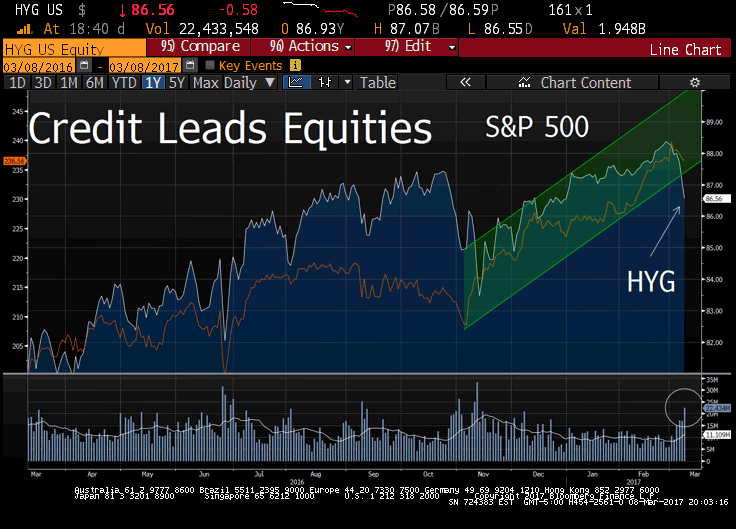
In 2017, the S&P 500 is up 6% while the HYG iShares iBoxx $ High Yield Corporate Bond ETF has wiped out nearly all its gains, a strong divergence indeed.
Don’t miss our next trade idea. Get on the Bear Traps Report Today, click hereMoody’s: North American High-Yield Bond Covenant Quality, on the Lows
One of our 21 Lehman Systemic Risk Indicators is found in junk bond covenant quality. As we wrote in our New York Times bestseller, froth in the credit markets is the ultimate signal of a coming risk off. We measure froth by covenant quality analysis. Let us explain.
When the Fed keeps interest rates too low for to long, investors begin to cheat and reach for yield. The distant pain of the credit crisis is almost forgotten. Like a bad relationship in years past, after the healing it’s time to love again 🙂
The same is true bond covenants, the weaker the terms the more power CFOs (issuers / companies) have over investors. By our measure, they’ve NEVER had more power than today.
A true moral hazard, as credit quality has deteriorated in swift fashion, buyers keep up demand for crummy coupons on crummy credits. Moody’s new report indicates the average covenant quality is down at 4.28 in the last six months of 2016. Moody’s measures bond covenant quality on a five-point scale, with 1.0 denoting the strongest investor protections and 5.0, the weakest.
Investor protections remained at their weakest level, with the cumulative average covenant quality score hitting 4.00 for the first time in December. One word, UGLY.
In a desperate reach for yield, investors were more willing to purchase bonds rated B1 and below. As a result, bonds rated single B and Caa/Ca made up a larger percentage of total issuance.
Join our Larry McDonald on CNBC’s Trading Nation, this Wednesday at 2:20pm
Don’t miss our next trade idea. Get on the Bear Traps Report Today, click hereNew Issues Strong
Five more issuers for $2.8b were placed on the calendar today. Eight deals for $4.7b to price later today, making it the second busiest day for issuance since June.
A sudden and sharp shift by the Fed from no likely hike in rates until May of this year to a near-certain hike this month, gave a big and expected push to new issuance.
Market expectation of a likely rate hike moved from 32% on Feb 1 to 94% end of last week, causing issuers to expedite their refinancing plans.
Join our Larry McDonald on CNBC’s Trading Nation, this Wednesday at 2:20pm
Don’t miss our next trade idea. Get on the Bear Traps Report Today, click here
