
Join our Larry McDonald on CNBC’s Trading Nation, Wednesday at 3:05pm ET
Pick up our latest report here:
Don’t miss our next trade idea. Get on the Bear Traps Report Today, click here“The global political risk surge has dramatically altered the Risk-Reward in U.S. equities. Our focus is on the risk connections across the EU, Germany, Italy, Sweden, China (trade) and the United Kingdom (Brexit). Our analysis of the financial path forward centers around a number of catalysts, and their impact on global markets and central bank promises. Bottom line: Look for stress in emerging markets (trade) and Europe to dramatically alter the Fed’s policy path. To us, 2018 looks a lot more like 2011 (Grexit) or 2015 (China Currency Devaluation) than 2017’s “risk on” (low equity market volatility) party. U.S. equities will move 10-15% lower, the beast inside the market will break the Fed over its knees. Once again, credit risk is about to veto the Fed’s policy path (far fewer rate hikes than the Street expects). “
Bear Traps Report, July 2, 2018 – “Credit Risk Veto”
How does one spot the end of a great bull market and the birth of a bear’s mauling? We can start with the Dow Theory.
The Dow theory asserts that major market trends are composed of three phases: an accumulation phase, a public participation (or absorption) phase, and a distribution phase. Bottom line; it’s a classic indicator of real selling. Just before the genesis of a bear market, the weak hands are flushed out. Fast money investors without deep investing commitments run for the hills first. In July, we did a solid job for clients in getting them out of the FAANGs (shorts as well), another classic, fast money hang-out. To us, what makes this indicator so important is meticulously measuring signs of real money selling. In many instances historically, the real selling doesn’t begin until there’s a Dow Theory signal. Beware, we may have touched a trigger Friday, just as the Fed continues to pursue their beloved rate hikes. Pick up our latest report here.
The Dow Theory on stock price movement is a form of technical analysis that includes some aspects of sector rotation. The theory was derived from Wall Street Journal editorials written by Charles H. Dow (1851–1902), journalist, founder and first editor of The Wall Street Journal and co-founder of Dow Jones and Company.
Since the Mid-September US Equity Market Highs
Brazil EWZ: +24%
Utilities IDU: +6%
Gold GLD: +4%
China FXI: +3%
Consumer Staples XLP: +2%
US Treasuries TLT: +2%
Emerging Markets EEM: -2%
UK EWU: -10%
Dow Industrials: -10%
S&P 500 SPY: -11%
Italy EWI: -12%
Biotechs IBB: -12%
Germany EWG: -13%
Consumer Discretionary XLY: -14%
Eurozone Financials EUFN: -14%
Dow Transports: -18%
Russell IWM: -19%
Energy XLE: -20%
Retail XRT: -20%
Regional Banks KRE: -24%
Apple AAPL: -27%
Oil USO: -27%
*Deeply embedded in a bear market: Eurozone banks EUFN are 35% off their 2014 highs, German equities EWG are 30% off their January highs, Italian equities EWI are 32% off their 2014 highs, UK equities EWU are 32% off their 2014 highs. US retailers are on course for their biggest quarterly sell-off since the financial crisis. It’s important to note, US economically sensitive sectors (transports, regional banks, home construction, consumer discretionary) dramatically underperforming above. Credit markets are freezing up. This month companies have NOT been able to raise capital through the $1.2tn US high-yield bond market. This would mark, the first full month since November 2008 (just after the failure of Lehman Brothers) that not a single junk bond was able to price.
Dow Theory’s Ambassador
Over the years the Dow Theory had many ambassadors, none more prominent than Richard Russell. He was born in New York, the son of Hortense (Lion) Russell, a novelist, and Henry Harold Russell, a civil engineer. He began publishing a newsletter called the Dow Theory Letters in 1958. The Letters covered his views on the stock market and the precious metal markets.
Ahead of the Trend
Some say the Dow Theory has been ahead of the market for nearly a century. One academic study from the 1990s calculated the theory’s track record over the prior seven decades, back to when it was created in the early part of the last century; the study found that the Dow Theory beat the broader market by an average of 4.6% points a year.
Risk Indicators and Economic Philosophy
People conflate the Dow Theory sell signal and the philosophy behind it. The overarching idea is that transports fall before industrials because the timing of their business cycles is different. But that isn’t the same as the Dow Theory sell signal. It’s the underlying theory supporting the Dow theory sell signal and buy signal. Dow theory should not be confused with Dow Theory signal.
Trannies Don’t Lie
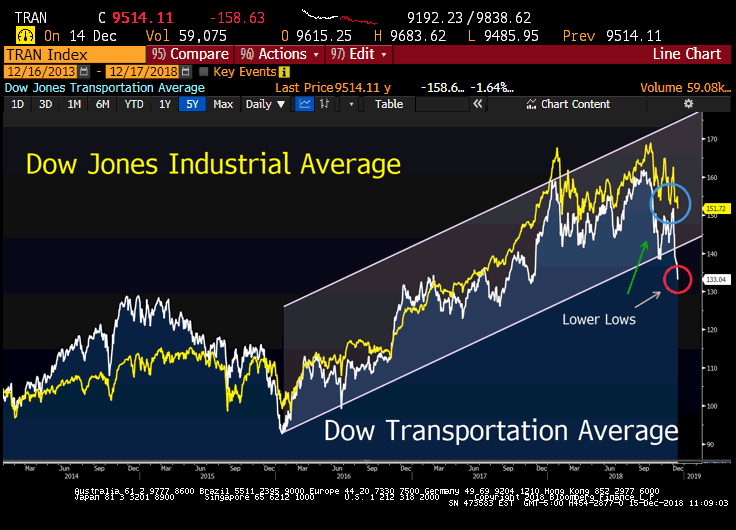 Dow Theory Triggers: Above you can see three lower lows in the (yellow) Dow Jones Industrial Average, -10.3% off her September highs and two lower lows in the (white) Dow Transportation Average, -18.3% off her September high.
“With a cross-asset view (emerging market currencies, eurodollar/Fed funds, gold, and silver); bets on a “one and done” Fed have dramatically outperformed U.S. equities in Q4 and are all pointing to early signs of a softer Fed policy path. Looking down the road ahead, the U.S. equity market will CRASH in 1987 style if the Fed plays tough guy, it’s that simple. Similar to the March 2016 landscape, the market is about to embarrass the Fed yet again. As we have stressed over the last few months, they will capitulate (call off future rate hikes) in our view.”
Bear Traps Report, November 15, 2018
The Flush to Come
There have been significant tops that Dow Theory sell signals did not catch. So paying attention to the philosophy may prove more important than catching a classic signal. Market participants need to review the theory at this point, there’s too much on the line. Friday, we closed right at major support on the industrials. A flush from here would bring colossal real money selling, and confirm the beginning of a new bear market in our view. What we found particularly troubling about yesterday was that we had good news on China and the market still flopped.
Bullish Signals for US Equities
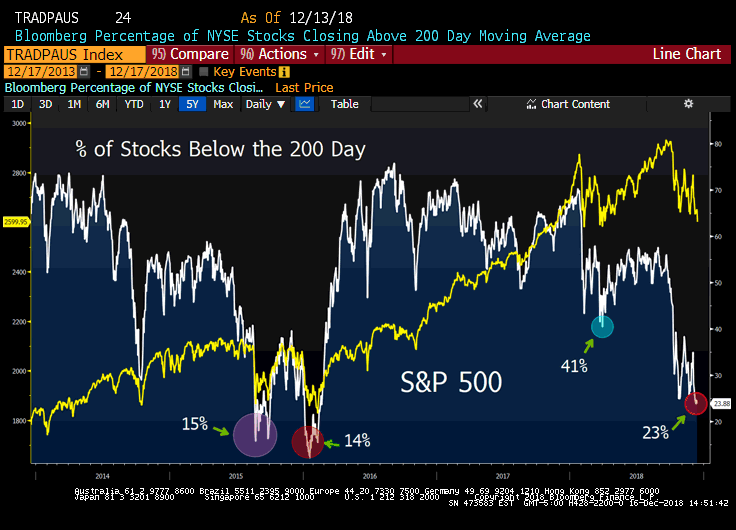 One important risk indicator we use is the Index of NYSE stocks % above their 200-day moving average. On Friday, she touched 23%. In the Post-Lehman era, this level has only been breached three times; 2011, 2015 and 2016. US equities as measured by the S&P 500 bounced 31%, 16% and 21% in the six months following these HIGH capitulation levels.
Triggered or Not?
Some argue the Dow theory isn’t triggered until the averages (Dow and Dow Transports) go to a new high and the other DOES NOT. The idea being you have an UNCONFIRMED new high FOLLOWED by CONFIRMED new lows. To our eye that has not happened.
Pick up our latest report here:
Don’t miss our next trade idea. Get on the Bear Traps Report Today, click here
