
“Our indicators tell us, we’re very close to a Lehman-like drawdown,” argues Larry McDonald, a former strategist at Société Générale who now runs The Bear Traps report.
Financial Times, February 20, 2020
*Our institutional client flatform includes; financial advisors, family offices, RIAs, CTAs, hedge funds, mutual funds, and pension funds.
Don’t miss our next trade idea. Get on the Bear Traps Report Today, click hereThe Recurring Highly Improbable
Great Panics and S&P 500 Drawdowns
Lehman Subprime 2008: -57%
Dotcom Crash 2000: -49%
Wuhan Pandemic 2020: -36%
Trade War, Rate Hike Panic 2018: -20%
Grexit Panic, Credit Default 2011: -20%
Oil Crash 2016: -16%
China Currency Deval 2015: -15%
That’s right, over twenty years – seven drawdowns from 15 to 57%. Bear Traps Report data, Bloomberg terminal.
“The only problem with losing 50% of your money? You need a 100% return to get it all back.”
Former Lehman Trader, Larry McCarthy
Passive Investing Victims
Why does the “highly improbable” happen with such predictive regularity? Complacency and hubris have cost investors billions of dollars over the last twenty years. Sure, the “buy and hold” crowd says if you stay invested it’s all good, but the facts tell a very different story. The average daily volume of the SPY SPDR S&P 500 ETF Trust reached nearly 300m shares in late March, close to 5x February levels. In March 2020, “long term” investors in the largest passive index fund on the planet were selling with both hands and two feet. Keep in mind, there are 916 million shares of the SPY ETF outstanding, so 300m shares a day speaks to a lot of fannies running for the hills. Unfortunately, much like the December 2018 swoon – a large swath of market participants, sadly “puked in the hole.”
“Always remember, human nature is your great enemy near market lows. At your absolute climax of fear, you must do the exact opposite of what you want to do.”
Charlie Munger
Since 2010, with conviction, we have stressed this core belief to our clients globally. “Fine, stay invested with 50%-60% of your equity market allocation, but cash MUST be put to work when stocks go on sale. This is where the best risk-adjusted returns are found.” It all comes down to buying stocks ahead of the policy response coming from central banks and government officials. In March 2020, we issued more trade alert buy recommendations than any other month in the last decade. As our old friend Seth Klarman likes to say, “buying right, NEVER feels good.”
A Policy Response and the Counter-Trend Rally
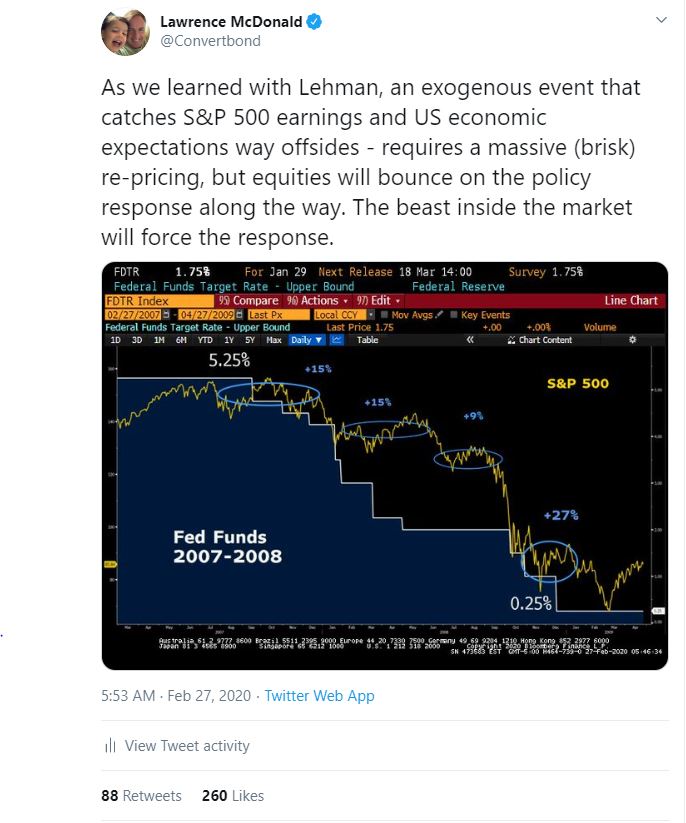 In our New York Times bestseller, “A Colossal Failure of Common Sense,” (now published in 12 languages) we made this important point. It rings true, year after year since Lehman’s failure. More often than not, the beast inside the market will provide the ultimate incentive for policy-makers to act. Lehman, a Greece default and the COVID19 pandemic; all violently tightening financial conditions, and literally forced the policy response from bureaucrats, politicians, and central bankers. Over the last 15 years, Fed governors have gone from firing bazookas to tactical nuclear weapons. See Mr. Powell’s new toolbox, it makes the 2008-2009 variety look like child’s play. At the same time, politicians have tossed aside austerity, running right into the arms of reckless fiscal spending at any cost. After all “with interest rates so low, it’s free money” they tell us over and over and over, again. MMT (modern monetary theory) is the new magic potion, governments don’t have to find buyers for their bond sales when central banks will finance run-away deficits.
Observation from a Friend
“Daily, we get consistent news about the economic devastation that is inflicted on the global economies together with the continuous and innovative efforts that governments and central banks are doing to do to minimize the impact of this devastation on markets and on people. As always, trying to stabilize markets is always easier, but whether that means that the people will be better off as a result is another issue. ”
See our Q2 Trade ideas here:
Don’t miss our next trade idea. Get on the Bear Traps Report Today, click hereA Fourth Turning, the Elliot Wave and Populism’s Rage – All Converge
We must keep a critical observation in mind. In the same way financial market stress brings upon the fiscal and monetary policy response, it also acts as a possible accelerant when it comes to political inertia surrounding populism.
Debt D-Day in Italy
Italy has a $2.4T debt problem, along with a likely 30% GDP contraction coming in Q2 2020 – the country is insolvent in our view, Greece squared. We know COVID19’s grave economic threat was a policy (fiscal and monetary) catalyst/accelerant. But we MUST ask ourselves, how much does COVID19 accelerate populism’s rage? Decisions that politicians would have had to make over the next 2-3 years are NOW brought forward, dramatically accelerating near term risks in our view.
Heavy NPLs
Total non-performing loans (NPLs) across the largest 123 eurozone banks are still near $530B, by the end of last year. But Greek, Cypriot, Portuguese and Italian banks still have NPL ratios above 6-8% – UGLY.
New Term Debt Maturities – OVERLOADED
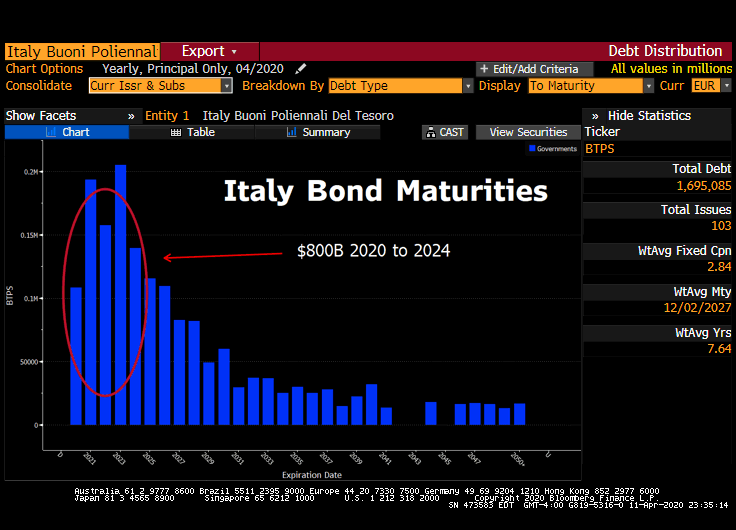 With $800B in debt maturities coming due between now and 2024 there are some tough decisions to be made. Germany now owns Italy’s $2.4T debt profile, political leaders just don’t know it yet. The $1.6T stated above is the public debt, there’s another trillion behind the scenes. The Eurogroup has proposed corona-bonds, but there’s serious pushback in northern Europe (Holland could leave the EU in a near-term showdown). In the south, Italy’s populist sensation Matteo Salvini will use any pushback as a reason to threaten to walk (finance our debt or we exit, take it or leave it – all of this is VERY sterling bullish by the way). Fratelli d’Italia, a party that is further right than Matteo Salvini’s Lega, has reached a new high of 14.5% (up from 4.4% six months ago) in Tecnè’s latest poll.
Political Risk is Drawing Forward Bank Credit Risk
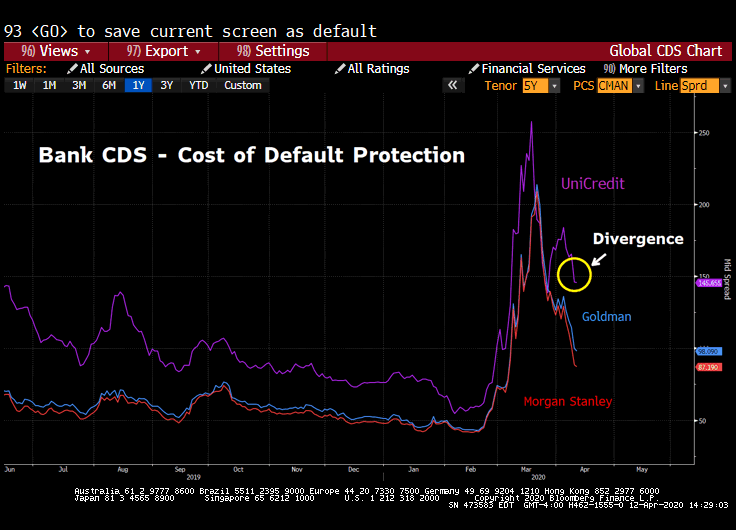 Alert: Italian bank credit risk spiked in recent days, see the five-year credit default swaps – the cost of default protection for UniCredit. See the credit divergence away from Morgan Stanley and Goldman.
Sovereign Credit Risk – Italy vs. Germany
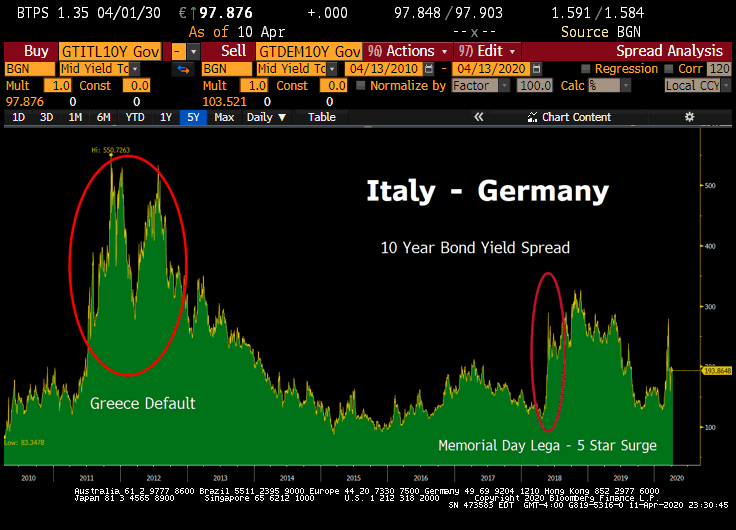 Italy’s ten-year bond yield spread is pulling away from Germany, spiking wider in recent weeks as populists’ demands surge.
Beware, the Elliot Wave is Starting to Line Up with Political Risk Trends
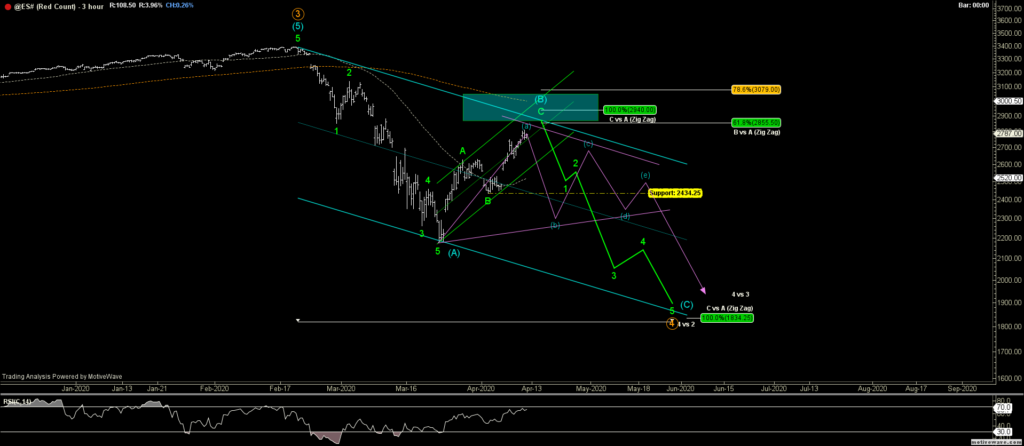 After the counter-trend rally, the green line represents the future Elliot Wave trend, this chart from Aleksandar Koprivica. The point 5 target is near 1834, close to 1000 handles below this last week’s high near 2800 (S&P 500). Elliot Wave doubters make a lot of solid points. Stand-alone Elliot Wave signals mean little – but when corroborated with cross-asset class (credit markets, forex, etc..) signals and large shifts in political risk, they mean a lot.
Fourth Turning
In their book, The Fourth Turning, published in 1997, Strauss-Howe proposed a generational theory of history in which societal cycles repeat every 80 to 100 years. The cycle is composed of four generations: the first generation builds (think post-WWII), the second generation is one of cultural awakening (think the ‘60s); the next generation exploits and unravels (think yuppies); and then follows crisis leading to a new order for the fourth generation (think now and the immediate future). After giving several centuries of examples, in the third to last chapter they predicted the rise of a blunt, populist-nationalist given prior precedents. And indeed Mr. Trump was elected president – the nailed it. Their description of the hypothesized leader reads almost exactly like the president of today. As per the theory, we should be heading into a crisis from the ashes of which will rise a new vision of what society is and should be, differing markedly, in our case from the 1950s. They further posit a gray-haired old man prophet who would point the way (Bernie Sanders?). Sure, thanks to some help from Elizabeth Warren’s early exit and a creative DNC (Democratic National Committee), Bernie is history, but this is still a remarkably prescient call. Now, this may fit in with Elliott Wave theory.
S&P 500, a 3400 to 2200 Drawdown – and the 50% Retracement
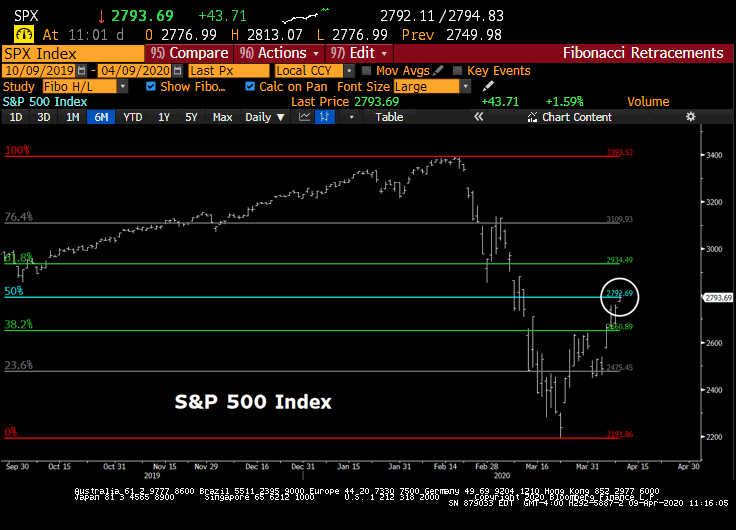 It is obvious to everyone that the recent sell-off in the S&P 500 from the February highs near 3400, has all the characteristics of a primary impulse wave down. In our view, this is clearly Elliott Wave 1, with a powerful countertrend rally, a 50% retracement on the mark.
Great Counter Trend Rallies in Bear Markets
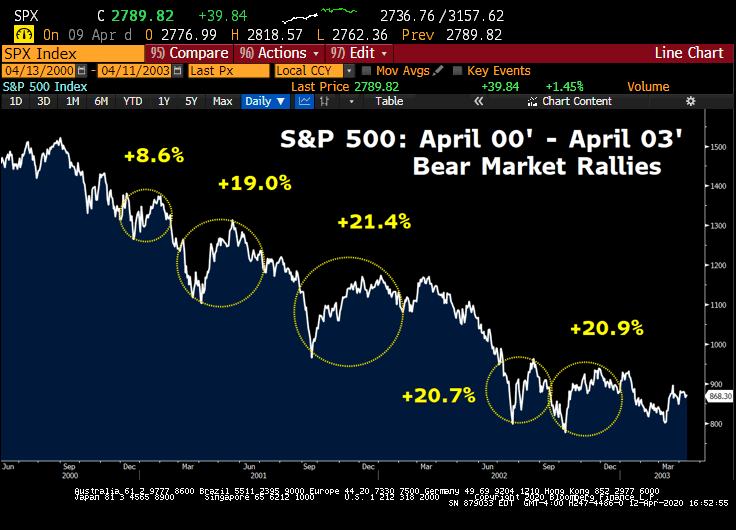 If we look back at all the great U.S. equity market drawdowns; from 1929, 2008 and 1999 – in each there were massive, counter-trend rallies, some lasting quite a while.
April 2020, the 50% Retracement after the Policy Response
In recent weeks, with conviction we felt a wave two rally to the midpoint of the prior decline (50% retracement) would follow the $6T fiscal and monetary policy response coming from Washington. Last month in our Bear Traps Report, we emphasized a follow-on standard a-b-c format of two waves up with a pause in between. This occurred and constitutes wave two. The prior “wave one” decline that bottomed this past March 24, was a classic “shock” decline. The ensuing “wave two” move higher is a classic, follow-on, “hope” rally. The shock was the virus and lockdowns. The hope is based on pandemic following bell curves in South Korea, Italy, and Germany which projects a much more manageable crisis by April end. Not over, but a lot less bad.
We are now approaching Elliott Wave 3-lower, which is the “recognition” phase decline, the “gig is up” sell-off when the mad mob realizes “it is all over”. There follows another wave 4 up or sideways. Then, there’s a final decline wave 5 which is the “exhaustion” decline, in one word; despair.
Uncertainty, about to Take on New Meaning
We are about to enter a period where the largest % of U.S. corporations during an earnings season will withdraw forward guidance. Above all, our functional recognition of unemployment is about to change dramatically – a true secular change. Unemployment will be either double or triple (or maybe more) what it used to be. Governments will have to find ways to fund the spending of former service sector employees. Governments have out-lawed casual consumption and will have to replace that former reality. We estimate, 5-10% of service sector employment will transition into entirely new fields like infrastructure. As you can see, this landscape does not paint a picture of high animal spirits.
Headfake After Headfake – Spring into Summer
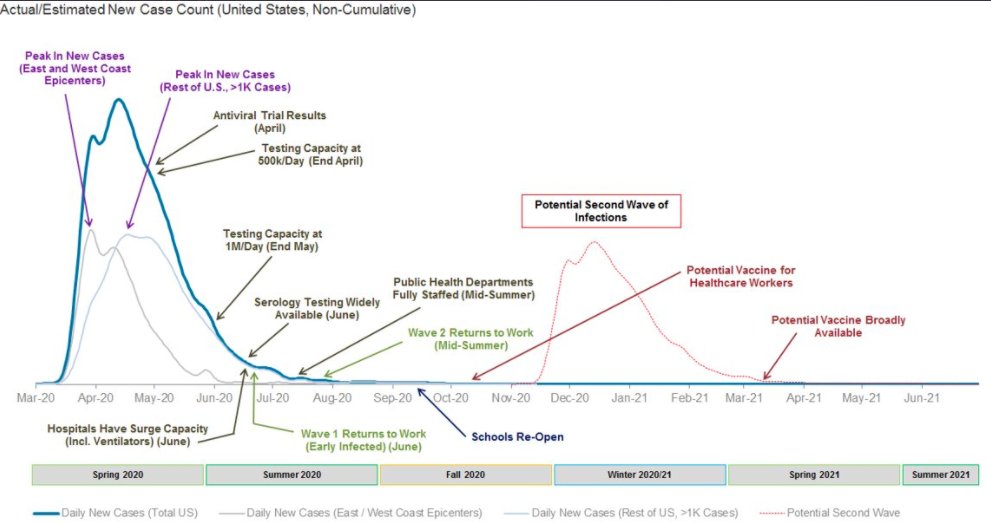
The most likely cause for a “recognition” wave three – a substantial move lower – will be the realization that re-starting the economy will be more than difficult. See the second wave of infections (above), expected in the mid-November 2020 to Mid-January 2021 time frame. The recovery process won’t be impossible, but a sentiment killer. The U.S. economy’s multiplier effect desperately needs the defibrillator after a violent sudden stop, that’s NOT happening anytime soon. Not every U.S. state will open economic activity up simultaneously. As lockdowns partially and intermittently relax, not everyone will return to work. Federal and state unemployment insurance plus the stimulus legislation effectively pay people $22 an hour on a forty-hour week. Many will receive $15 an hour on a 30 to 35 hour week. So they won’t return to the workforce until August. Furthermore, crowded venues will be far less in demand. Over 60% of the U.S. economy is service-based, and much of that will come back very slowly – over 36 months. As the populist threat surges, a certain, $1T plus infrastructure bill will create lots of jobs, but if successful it will trigger mass migration out of urban centers. Society won’t be the same for years, NOT months. So the recovery will be halting and fitful. That is the stuff wave three sell-offs are made of, when everyone recognizes “this ain’t gonna be easy.”
Alternative Count
Now, the problem with Elliott Wave Theory is that it purports to be exact. Sometimes it is. But sometimes it’s fuzzy. It is part and parcel to posit an “Alternate Count” which re-characterizes the prior wave formations.
So in the instant case we have lived through, described above, the Alternate Count would label the March low as the end of wave A, the recent rally wave B, and the upcoming smash will constitute wave C. Under standard practice that would be the end of it and a sustainable bull market would ensue, though again, there are caveats, variations and complications even with the Alternate Count too exhausting to detail for present purposes.
But here is the real point of both the Preferred Count and the Alternate Count: get out of the way. Hall of fame tactician Marty Zweig used to say that he didn’t care if it was a correction or a bear market, he didn’t want to be “long” or “own” either one.
From a tactical point of view, it doesn’t matter if the next decline is wave three of a five-wave formation initiating a secular bear market, or wave C of an a-b-c correction that will be over soon enough and will lead to a new secular bull market in a couple of months. Both are devastating declines leading to significant new lows.
That said, there are reasons to favor the Preferred Count for a long term bear market. One is the Fourth Turning. If indeed we are going through a once in a multi-generational socio-economic transformation, it should be gut-wrenching and time-consuming, fraught with career-ending risks, volatility, and surprise. A quick a-b-c selloff a few months in duration doesn’t fit the bill for such vast and permanent multi-generational socioeconomic transformation.
Furthermore, the Fourth Turning and the Preferred Count in Elliott Wave Theory are mutually reinforcing. If there is to be multi-generational socioeconomic transformation, then the bear market should last years, peppered with mind-blowing rallies along the way.
On the other hand, if the Preferred Count in Elliott Wave Theory is correct, then we are in the early stages of a protracted and devastating bear market symptomatic of a painful, fundamental and permanently transformative mutation in the economy and in society.
The Fourth Turning reinforces the Preferred Count and vice versa.
But that is not all. There is a basic rule in trading: parabolic rises are followed by parabolic declines. Think when the Hunt brothers cornered silver. It shot up to $50 an ounce only to collapse to $5. Think when the dotcom bubble burst. The NASDAQ closed the month of March 2000 at 4572 only to decline to 1172 by the close of September 2002.
Dow Parabola
Now, if you look at a long term chart of the Dow Industrials, you see a clear parabola. The snap-off of a parabolic top is unsubtle and unmistakable. We are in the decline phase of the parabola.
*In mathematics, a parabola is a plane curve which is mirror-symmetrical and is approximately U-shaped. It fits several other superficially different mathematical descriptions, which can all be proved to define exactly the same curves.
Dow Jones Industrial Average
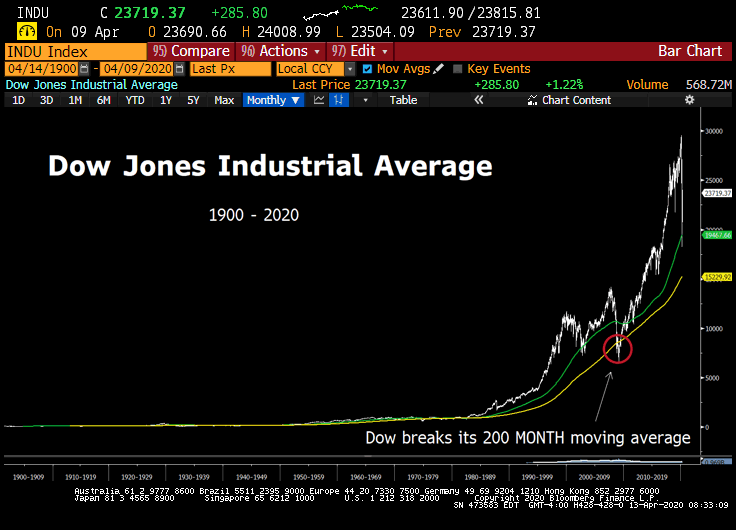 During the 2008-2009 drawdown, the Dow Jones Industrial Average broke its 200-week moving average, today this number sits down at 15,229.
Gold, MMT, and Central Banks
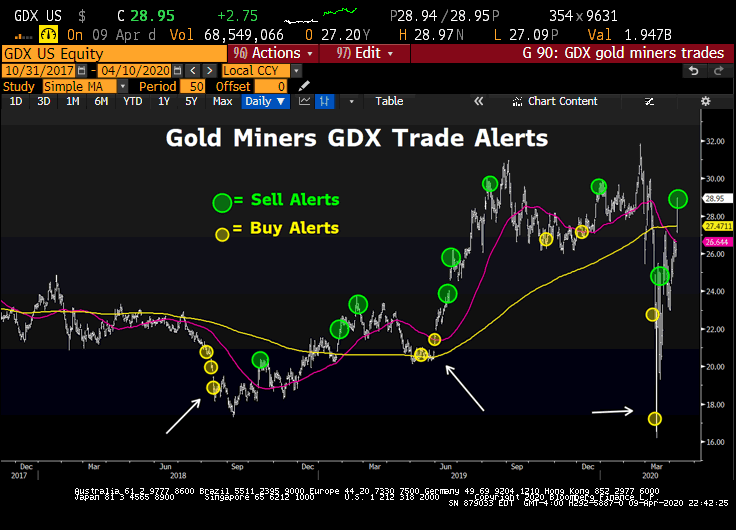 In recent years, buying gold miners when they’ve gone on sale has led to exceptional profits. As investors put less trust in central bankers to control asset prices (deflation or inflation), gold comes into high demand. The latest Fed Balance sheet tally printed on Thursday at $6.08 Trillion, that’s up from $3.85 trillion just 6 months ago. The lesson from the 2008 financial crisis comes down to a Fed not taking their foot off the asset purchases accelerator until the economy is well into an expansionary era. In this environment, precious metals remain HIGHLY attractive. We remain long 1/3 gold miner position, with more significant exposure to silver and copper. We have seen massive and coordinated fiscal/monetary response to this crisis, and one who’s footprint will outlast the current issues plaguing the global economy. The other side of this? The capital to be issued (bond sales), MUST be taken up by respective central banks via substantially increased asset purchase programs. The age of MMT* has arrived, and a lot sooner than most had projected. Pretty much every developed country in their response to COVID19 is going to be engaged in some form of MMT, where government deficits are largely financed by
the central bank. We believe the implications of this are enormous, and the beneficiaries should be commodities and cyclicals especially as the Fed and U.S. Treasury seemed determined to keep a cap on the U.S. dollar. Email tatiana@thebeartrapsreport.com for our latest report.
*Modern Monetary Theory (debt monetization) is a macroeconomic theory and practice that describes the practical uses of fiat currency in a public monopoly from the issuing authority, normally the government’s central bank. Using a central bank to finance bond sales, in other words, a Ponzischeme.
Lessons from Bretton Woods
What happened? What caused the parabola in the first place? A little history…
The US left the gold standard in 1933 to combat the depression. The dollar’s ties to gold were cut, allowing the government to provide monetary liquidity to the financial system, and assisting the Fed in its effort to lower interest rates. But the dollar was still not completely a fiat currency. The U.S. still allowed foreign governments to exchange dollars for gold. In 1971 the Bretton Woods monetary system arrived, the Nixon adminestration put an end to foreign governments from liquidating their dollar holdings into gold, thereby depleting our own gold reserves. If you think about it, that act shows little faith in the fiat currency. The motive should have been to maintain dollars in circulation to maintain a liquidity preference for the dollar. But in fact – it was the spectre of depleted gold reserves that caused the final and full transformation of the U.S. dollar into a fiat currency.
After the dollar went full fiat in 1971, the Industrials traded in a wide sideways range for over a decade. A month-end high was made December, 1972 at 1020, followed by month-end low of 608 on September 1974, in turn followed by a month-end high of 1004 on December 1976, with a final monthly low set end of June 1982 at 812, albeit an intra-month low followed at 780.
But then the market began to truly rally. That summer seasoned veterans were leaving the floor mid-day their faces literally drenched in tears. Unforgettable. Suddenly the Volker interest rate shock was working. Inflation at long last was moderating. And if high interest rates worked, that meant they wouldn’t need to last. Thus began the great bull market in US treasuries that still endures down to the present day.
The resultant improvement in economic conditions and relaxation in monetary policy fueled a super-trend long term bull market that indeed was interrupted by bear markets but went parabolic with Quantitative Easing from the Great Recession. That super-trend long term bull market started in that summer of 1982. That super-trend bull market ended in February 2020. A thirty-eight year run. Remarkable.
The chart on the Industrials shows the foothills of the parabola. When the Industrials first closed over 1200, everyone knew. “This is it!” It was an amazing moment of renewal of optimism and confidence.
True, there was a large sweeping sideways motion from the burst of the dotcom bubble to the end of the Great Recession. Thus were completed the foothills of the ensuing parabola.
From a monthly closing low of 7698.92 on the Industrials, set at March 2009, to the closing all-time high of 29,551 on 2/12/2020, an astonishing run of 21,942 points!
A parabolic decline should retrace roughly 80% of the parabolic rise. It has happened that 100% has been re-traced. An 80% decline would be 17,554 points off the top, for a target of 11,997 in two to five years.
What could cause such a catastrophe? The death of fiat money. Note that in the entire history of civilization, no fiat currency has lasted even 90 years. Ours started in 1933…
The first record of fiat currency is found in the Travels of Marco Polo. He described paper money as “a kind of magic.” The liquidity it provided the Chinese Empire created the incredible wealth in city after city, as detailed in his chronicle, which was intended as a map for trader merchants. Alas, the prosperity didn’t last – deficit spending paid by the printing press collapsed into a debauched currency and unprecedented economic devastation. What ensued? A return to gold as the medium of exchange.
The USA now has a debt to GDP ratio of over 100% for the first time since WWII, which, say what you will, caused more death than the current pandemic.
How long will the economic collapse following the death of fiat money presaged by the end of the parabolic rise of stock prices fueled by Quantitative Easing? Years, thus requiring the Preferred Count in Elliott Wave Theory, thus fulfilling the prophecy of the Fourth Turning.
Don’t miss our next trade idea. Get on the Bear Traps Report Today, click here

