Join our Larry McDonald on CNBC’s Trading Nation, Wednesday at 3:05pm ET
Pick up our latest report here:
Don’t miss our next trade idea. Get on the Bear Traps Report Today, click hereIn many cases, sell-side research (from the major banks) reminds us of the plump chef standing at the head of an “all you can eat buffet.” Rarely would he whisper health tips into your ear or provide guidance toward restraint. “Eat up Johnny, all is good.”
In all our years on Wall St., one major takeaway is the danger found in “broad theme consensus.” Decade after decade we’ve seen this play out in so many different forms. The more unanimous the sales pitch, when you hear it on every street corner, it’s the best leading indicator to RUN, not walk the other way.
The 2012-14 Sales Pitch: Four “Irrefutable Truths”
 Look back to the summer of 2014. Retail investors were lectured, over and over again on the “four irrefutable truths.” MLP companies are 1) toll road businesses, with 2) fixed fees, 3) secure long-term contracts, and 4) the commodity price (oil and gas) doesn’t matter. Of course, ultimately investors learned these truths were more than refutable. Over the next 18 months, the average stock in the MLP sector would lose nearly 70% of its value (see below).
MLP (Master Limited Partnerships) in the Energy Patch
MLPs are pass-through entities, which distribute almost all pre-tax income to unitholders, who then are responsible for paying the taxes on it according to their individual situations. As such, they benefit from a very advantageous (almost 0%) tax treatment, while regular “C” corporations pay a 21% statutory tax rate (35% prior to tax reform). Since 2005 MLPs have been able, in the FERC’s words, “to recover an income tax allowance in their cost of service” — effectively boosting the amount of pre-tax income to be passed through. This “double recovery” of income tax costs that MLPs enjoyed is now disallowed.
Beaten Up Value, Left for Dead
“The investment industry has long misunderstood the business models and the analysis has been reflective of that misunderstanding. Until 2015, MLPs paid an increasing percentage of CFFO back to investors, peaking as an industry at >90%. However, since CAPEX and debt servicing also needed to be paid, debt leverage quietly increased until Debt/EBITDA approached 6x (from normalized 3.5-4x Debt/EBITDA for years) for the industry by the end of 2015. Finally, when oil production peaked and started to fall in 2015, the credit agencies required pipeline companies to reduce leverage, and dividends were cut substantially. The dividend cuts scared retail investors, and even today many believe that the business models are under threat. The sector has fallen dramatically and has deeply underperformed the broader markets. Instead, many pipeline companies are actually doing well, at least operationally. What has been difficult over the last 2 years is that the marginal dollar of cash flow is being sent to the debtholder and not the equity holder. For an investment vehicle that is intended to deliver income to investors, incremental dollars not being returned to equity holders is a problem. However, as in most leverage recovery situations, the recovery is a 2-3 year process and is now going on 3+ years. So companies like Kinder Morgan (KMI) cut its dividend by 80% in Dec 2015, and has for the first time since then, guided to increase its dividend by 50% in 2018, and 25% for a few years further into the future. And by the way, KMI’s EBITDA is higher in 2017 than it was in 2015, but the stock was at $40 in the first half of 2015 and is now below $19. We generally look at these companies comparing the RoIC vs the WACC. The relationship between ROIC/WACC tells us what multiple of Invested Capital we should be willing to pay for the business. So if a co has ROIC=WACC then it adds no additional value to the capital it has invested and the company should be valued at only its invested capital, no more no less. If a co’s ROIC is 2x the WACC then the company should trade at 2x the invested capital, and so on. What is interesting about the group today is that most companies are trading right around their invested capital, and sometimes at discounts. Historically they’ve delivered 1.25-1.75x their WACC, and that is what makes the opportunity so interesting.”
Mark Laskin, from 2013-2017 he was the CIO of T Boone Pickens’ BP Capital Fund Advisors, where he managed Energy and MLP portfolios.
King of Retail Pain, MLPs
 The ultimate goal of the Bear Traps report is to discover bear markets transitioning into the new bright bull. Last year we were fortunate to get the solar, oil and steel sector migration north right. This year in the MLPs, we got sucked into a bear trap in January. In error, we chased this group (see the red circle above) into what we believed was a new bull market. We could have stopped ourselves out (stop-loss sell) but our cost basis was manageable from a trading perspective. Today, coming out or the grip of a multi-year grizzly bear market, we believe the MLPs are very close to a major bullish move higher. Over the last few years (see above) we’ve witnessed an incredible amount of capitulation selling. Only when the last retail investor (previous heavy ownership) has given up on the sector can it move higher. The question is, who’s left to sell?
Pick up our latest report here:
Don’t miss our next trade idea. Get on the Bear Traps Report Today, click hereMeasuring Capitulation
Our seven-factor capitulation model quantifies the “fannies rushing to the exits”, and looks back historically in an attempt to measure the selling pain. Is this a category three hurricane, or a more treacherous Cat 5?
In November’s first major MLP capitulation, we had an 18% gain from our AMLP entry into the new year (see above). Next, we tried to buy on the trend break (red circle above), thinking this was the great jailhouse break out of the bear’s multi-year grip. Next, we were met with a painful second round of selling last month, and we should have, in all likelihood, lightened our position there. In October, she was trading 9M shares a day, but by the November capitulation, it was 20M a day! They were jumping over the seats, swinging on the chandeliers, trying to get out through the bathroom window, the wild mob wanted OUT of the MLPs. Moving forward to the March capitulation, we had reached 25M shares a day, a true panic yet again! Who’s left to sell the MLPs?
Pick up our latest report here:
Don’t miss our next trade idea. Get on the Bear Traps Report Today, click hereRising Interest Rate Risk
“It is true that in rising rate environments the relative performance of MLPs to the S&P 500 is lower, but relative to other known rates-like sectors (such as utilities and REITs), MLPs tend to outperform. This makes sense as oil prices are the key driver, and oil often goes up in hiking cycles. As oil prices continue to rise we expect MLP performance to turn higher as oil becomes the marginal driver. Over the past decade, MLP correlation to crude prices has remained quite high. Against the rate backdrop it is important to notice that in credit spread terms, MLP yield valuation are getting very attractive again, especially given these oil price levels and their trends. The average spread of Alerian MLP (AMLP) to the Ten year treasury yield since 2000 has been around 350bps, and is currently over 600. The yield valuation is there while AMLP yields over 8%. Bottom line, MLPs are a BUY (AMLP equity) in our view with an attractive risk – reward.”
Bear Traps Report, March 28, 2018
Impact of FERC (Federal Energy Regulatory Commission)
 The Federal Energy Regulatory Committee (FERC) ruled last month that it will revise its 2005 Policy Statement for Recovery of Income Tax Costs and no longer allow master limited partnership (MLP) interstate natural gas and oil pipelines to recover an income tax allowance in the cost of service rates. The news triggered a dramatic capitulation sell-off (see above) in the MLPs out of fears of a considerable hit to their operating profit.
Pick up our latest report here:
Don’t miss our next trade idea. Get on the Bear Traps Report Today, click hereFERC Noise
With the recent developments since the FERC rate policy change, the stocks most impacted were those with higher exposure to the cost of servicing pipelines. Given the weakness in EEP and TCP, which are also financing vehicles for C-Corps, we could see difficulties in executing drop downs, a way energy companies monetize the midstream part of their operations. Most of the other MLP names are not as exposed to this recent FERC-related negative impact on the share price, as their drop downs look ok to us. The most impacted pipelines under this ruling are those that have legacy costs of service rates, and those that are earning at their maximum rate. However, the FERC ruling applies only to interstate pipeline assets and not to those that originate and terminate within the same state. Furthermore, the rule is not expected to go into effect until 2020.
In cases where the MLP holds the pipeline asset but a C corporation ultimately owns the MLP, the FERC rule applies. In a reverse case, where the C corporation owns the pipeline within an MLP, the asset would not be subject to the ruling. As a result, we could see strategic reviews and acquisitions within the MLP sector to circumvent the income tax order. Examples of these would be refining companies buying back assets currently held in MLPs (see our M&A section above). The ruling does not apply to, for example, Kinder Morgan (KMI), which acquired its MLP some years back. But in the case of Williams Co. (WMB), it might be collaborating with Williams Partners to create a new corporate structure to hold long-haul assets like its Transco gas pipeline. This is a big opportunity that is certainly worth watching.
The Takeaway
The period of time (between today and the enactment of this tax code restriction), where corporations have the opportunity to buy (and therefore secure) a tax-advantage that they previously saw more value in divesting. They were wrong, and they now have the chance to fix it. Ultimately, only a few MLPs will see a meaningful impact on their earnings from the FERC ruling. On the other hand, we could see strategic reviews leading to some buybacks of MLPs that were spun off in the past. Refiners have spun out their pipeline assets into MLPs in prior years, but may now want to buy them back to circumvent the new ruling.
 This is a bit of a mindblower. Over the last twenty plus years highs in the gold-silver cross (extremely weak silver pricing relative to gold) were met with bear markets in global equities. Which makes a lot of sense, for decades silver has been a global economic bellwether. In the 2017-18 global equities, paradigm stocks have climbed even as silver has dramatically cheapened. To us this speaks to deleveraging in China, industrial metals are pricing in some pain, a lookout warning for the global economy (and equities). Pick up
  Oil bulls have their minds on 2012. As the U.S. launched touch sanctions with a bullseye focused on Iran’s oil industry. Exports plunged by over one million barrels a day. As we look toward the May 12 deadline on the Obama era Iran deal, a repeat of the drama six years ago would DOUBLE the expected supply deficit in the second half of this year.
 The surge in three-month libor matters because the entire ecosystem of U.S. short-term corporate finance is being repriced. The Street is finally waking up to credit risk tied to rising rates. In recent months we’ve warned, at the current pace of spending in Washington – a year from now we’re looking at quarterly Treasury auctions in the neighborhood of $23B – $26B for long bonds vs. $13-$15B now. But above all, we must keep our eye on short-term, adjustable rate corporate finance.
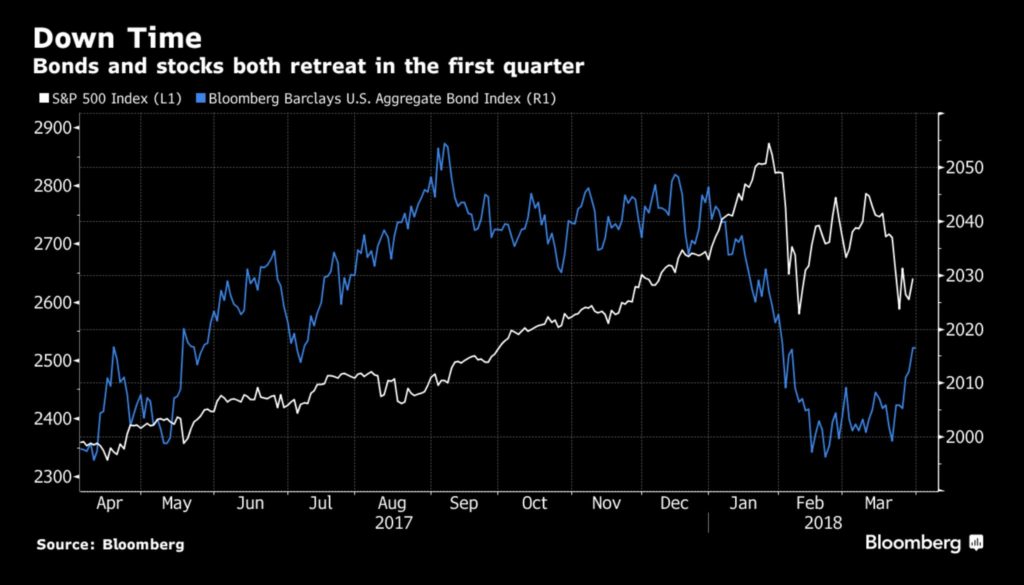
 In the 70s and 80s this was very common – over 21 instances where stocks and bonds sold off together two weeks + (clearly inflation-driven). In the 90s only a few (3) instances, From 2000-2018 there had been nearly zero 2-3 periods where stocks and bonds moved lower together – UNTIL NOW. As you can see above. In the 2010, 2011, 2014, 2015 and 2016 equity market drawdowns – bonds rallied in a substantial fashion. In every “risk off” regime, it has been stocks DOWN – bonds UP for as far as the eye can see. This month, for the first time in nearly two decades, the negative correlation between stocks and bonds turned positive. This is a MAJOR game changer for the wealth management industry.