
Institutional investors can join our live chat on Bloomberg, a groundbreaking venue since 2010 – now with clients in 20+ countries, just email tatiana@thebeartrapsreport.com – Thank you.
Lawrence McDonald is the New York Times Bestselling Author of “A Colossal Failure of Common Sense” – The Lehman Brothers Inside Story – one of the best-selling business books in the world, now published in 12 languages – ranked a top 20 all-time at the CFA Institute.
At 9 am Friday morning, the WSJ’s Nick Timiraos made a market-moving call from the highest mountain. The talented financial journalist — a classic pawn of the Fed — startled investors from the beaches on Long Island to the skyscrapers of Japan. After talking up extremely aggressive (rate hikes) action from the U.S. central bank for much of the last five weeks – Nick published a piece that pushed back against excessive rate hike expectations and suggested the Fed is not going to overcook the Porter House. An hour later, the BoJ (Bank of Japan) comes in and starts a massive forex intervention, pushing the yen up 3% in the span of an hour. Coincidence? It was an “inside job” — let us dig in.
Catastrophic Damage Potential
 In our view, Joe LaVorgna is the best economist on Wall Street, he shared this important chart with clients this week. “Interest-rate changes have their peak effect on growth in about one year and on inflation in three to four years. “ IMF Paper recently released.
Over Cooking the Porter House
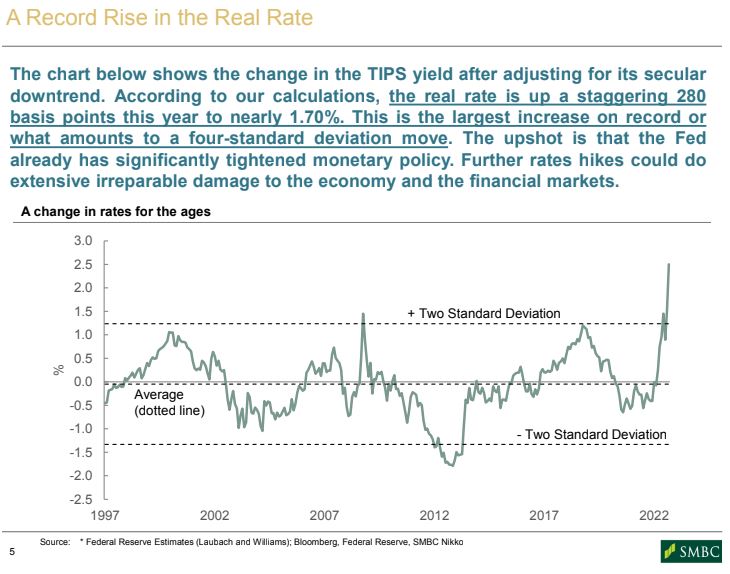
More than 300bps of rate hikes in six months, $50T more debt on earth since 2018 – how does one calculate the damage? The MOST important fact of the day, week, and month? The Federal Reserve DOES NOT know the extent of the damage they have ALREADY inflicted!
“It always takes 6-12 months to quantify a move in rates impact on the underlying economy – thus central bankers most often over ease and over-tighten” – Milton Friedman.
Yen Move and its Connectivity
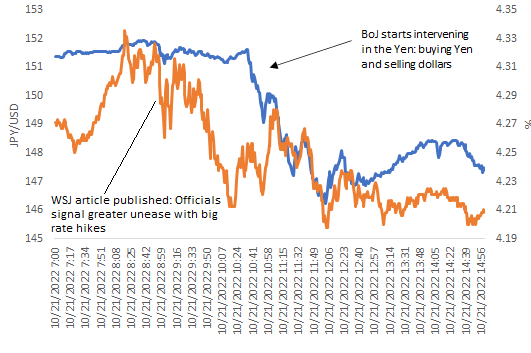 The U.S, ten-year bond yield (orange) vs. Japan´s yen (blue) — Always, always. Always, always connect the dots. There are no coincidences. The Fed, the White House, the Wall Street Journal, and the Bank of Japan – were all working closely together on Friday morning.
Yen Move vs. Gold Miners
 The prospect of a softer Fed policy path juiced gold miners on Friday. The probability (interest rate futures) of another 75bps rate hike in December plunged from 65-70% to 25-30% and February´s formerly expected 50bp hikes fell from 50% probability to 25-30%.
“When former Federal Reserve Chair Paul Volcker took office in the summer of 1979 and quickly pushed interest rates to about 20%, it brought an almost immediate recession, but inflation took about three years to fall to manageable levels.” IMF
BOJ and Fed – all Together
 Bank of Japan – after their first intervention failed – they brought in the Fed for support in round #2.
No Coincidences
All the drama was no coincidence – since August – many market participants have piled into the same trades, a) Yen weakness – USD strength, b) yields up – bonds down, c) equities lower. This has been the playbook – a classic over-crowded trade. Suddenly the Fed pushes back against excessive hawkish market expectations, opening the door for BoJ to buy up the yen, thus forcing position unwinds. The BOJ wants and needs Fed support after their last – failed attempt to support the yen a few weeks ago. We believe they put a phone call in to Fed chair Powell seeking important, corroborating support.
Midterm Elections and the Market Bounce
 The Nasdaq is close to 9% off the October lows – Why now?
White House Makes the Call
 US PredictIt 2022 Senate Party Control Republican — The White House is as nervous as a long-tailed cat in a room full of rocking chairs. After months of kicking ass on the chances of keeping control of the U.S. Senate – there has been a fierce reversal.
More Dots to Connect – Asset Prices and Elections
The Fed was put on notice from the highest levels – White House officials were knocking on Fed chair Powell´s door this week. They couldn’t get OPEC to help oil prices lower, to support the inflation fight. Now politically – the S&P MUST move higher ahead of the BIG DAY on November 8th. Midterm elections are won and lost in suburbs, where 401Ks are even more important than the price at the pump. If you are inside the Biden White House – you desperately want equities higher, and fast and soon.
“San Francisco Fed President Mary Daly Says More Rate Hikes Needed, Dismisses ‘Pivot’ Talk” MarketWatch – October 5, 2022
Just after lunch on Friday it was Mary Daly, president of the Federal Reserve Bank of San Francisco. Daly stressed, “We don’t want to be too reactive; one can easily find yourself overtightening.” — “we don’t just keep going up at 75 bps increments, we will do a step-down, not to pause, but to 50 bps or 25 bps increments.” This is a SHARP reversal from Daly´s comments above from October 5th.
Quiet Period
“Heading into the quiet period – which started Friday evening – the Fed started to lay out a policy path shift to help support asset prices during the quiet period.” CIO NYC in our live chat.
Later in the afternoon – James Brian Bullard – the chief executive officer and 12th president of the Federal Reserve Bank of St. Louis came barreling in with further evidence of a coordinated policy path shift. He stressed the Fed should use more caution next year. Bullard is looking for a disinflationary process going into 2023. The slowdown in money growth is a positive factor for inflation. The Fed wanted to calm markets on the eve of their blackout period (which started Friday night, no more Fedspeak) ahead of their Nov. 1-2 policy meeting. This is an extremely dovish sales pitch relative to PREVIOUS – extremely hawkish expectations – “You’ve come off zero. You’ve gone to this much higher level of the policy rate. But once you’re at the right level, then you can just make minor adjustments at that point — maybe to stay where you are, maybe to go a little bit higher, based on incoming data,”
The Fed Just Opened the Door to a Softer Policy Path
“This judgment about where you need to be to put meaningful downward pressure on inflation, I think that’s a key part of the policy debate in the next two meetings.”
Fed governor Mary Daly said that policymakers should start planning for a reduction in the size of rate increases, though it’s not yet time to “step down” from large hikes. This is a SIGNIFICANT shift.
“It should at least be something we’re considering at this point, but the data haven’t been cooperating,” Daly said during a moderated discussion hosted by the University of California Berkeley on Friday. At the November meeting, “we might find ourselves, and the markets have certainly priced this in, with another 75 basis-point increase, but I would really recommend people don’t take that away as it’s 75 forever. A slowdown to more incremental increases of 50 or 25 basis points will be appropriate as the Fed’s benchmark rate gets closer to its terminal level for this hiking cycle, Daly said, per Bloomberg.
Don’t miss our next trade idea. Get on the Bear Traps Report Today, click hereInstitutional investors can join our live chat on Bloomberg, a groundbreaking venue since 2010 – now with clients in 20+ countries, just email tatiana@thebeartrapsreport.com – Thank you.
Lawrence McDonald is the New York Times Bestselling Author of “A Colossal Failure of Common Sense” – The Lehman Brothers Inside Story – one of the best-selling business books in the world, now published in 12 languages – ranked a top 20 all-time at the CFA Institute.
 Bernstein notes – “
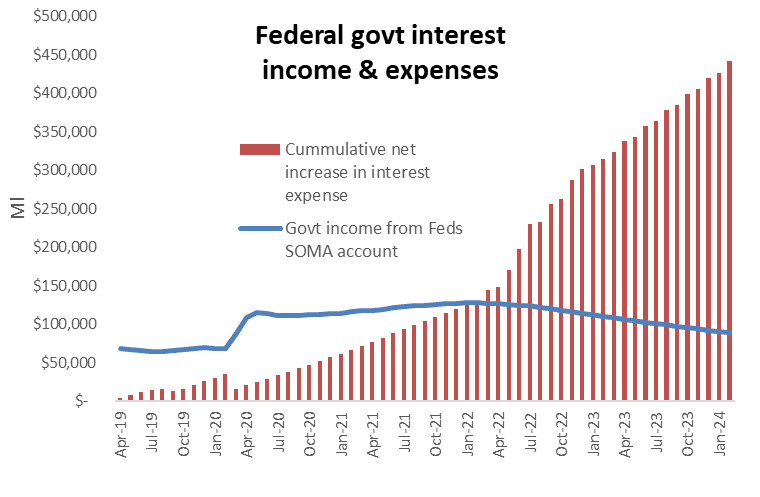 In the chart, we show how this works. The blue line shows the income from the Fed’s QE portfolio and compares it to the cumulative increase in interest expenses, from both higher interest on the government’s debt and the Fed’s payments of interest on excess reserves (IOER). This shows the $400bl negative swing next year in government income due to the deterioration in net interest income.
 We have a Federal Reserve promising to take their overnight rate to 4.5% (in March, just six months ago – the lending rate was 0.25%) and reduce this balance sheet by $1 trillion over 12 months – we were born at night, just NOT last night.
 Credit risk in Europe is near 2020 Covid Panic levels – central banks were cutting rates and handing out checks back then.
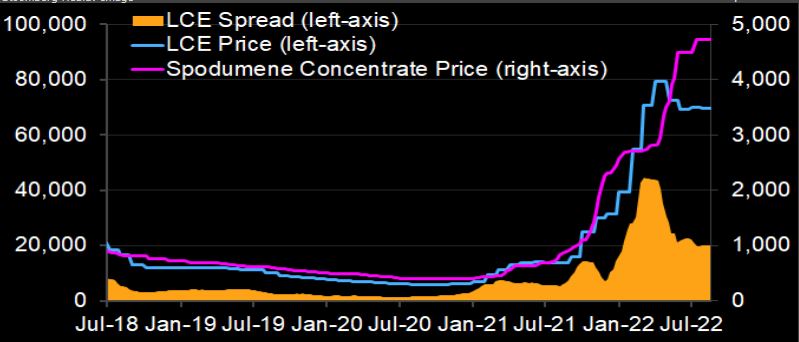 The lithium-refining spread — the price of lithium carbonate (LCE) or hydroxide minus that of spodumene concentrate — may surge through end-August. Bloomberg Intelligence notes the volume loss in lithium carbonate/hydroxide due to Sichuan’s drought-induced power crunch could amount to 12% of China’s monthly output, that´s after factoring in electricity rationing until Aug. 25. This would further tighten the market, already in severe shortage. Downstream demand among iron-phosphate and nickel-cobalt-manganese cathode makers has also been hit by power cuts, but the impact is smaller than for lithium refining. Sichuan’s lithium-hydroxide and lithium-carbonate production capacities are about 40% and 15% of China’s total. This winter, brine-based producers in West China may have to halt output as lakes freeze, adding to upward pressure on prices.
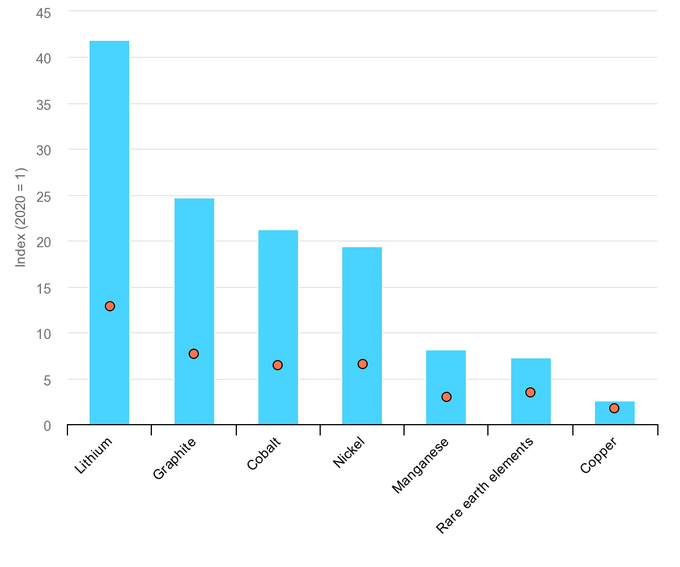 We are lectured weekly – Electric vehicle sales could reach 33% globally by 2028 and 54% by 2035. Really? Mining needs to grow 30X by 2040 to meet CO2 reduction goals using solar, wind, & batteries. Lithium production needs to increase by 40X. – Oklo data.
 Always watch tertiary credit in a crisis. CCCs are out across 12%, after seven straight weeks of losses. Financial conditions are tightening far faster than the Fed realizes. The funding window has shut down. Per Bloomberg, this month is on track to the slowest May since the global financial crisis of 2008. The year-to-date volume stood at $55.3b, a drop of 75% from the comparable period last year. Quality names are taking a beating – the average investment-grade corporate bond spread is at +150 basis points, the highest since July 2020. Credit markets have a veto on your plans Mr. Powell.
