
Institutional investors can join our live chat on Bloomberg, a groundbreaking venue, just email tatiana@thebeartrapsreport.com – Thank you. LGM
Over the last week – Russia’s Foreign Ministry has said that Ukraine’s accession to NATO would lead to a “large-scale escalation” of the war in Donbas & “irreversible consequences for Ukrainian statehood.” The Kremlin said – “the new situation in east Ukraine raises the possibility of full-scale military intervention.”
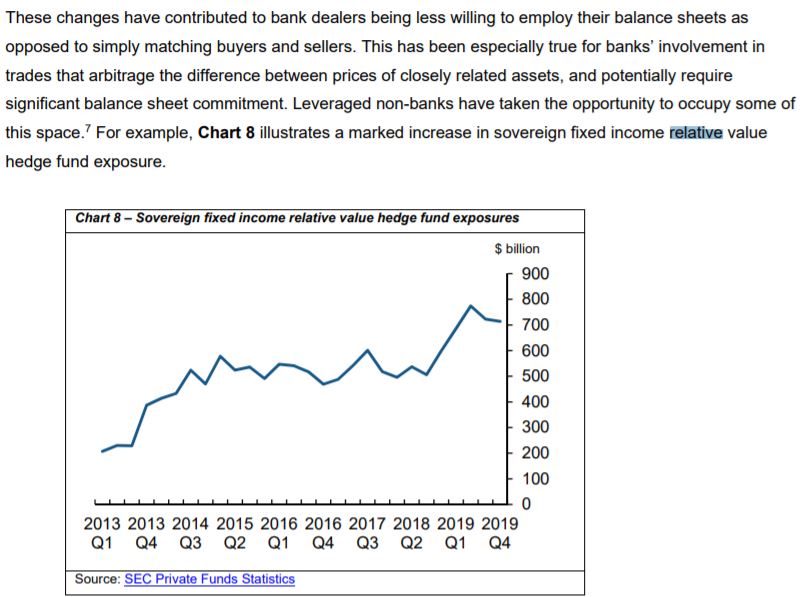
The fundamental problem with aggressive accommodation from central banks comes down to a market foundation built on moral hazard. Each day, week, and month the Federal Reserve provides more juice, the leverage piles up in pockets all over the planet. Of course, central bankers often don’t see the toxic leverage until it’s far too late. Here lies the conundrum. While providing excessive accommodation (the Fed is making $120B of asset purchases monthly), when traditional shocks arrive – as they always have – the market is ill-prepared. Far far less so than under normal conditions historically. Take Covid-19 for example. Many people forget the Fed embarked on additional quantitative easing in 2019. By Q1 2020, relative value hedge funds were running 20-1 leverage – yes, stepping in front of the steamroller to pick up $100 bills. One of the primary reasons why the Fed’s March 2020 bazooka was 5x larger than the weaponry used in the post-Lehman failure era (2008) – comes down to the enormous leverage in the fixed income market. The Fed literally had to put out a fire, 10x the size of Long Term Capital Management. In March 2020, at least ten hedge funds were on the brink of failure.
*A relative value fixed income hedge fund will go long vs. short either on the run (liquid) vs. off the run (illiquid) bonds or long cash government bonds vs. futures contracts. After all, a 1% annual return levered 20x magically becomes 20%, just insert the steamroller. These funds will PRINT fabulous returns year after year and then give it all back in a week – they NEVER learn.
The Relative Value Hedge Fund Blow Up
 Central Banks are the GREAT enablers, they fuel leverage and turn traditional shocks into something far, far more dangerous.
The Coming Shocks
After President Obama was elected, there was the classic test from the bully that is Vladimir Putin, some say he disdained him. Russia’s move? He took Crimea and put Eastern Ukraine, converting the region into a permanent low-grade conflict. Putin realizes the best border that he can most easily exploit while giving Russia a geographic buffer against the West is a long-lasting, low-grade conflict in quasi-failed states within his sphere of influence. Hence Georgia. Hence Transnistria Romania. Hence Syria (love that Mediterranean port!). Today, adding insult to injury – he is militarizing the Arctic Circle. As our clients are pointing out in our live institutional chat on the Bloomberg terminal – before every invasion, the invader tries to first establish the moral justification for an invasion. Russia has already started to build a “humanitarian” justification for direct action – a strong indicator of possible action. This is exactly what is going on now.
Ukraine, Impact on Risk Assets
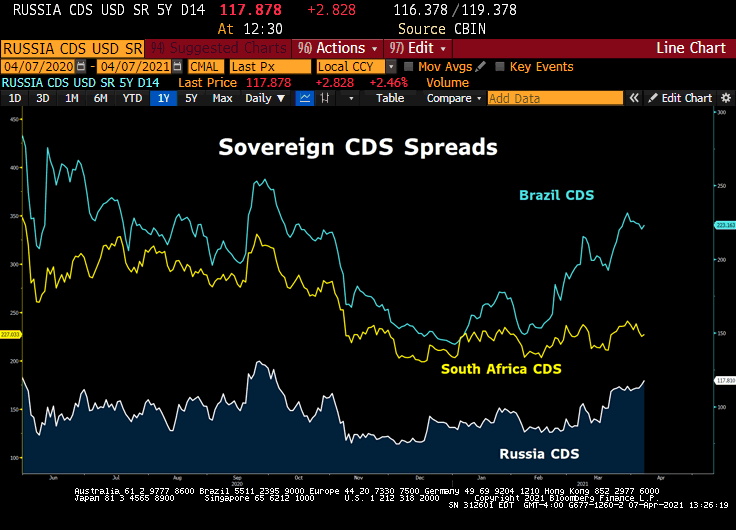 So far there is some evidence of additional risk being priced into risk assets. The cost of credit default protection on Russian sovereign debt is underperforming vs. South Africa and other emerging market counties, but not Brazil.
The Ukraine – Taiwan Risk Connectivity
China did not make a move during Obama’s reign, nor Trump’s, and Xi may think that represents a missed opportunity. But the Chinese military really wasn’t up to snuff back then. On April 21, 2016, Xi became Commander-in-Chief of China’s Joint Operations Command Center of the People’s Liberation Army. To quote Ni Lexiong (lecturer at Shanghai University of Political Science and Law), Xi “not only controls the military, but does so in an absolute manner, and that in wartime, he is ready to command personally.” At some point, you have to walk the walk, not just talk the talk. China’s military has been built up, primed, and readied. Numerous senior officials in Biden’s DoD (Dept of Defense) are ringing alarm bells about potential Chinese aggression i.e. — against Taiwan. As Niall Ferguson reminds us all, since the Communists’ triumph in the Chinese civil war in 1949, the island of Taiwan had been the last outpost of the nationalist Kuomintang. And since the Korean War, the U.S. had defended its autonomy. Taiwan is still treasured land for Xi and China.
Meanwhile, our own military brass has been complaining for decades about how it would be very difficult for the U.S. to fight three wars simultaneously. Think – Ukraine, Taiwan, and some sort of the Middle East/Central Asia/Iran mix.
RSX Russian Equities vs. Emerging Markets EEM
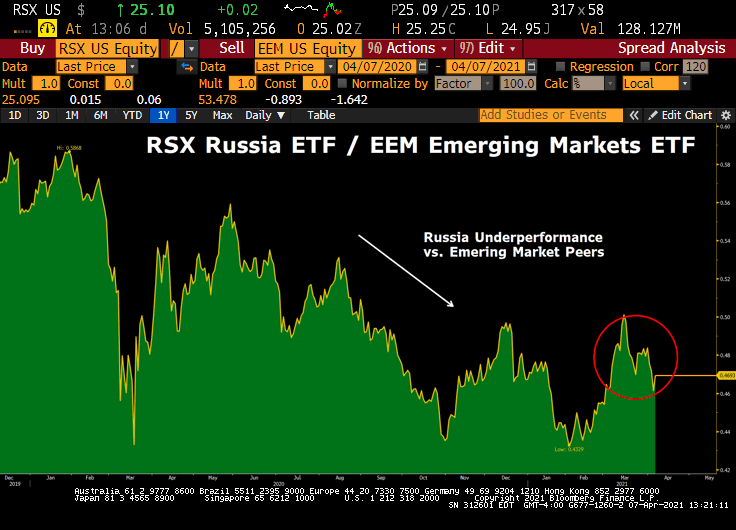 Clearly, some Ukraine – Russia conflict is being priced in here. Notice the recent under-performance of RSX Russian equities relative to the mothership EEM.
Trump Biden – Putin Xi
Again, neither Putin nor Xi made a move during the Trump administration. Why? Why did they treat each meeting with Trump officials respectfully? Why did Chinese diplomats dump all over Biden’s team in Alaska, in over the top, disgracefully so fashion? Well, Putin, Xi, and Trump are all bullies, and above all unpredictable. Think back to a playground in grade school. Bullies don’t pick on bullies. Bullies pick on snowflakes. In Biden – Putin and Xi see a weak old man in decline, a figurehead for an Obama third term of a country that itself is in decline, laden with debt, riven by internal strife, and sick of war. Realistically, what would the U.S. do if Russia made a military move on Eastern Ukraine? Nothing. And if China saw that, Taiwan would be at serious risk.
The Life of a Super-Power in Decline
During the reign of Marcus Aurelius, emperor of Rome from 161 AD to 180 AD, the omnipotent stoic philosopher spent much of his time on military expeditions along the Danube, containing German incursions. In 387 AD the first German hordes crossed, never to leave. In 410 AD the city of Rome was sacked. In 487 AD the Western Roman Empire fell. Europe wouldn’t achieve its earlier economic prosperity for 1000 years. There are literally over 200 reasons listed by scholars for Rome’s fall, but certainly among the most important is that Rome had debased its currency to pay debts, and stretched its military too long beyond its limits. Meanwhile, farmers were cutting off their thumbs to evade the military draft. No thumbs: no spear throwing, no sword-wielding. Sure, the Roman West scrounged up a strong emperor from time to time (Aurelian, ruled 270 AD to 275 AD), but then a string of weak ones would follow hard thereupon. Meanwhile, the Germans were mastering Roman military tactics, and gaining wealth from trade with Rome. And always testing Rome for any military weakness. Finally, when Rome was at its weakest, the Germans faced incursions into their own eastern flank and poured into Western Europe. And now, here we are.
Russia Forex Ruble Under-Performance
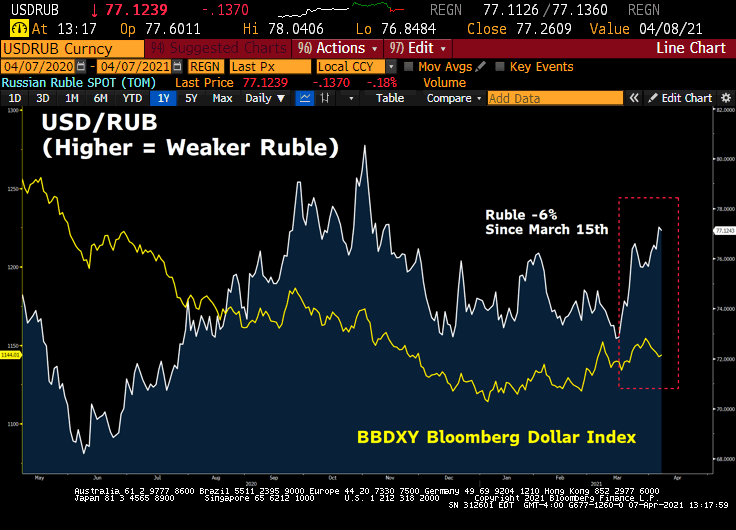 At the Bear Traps Report, we are always looking for clues – across asset classes – to validate or invalidate the constant and often obnoxious stream of news in the daily – weekly cycle. Credit risk is all-important, but a glance in the direction of currency volatility – the price someone is willing to pay for a bet in one direction or another – is a key measuring stick to monitor. Notice above how much weaker the ruble has traded recently relative to the broad, Bloomberg Dollar Index.
Testing and Probing
Today, Russia and China are continually testing and probing the U.S. for weakness, just like the Germans did Rome. Occasionally, we vote in a bully. But half of our population finds that unbearable. So we vote in a doddering weakling in the name of normalcy and decency. And that’s fair. But Putin will push. For sure. Then Xi will push. For sure.
America will fail that double test, most likely. If America passes the two tests, there will be more tests. For sure. That’s just the nature of the game. The risk-reward is never perfect but looks pretty good right now from Putin’s and Xi’s points of view.
Some of our best relationships were in Kiev for the Orange Revolution. There was vast protesting on Independence Square in Kiev when Kiev’s Chief of Police walked on to the platform and proclaimed to the crowd that the Kiev Police Department had joined the revolution. He shouted, “We are with you!” The moment was electric. Everyone knew the tide had turned in favor of the Revolution. Cheers of joy waved through the crowd. An unbelievable moment of exhilaration.
The Dnieper River is Ukraine’s longest and Europe’s fourth, rising in Russia and spilling into the Black Sea. It is well known since ancient times: Herodotus describes it in his Histories. And it cuts Ukraine down the middle, effectively resulting in three Ukraine’s: the Crimean peninsula, Western Ukraine and Eastern Ukraine. It is well known that years before his annexation of Crimea, Putin approached Poland with the following proposal: you take Western Ukraine and I’ll take Eastern Ukraine. The Polish government was shocked, but this has given a lasting impression of Putin’s strategic goals in the region.
Eastern Ukraine is much more Russian. Western Ukraine is much more Ukrainian, far more European. It was Western Ukraine that drove the Orange Revolution. When the government wanted to strengthen its hold, our friends witnessed busloads of Eastern Ukrainian thugs, heads shaved and donning long black leather jackets everyone, dumped around the perimeter of Independence Square. They were scarier than the tanks that were already there. But in the event, they were bought off with vodka and weren’t much of a factor. The Eastern Ukrainians were skeptical and indifferent. The Western Ukrainians were enthusiastic, and Kiev, passionate. The Orange Revolution prevailed.
But then the new government became corrupt as many had predicted. And that did anger Western Ukrainians because they were left out of the action. So the new government fell to the old government. But that was unacceptable to the US. So the old government fell again leaving the current mess: Crimea gone, the East in low-grade conflict, and the West sullen and demoralized.
It is a pleasant coincidence for Putin and Xi that Hunter Biden has business “experience” in Ukraine and China.
In sum, Putin believes Eastern Ukraine is ripe for the plucking, but that Western Ukraine is closed to him. When should he take the East? Now or wait for the US to elect another bully, perhaps reelect Trump himself? Now is the time. Strike while the iron is hot.
Meanwhile, Xi views it as his manifest destiny to take Taiwan. Unlike Vietnam, which does have a minority Chinese population, Taiwan is really and truly Chinese. And it is hard to square a visionary goal of China being the single greatest dominant power on earth if it can’t even “take back” Taiwan. So if Xi sees Putin consolidate Eastern Ukraine, the pressure on Xi to consolidate Taiwan will prove irresistible.
Niall Ferguson and the Taiwan Relations Act
Ferguson’s depth and work on this subject is second to none. To Niall’s point, the act states that the U.S. will consider “any effort to determine the future of Taiwan by other than peaceful means, including by boycotts or embargoes, a threat to the peace and security of the Western Pacific area and of grave concern to the United States.” It also commits the U.S. government to “make available to Taiwan such defense articles and … services in such quantity as may be necessary to enable Taiwan to maintain a sufficient self-defense capacity,” as well as to “maintain the capacity of the United States to resist any resort to force or other forms of coercion that would jeopardize the security, or the social or economic system, of the people on Taiwan.”
And perhaps none of this would matter much to markets, a couple of 10% shakeouts, if we weren’t at highly levered all-time valuation highs, with call options being bought hand over fist as a result of forever money from the Fed.
And we notice cracks here and there in the market action even at fresh new highs: Nasdaq Biotech IBB ETF acts like death (nearly 16% off the Feb highs), ARKK Innovation ETF has $25B of new inflows now WAY underwater and the S&P 600 small-cap indices look very weak. These weak spots smell too high heaven, fewer and fewer stocks are holding up the market. The TRIN index remains cautious. The Archegos affair causing the margin to be reigned in. It’s an odd new high. Perhaps it will get better. Perhaps it will gain strength and come to look like a normal bull run. It happens.
But we have real geopolitical military risks right now that we haven’t seen since the eve of WWII. Ignore that risk at your peril. We won’t.
There is only one way to pay for war without conquest: inflation. And there is only one price to pay for running away from war: loss of power. Either scenario is bad for stock markets and good for gold.
Buy war insurance now.
We believe in the Fourth Turning. We believe our slate is about to be wiped clean. We believe in creative destruction. We believe the old order of today will fall to the new consensus of tomorrow.
But between now and then there is a crash or sequence of crashes so only one word matters: risk. And that risk is not currently being discounted by the markets.
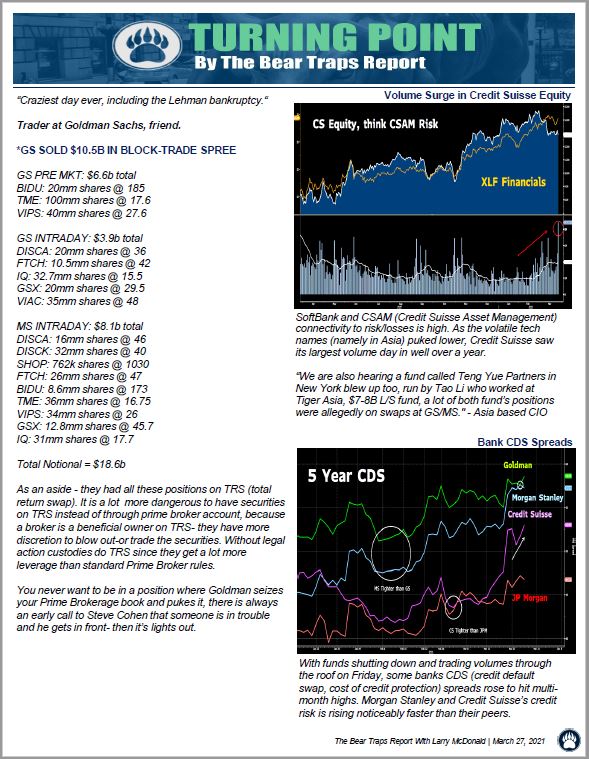 The epic sale of stock in the Archegos unwind (see above) will leave a dark stain on Wall St. for years to come. The Credit Suisse mess is larger than what’s priced into the market. It’s NOT a Lehman size failure but they will be forced into asset sales (CSAM), and or a size rights offering. It’s beyond sinful in financial terms that PB (Prime Broker) risk across the street has such a disgusting lack of transparency. All of this will force a “come to Jesus” for the Street’s compliance departments and force a meaningful de-leveraging. Then come the regulators and House / Senate hearings. Keep in mind, this same problem went down in January with Robinhood, they could NOT properly and efficiently quantify counterparty risk during the trading-day and were forced into a capital raise. So, Q1 2021 will be forever marked by a period of reckless risk-taking breaking the system.
 Our Larry McDonald, author of a “Colossal Failure of Common Sense”, and Andrew Ross Sorkin of “Too Big to Fail” fame –
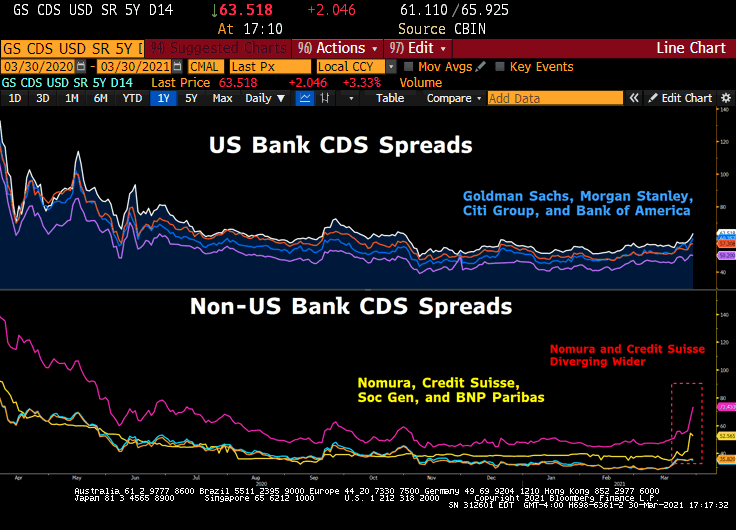
  All the signs were there Friday. Banks with credit risk tied closest to hedge fund blow-ups dramatically underperformed.
 Friday’s volume was pointing to some real issues. In recent weeks as the Lex Greensill debacle sucked more oxygen out of the air, CS equity has been dramatically underperforming. Institutional clients in our live chat were asking this week if Nomura’s pain is $2-4B, doesn’t that put CS in the $6-8B range? Any capital issues for the bank? Do they have to start de-risking or seek to raise more capital? All at quarter-end? With $275B of risk-weighted assets by the end of 2020 and a 12.5 CET1 ratio, this equals $34.375B capital. Clients we trust see a high risk of impairments.
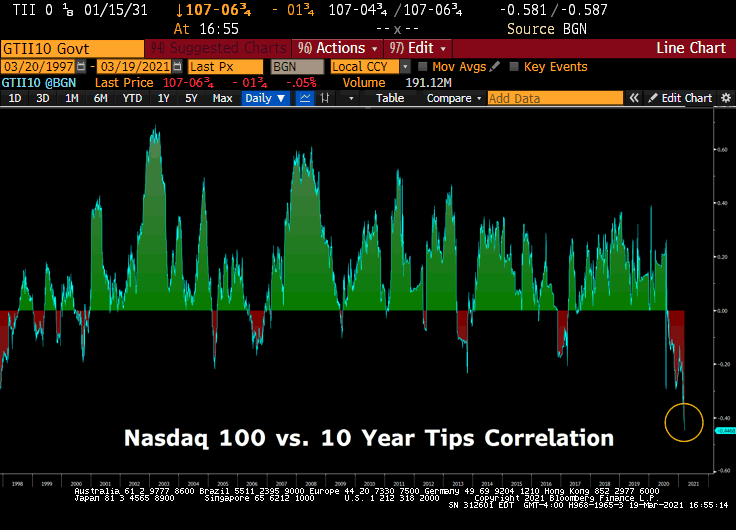 A colossal portion of “growth” stocks have their true worth embedded in the “net present value” of FUTURE cash flows. Thus, as bond yields and inflation expectations rise – tech stocks are worth a lot less.
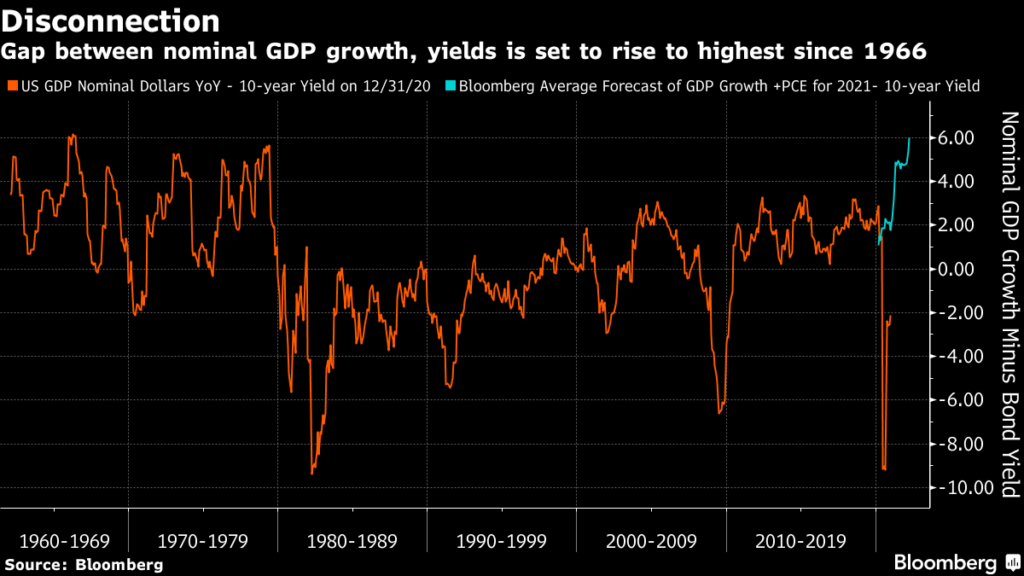 The Street is up at 6-7% 2021 GDP growth expectations. BUT, including the inflation outlook – nominal GDP growth could be nearly 10% in 2021, but comparisons get tough in 2022 with growth estimates falling below 3%.
 Gasoline is testing its five year highs and Core CPI is down. Say what? How can that be? Is the government manipulating inflation measures so it can keep its money printing presses running hot? Of course! But there’s more to the story than that. As to highly questionable lower inflation readings, it’s true. The components have changed over the decades such that if one were to calculate CPI using the 1980 formula, it would be more than twice as high as the current reading! But there is another less nefarious (or blindingly stupid) reason. An increase in gasoline prices is a tax on consumer demand. A person making $45k a year only has so much money to spend. And every dollar made is spent. So if an extra dollar goes to gas, that is one less dollar to a component of Core CPI. So higher gasoline prices take demand away from other goods and services. Higher gasoline prices exert deflationary pressure on other goods and services.
  It was the worst single day for 5s (five-year Treasuries) since 2002… What lending instruments are tied to US 5 year bond yields? FCIs are key, financial conditions will determine when the Fed comes in with YCC, yield curve control.
 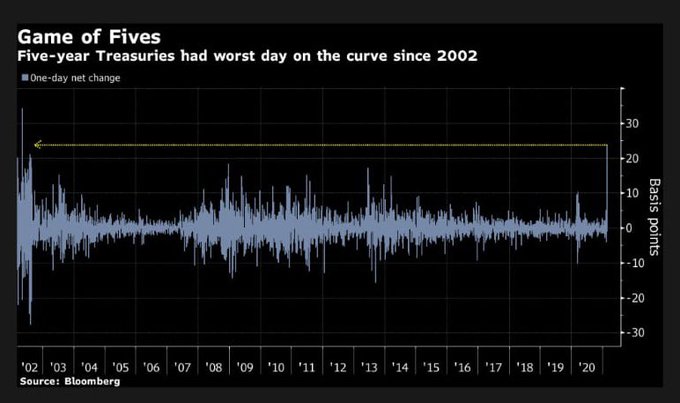 When central banks do NOT allow the business cycle to function over longer and longer periods of time – the good news is wealth creation becomes colossal. The bad news is Capital moves into crowded venues, poised for disruption. In rates, as the bond market sold off. Originally, the long end 30s was deemed at risk. Next, capital moved into 10s, 7s (10 and seven-year U.S. Treasuries), a “safe” place. As selling pressure moved into the middle part of the curve, trillions moved into the front-end looking for duration risk shelter. In recent weeks, 5s (5 year U.S. Treasuries) became the colossal hangout, a perceived “safe” place. Then the US treasury brought another* $100B for sale (5-7 year paper) this week. Anemic demand triggered the now historic, 6sd (standard deviation ) blow-up in 5s.
