*Our institutional client flatform includes; financial advisors, family offices, RIAs, CTAs, hedge funds, mutual funds, and pension funds.
Email tatiana@thebeartrapsreport.com to get on our live Bloomberg chat over the terminal, institutional investors only please, it’s a real value add.
In our global NY Times bestseller*, “A Colossal Failure of Common Sense” – there are two key points the book focuses on – risk recognition failures by the Federal Reserve and the importance of short-sellers in the marketplace.
*now published in 12 languages, over 600,000 sold.
Today, at precisely the same moment – we are once again witnessing key stress points in the financial system which can unravel very quickly. Our 21 Lehman Systemic Indicators are screaming higher. The inmates are running the asylum and the probability of the Federal Reserve breaking out their creative “macro-prudential” toolbox is the highest in years.
What is going on? For example, when five to 15 hedge funds are in trouble, all down 10-40% each in less than 30 days and they command $100B or so of AUM (assets under management) – that´s NOT the problem. The problem is – they are levered about 10-1. So these fellows actually control $1T of assets. And when the margin clerk comes walking by your desk it’s a VERY unpleasant experience on a trading floor. It´s NOT a friendly visit, especially when the risk management team has his back, NOT yours. You don´t just sell your losers, you MUST sell your winners, nearly “everything must go” to raise precious cash.
Here lies the problem with central bankers. Academics are often clueless about systemic risk, even when it´s right under their noses. The history books are filled with these lessons. Very quickly the Fed will scream ¨there is NO problem, all is well, stay in your seats, ladies, and gentlemen.” After a rude awakening, they realize, “oh, we do have a problem.”
This is when happens when you bail out the bad actors in March, just ten months later the leverage comes back VERY quickly.
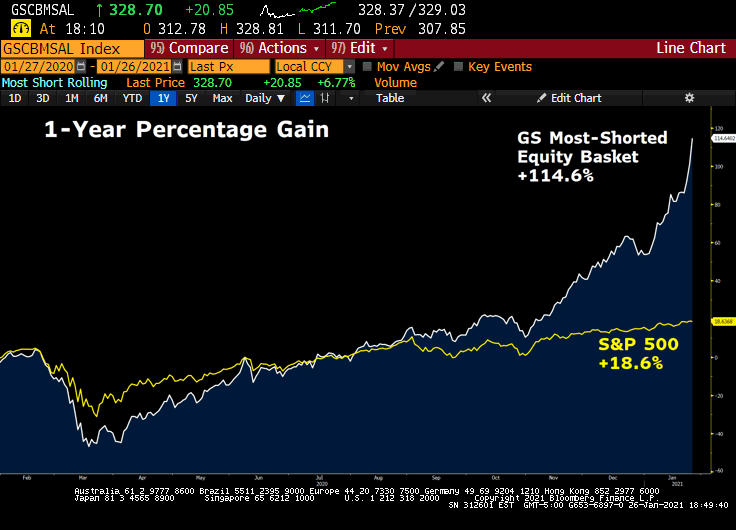
Looking forward, U.S. central bankers are no longer Trump constrained, the banking system is strong but the equity market has far more in common with Steve Wynn (Vegas) than Warren Buffett (Omaha). We think the Fed (and SEC) sends a shot over the bow very soon. Our social justice, inequality embarrassed Fed is not happy. They will not taper but they can make serious threats to risk-takers. All the signals are there; we have an explosion of SPAC / IPO issuance, $850B of margin debt or 75% above 2015 levels, the most shorted equities up 75% vs. 16% for the S&P 500 since October (bulls running over bears), record-high call vs. put volume with the little guy leading the charge, SELL Mortimer Sell. The risk-reward is atrocious from a long perspective in U.S. equities. Unless the Federal Reserve acts quickly and decisively, we will crash, the destruction will be of epic proportions. Central bankers have a chance to arrest out-of-control animal spirits, they MUST act now.
Companies Outed by Short Sellers
Enron
Wirecard
Sunbeam
Lehman
Worldcom
Madoff
Cendant
Tyco
*In a world of state-controlled central bank liquidity, message boards, and leverage; who are we actually protecting? How many Bernie Madoffs, how many Bernie Ebbers will be running around the Hamptons this Summer?
The Problem of 2021 – The Fed’s Macro Pru Risk Tools are designed for 2008, not 1999
In our live chat on Bloomberg, several Institutional Clients are talking up a Possible macro-pru Fed Adjustment, Central Bank Action. Warning, beware…
Bailout Alert: *CITADEL, POINT72 TO INVEST $2.75 BLN IN MELVIN CAPITAL
Comments from Our Live Institutional Chat on Bloomberg
The bailout of Long Term Capital Mgmt LTCM: $3.6B.
The bailout of someone short $GME: $2.75B.
*According to usinflationcalculator.com, that $3.6B bailout in 1998 is equivalent to $5.72B today. The bailout that saved the world was $5B now look at us.. $1 trillion “isn’t enough.”
CIO West Coast: “ I think mkt is really scary when a $13bn hf can be down 40%+ a few weeks into the year and asking for bailouts.”
CIO East Coast: “ Classic Fed, wrong macropru toolbox. What did citadel securities do in revenue? $6.7bn? I’ll bet 60% of that drops straight to the bottom line. We have an Option vol seller (Citadel) + buy-side (point 72) deploying a Reddit fire hose, comedy”
CIO Hedge Fund NYC: “I remember 1999 well. I think this is now at least as crazy. The GME squeeze is quite a doozy. I think the short-selling community is pretty destroyed. “
What Triggered the Bailout? It’s similar to the SoftBank whale gamma squeeze.
A) Large herd of organized players buys large amounts of upside calls on stocks with the greatest % short interest.
B) Option traders getting lifted in SIZE, have (MUST) to buy stock to hedge all the incoming call buyers.
C) As option buyers buy the stocks GME, BB, BBBY etc, this triggers short squeeze as % of the float (actual shares outstanding) is very small, short interest is HIGH. Compared to the 1990s, the options ease of use is 10x more accessible today, cheaper commissions (they are paying, just don’t see it) today as well. Message boards (Reddit), a social element similar to the 1990s. So the options angle triggers more of a gamma squeeze with a larger, more mobilized herd. Next, Elon Musk and VCs pile on the action.
Impact: On Wednesday morning, Nasdaq witnessed two inter-day bearish reversals of 2.7% and 1.8% this week. The VIX touches 200d (27.45) first time since election day. It would later touch 37.
A Bull-Raid on Short Sellers
 Think of the 1990s mob taking out famed short-seller Julien Robertson vs. the 2020 mob trying to attempt the same thing, now think Genghis Kahn vs. Atila the Hun innovation, mobilized, organized leverage.
We are Looking at more Macro-pru fix Incentive Fuel for the Fed!!!
Market extremes always force a policy response, oftentimes in Bear markets with March 2020 the shock and awe moment of all time. But what about a colossal bull market perch… covered in froth?
WHAT ARE MACROPRUDENTIAL POLICIES? AND HOW DO THEY DIFFER FROM MICROPRUDENTIAL POLICIES?
With Lehman Brothers in mind, macroprudential policies are financial policies aimed at ensuring the stability of the financial system as a whole to prevent substantial disruptions in credit and other vital financial services necessary for stable economic growth. The stability of the financial system is at greater risk when financial vulnerabilities are high, such as when institutions and investors have high leverage and are overly reliant on uninsured short-term funding, and interconnections are complex and opaque.
For the first time in four years, we are looking at an FOMC without Trump constraints. More importantly, they’re wearing the inequality dunce cap sitting in the corner. After a decade of fueling gross inequality, central bankers are out to prove their innocence as newfound social justice warriors.
The problem, looking over the list of the Fed’s macro-prudential tools – most are bank balance sheet related, that’s not where the problem is. Over the last hundred years, after each financial crisis, there has been a unique metamorphosis, a transformation into another serpent, a far different beast. If the Fed has learned anything, this time the focus must be on stock market leverage, margin requirements, etc. It´s far more 1999 than 2008. If Alan Greenspan could go back in time, what macropru tools should he have used in the dotcom era?
Mobs vs. Shorts
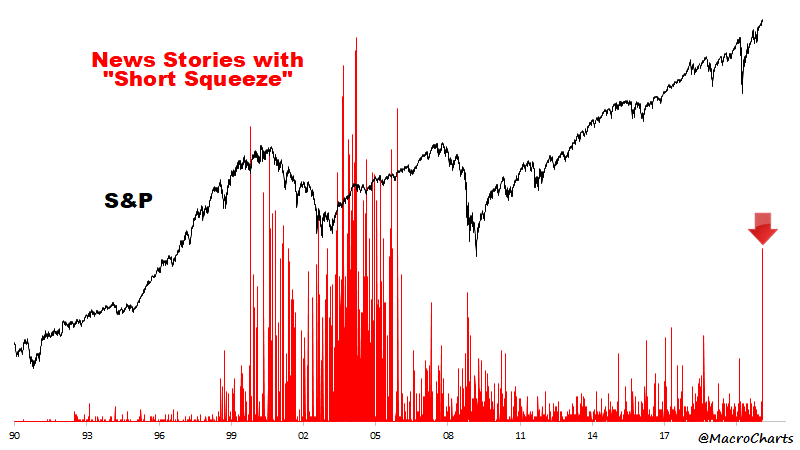 Good one from MacroCharts… In our view, mobs have been taking out shorts for decades, NOW they use tactical nuclear weapons (mob-induced option leverage), vs. more primitive methods in the 1990s.
How Times Have Changed
The bailout of Long-Term Capital Management LTCM: $3.6 billion*
The bailout of someone short $GME: $2.75 billion
*Fourteen financial institutions recapitalized LTCM with $3.6B: Bankers Trust, Barclays, Chase Manhattan, Credit Agricole, CSFB, Deutsche, Goldman, JPM, Merrill, Morgan Stanley, Paribas, Salomon SB, SocGen, UBS.
The latest buzzword is “macroprudential” as in macroprudential regulation. It’s basically means be more conservative, or save a penny for a rainy day. The idea is to institute laws and rules in order to avoid systematic risk, the risk of the collapse of the entire financial system. Policymakers and their research analysts are warming to the view that regulating in anticipation of collapse is better than after collapse. However, no regulator has ever correctly foreseen a financial collapse, even recognized it as it began under their very noses. Like generals, they always fight the last war. At best they invent new tricks for an old game.
The macroprudential thought has actually been around quite a while, in England, where the term was first coined in the 1970s. It only became less obscure, however, after the Bank for International Settlements took up the banner in the early 2000s. It came truly into its own after the late-2000s financial crisis, or the global financial crisis, in the wake of what in retrospect has been deemed as excessive risk-taking by banks given the popping of the housing bubble in the US.
So macroprudential regulation is an effort to reduce the risks of financial instability. It is viewed as optimally complimentary to macroeconomic policy and microprudential rules for financial institutions.
The important point from this history lesson is that macroprudential policy never evolved out of the collapse of the dotcom stock market bubble. It is a bank or banks-to-markets mindset. Instinctively, it views any risk as curable by treating it as in essence bank risk. So if markets are at risk for non-bank reasons, macroprudential policy may still address it, but that would involve a new mindset developing new policies and new tools.
Now to review macroprudential policy as it currently stands. Macroprudential concern divides into three categories: the agency paradigm, the externalities paradigm, and the mood swings paradigm, with most of the focus on the last two.
In the agency paradigm, principal-agent problems (where one person can make decisions for another, but not always in the latter’s best interests) are the focus. So those who run a bank may care more about their own pay than the best interests of the bank’s shareholders or society at large. Imagine! The fear is that as lenders of last resort, the Fed thereby emboldens bank heads to take undue risks. This is a moral hazard, which in economics means the incentive to increase risk at someone else’s expense. Because of the individual actor’s nature of such risk, the macroprudential policy usually focuses on the other two paradigms.
In the externalities paradigm, the main focus is mainly on pecuniary externality which occurs when an economic actor’s decision affects the welfare of another economic actor. For instance, if a lot of suburban dwellers buy apartments in the city as second dwellings, that can drive up the prices of urban apartments, negatively impacting the ability of young urbanites to purchase apartments. The macroprudential view is that when price distortions caused by lack of perfect competition occurs, policy intervention is the cure. Which is stupid. How can an economist, or government employee, determine perfect competition? What criterion would government hacks use? What prejudices and hidden agendas would affect their determinations? A world where no one is worse off no matter what choices are made by others is a pipe dream. The view seems to be that over-borrowing, excessive risk-taking and excessive levels of short term debt deserve macroprudential regulation because market failures hurt the real economy. Meanwhile the 1987 crash and zero impact on the real economy. But now banks have 52% loans to deposits, the lowest and most conservative in half a century! A classic case of developing a cure for a disease that has gone away.
As for the mood swings paradigm, keying off Keynes’s animal spirits idea, the thought is that there are moments of excessive optimism during which money managers tend to ignore risk. This means that price signals lose value and this leads to systemic crisis. So theoretically macroprudential regulation would curb such optimism. Of course, this is exactly the opposite of the current monetary policy. Ahem.
Thus, the concern over macroprudential regulation is really a fancy way of worrying about when the Fed and other regulators change their collective mind and turn off the money spigot.
So how would a macroprudential regulator monitor systemic risk in the first place? One way is to monitor balance sheets. In the case of large banks, these are superb. In the case of small businesses and individuals, as a result of lockdowns, these are disastrous and too late to repair. Another proposed monitor is to look at interconnectedness risk. But it is safe to say that the economy and markets are highly integrated and making them less so at any point in any way for whatever reason carries with it a high degree of risk.
Other measures to monitor risk include credit to GDP and monetary assets such as M1 growth, but of course, the response to lockdowns of Central Banks has been to inflate those metrics. Real asset prices as a measure of potential systemic risk is a joke given that Central Banks are deliberately inflating them, at least so it would seem if one simply observes their behavior. Stress tests of course have been used and, to be fair, for all their flaws, seem to have had some positive impact.
Assuming that policy geeks can identify risks beforehand, which is questionable (isn’t the definition of a dangerous risk one that can’t be foreseen???), what tools are available to reduce identified risks?
Correcting loan to value ratios might be one, but for the fact they are currently the most conservative in over a generation. And this was done by the banking industry voluntarily. Some CLOs have stepped in where banks have feared to tread, true, but no one views them as globally systemically important (yet).
Another macroprudential tool is controlled through debt to income measures, but by all appearances, as a result of the pandemic, these have been thrown by the wayside.
A levy on non-core assets would restrict banks’ ability to wander too far afield. The counter-argument is this reduces their diversification and thereby increases risk.
Countercyclical capital requirements would restrain desperately risky lending by soon to be troubled lending institutions. However, it is difficult to ignore the irony of governments who would never dream of imposing countercyclical measures on themselves. It was Adam Smith who noted centuries ago that emergency monies borrowed by governments temporarily were never repaid. Still too true to this very day.
Penalties for excessive short term funding, charges on maturity mismatches, penalties for insufficient liquidity ratios, and haircuts on asset-backed securities valuations are further macroprudential tools, none of which have any present relevance to currently overfunded global banks. In the US, banks have $6.6 trillion in deposits that cost 6 basis points to maintain, $115 billion in actual cash, $3.3 trillion in securities most of which government-issued, and about $3.4 trillion in loans. Hard to see the systemic risk there.
Further, more junior capital for banks is a basic macroprudential tool, and has already been implemented.
Basel III is in fact often enough macroprudential in outlook. Capital requirements, for example, have been strengthened, capital buffers are in place.
Pro-cyclical dynamic loss provisioning and time-varying minimum capital requirements are basically fancy names for saving pennies for a rainy day, only in this case the pennies are billions, and, while adjusting for time frames, basically means hoarding cash while you can get it and before you need it. While macroprudential, these measures are also anti-growth and ultimately makes the task of growing out of economic inequality impossible. Besides, after the existential crisis of the late-2000s, banks are if anything too risk adverse, and the pandemic has only confirmed them in their ways.
In essence, then, “macroprudential” just means “conservative”.
The management of systemic risk in the USA is in part institutionalized in the guise of the Financial Stability Oversight Council, created in 2010.
The non-coordination of macroprudential policy and monetary policy is detrimental to both.
While theoretically, they should complement each other, in fact, they are inherently at odds in the very times of crisis each seeks to avoid in opposite ways. Macroprudential regulation is conservative in its essence. Monetary policy in times of crisis is fundamentally a printing press. The one restricts as the other expands.
Current fiscal policy and government backing of loans are together meant to maintain personal spending and reward business risk-taking behavior. How to compliment fiscal policy and monetary policy to macroprudential regulation is more of a mystery than a revelation.
In any case, it may all be besides the point. If the main systemic risk is the current equity bubble, it is hard to see how making banks still more conservative will help.
All current macroprudential regulatory tools are geared to solve the last crisis, not the oncoming crisis. Besides, the easiest way to pop the current equity bubble is to raise initial margin from 50% to 60% and maintenance margin from 30% to 40% under regulation T. One doesn’t need the regulatory and intellectual baggage of macroprudential policy to pop a bubble. It’s not a secret.
The most likely scenario, in our view, is louder discussion of macroprudential regulation with everyone very concerned about what it all means. What it all translates into is good old fashioned jaw-boning asset prices lower, an oft practiced method, that can in fact prove effective in overstretched and overvalued markets such as ours now.
Solutions, Reg T
Two points about ending the bubble macroprudentially: the reason why changing regulation T would pop the bubble is because a mere pinprick pops a bubble! It is true changing reg T isn’t much of a big deal compared to options volumes. Changing reg T, compared to options flows, is a mere pinprick. But that’s all you need to pop a bubble. Secondly, it is empirically the case that heavily shorted stocks are targets in today’s world. That story moderates if margin requirements increase. Again, just a pinprick. What is so satisfying from the Fed’s point of view about tightening margin requirements is precisely the fact that isn’t a big thing. It’s just an adjustment. A second lure for the Fed is that it is easily reversed. A third lure is that if it doesn’t work, there is no immediate major harm either.

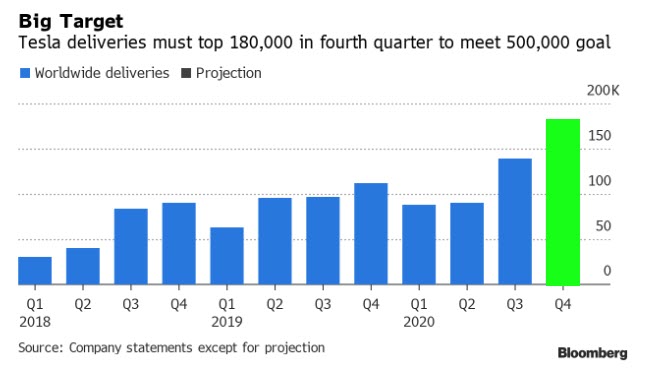 “Tesla says its goal of delivering 500,000 cars this year “has become more difficult”: it has to deliver a record 180,000 cars this quarter.” Zerohedge
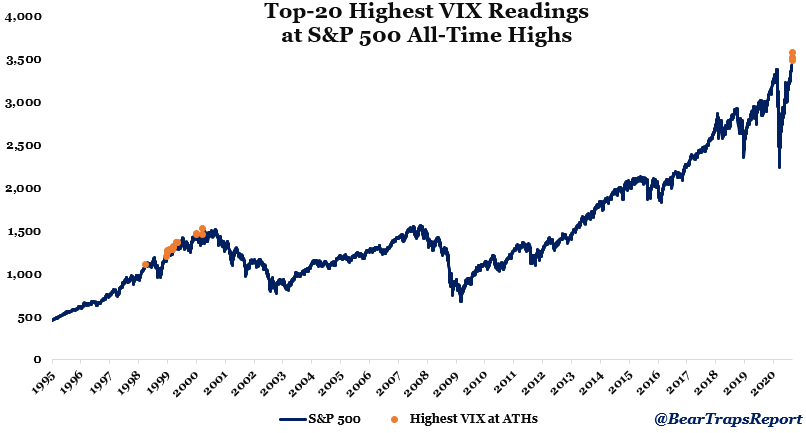
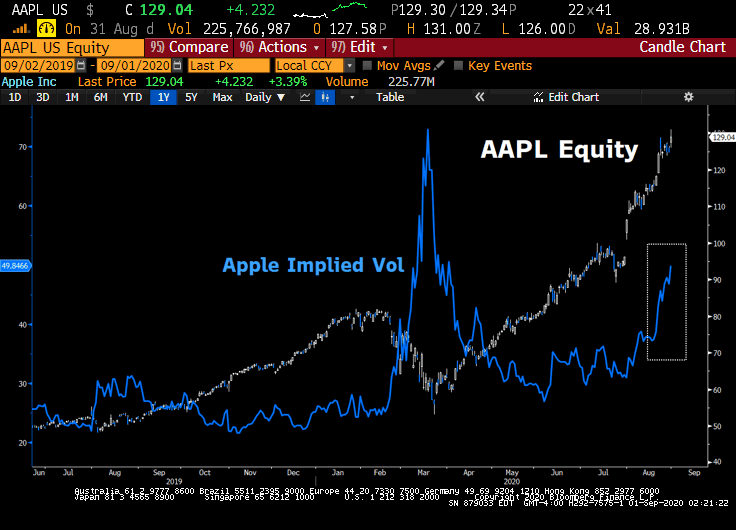 Call it extremely unusual activity. We have a higher stock price in Apple AAPL with a much higher cost of equity upside. Equity vol usually explodes higher in market crashes, NOT bull markets. As you can see above, in normal Apple equity bull markets – see all of 2019 – AAPL implied vol has been CHEAP, NOT RICH (expensive) like today! In March and April, near the market bottom – the price for puts was more than 4x the price for calls, today we have done a 180, extreme fear to extreme greed.
 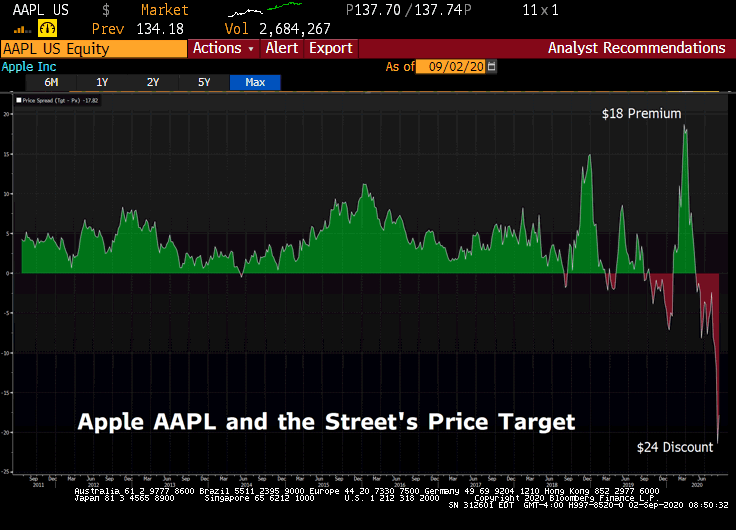 Apple $AAPL is near $140 pre-market on September 2nd. In July, the Street’s 12-month price target was $85, now $116. In March, the price target commanded an $18 PREMIUM to the Apple stock price,
 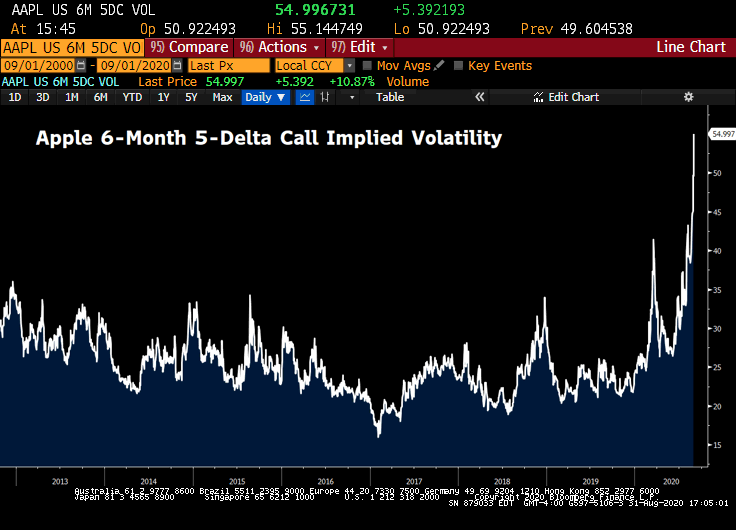 There are a handful of quant funds pushing around a few stocks (with high impact on QQQ, NDX, SPY) in the options markets. The dealers are getting very nervous. Last 15 days – Imaging being a large market maker in Apple and Tesla equity options. You make a market, bid – offer, you get lifted and lifted over and over again by buyers to the point where you have raised the price of calls vs puts to multi-year extremes. How short is the Street gamma? VERY.
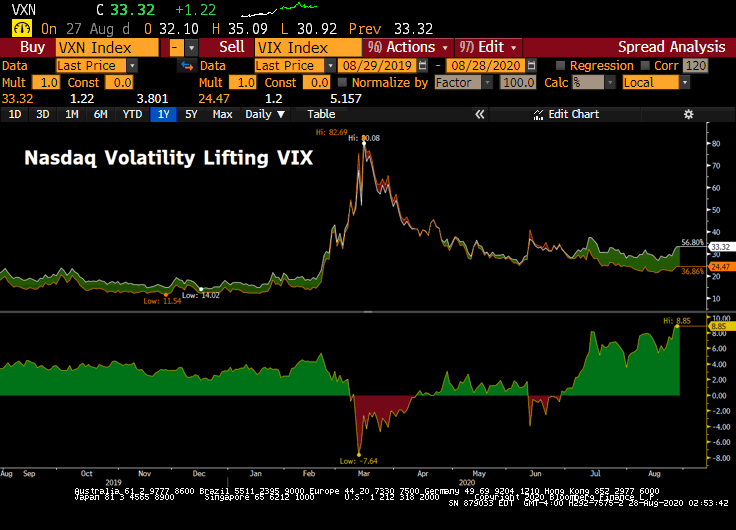 With the Nasdaq QQQs up close to 40% this year, there are lots of gains to protect. Nasdaq vol has been trading very expensive relative to the VIX. Investors are paying up for protection.
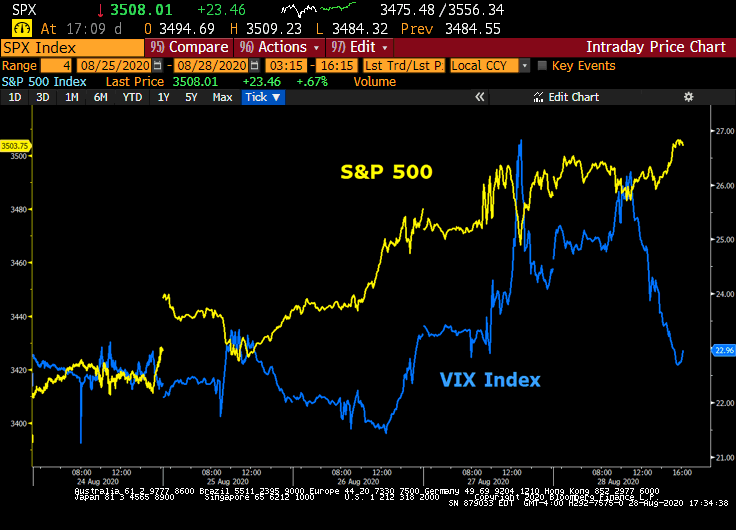 On Wednesday and Thursday this week, the Chicago Board Options Exchange’s CBOE Volatility Index (VIX) was more than 5% higher each day, with the S&P 500 up both of those days. How rare is this? Very. We could only find ten days in the last decade with the S&P up 1% with the VIX closing higher. This is especially rare with the market at all-time highs. In a healthy bull market at its best levels, the VIX should be in the low teens, NOT the lows 20s.
 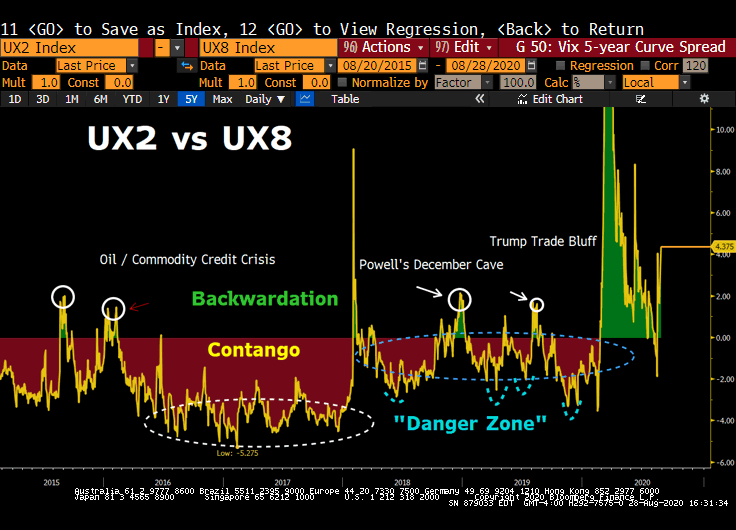 One of our 21 Lehman Systemic Risk Indicators are found in the trading spread between the two and 8-month VIX futures options contracts. To keep this as simple as possible, all we are doing here is measuring the cost of protection. How much more expensive is buying short term vs. long term insurance? The above data is mindblowing. This week, the cost to buy the two-month VIX future reached nearly 5 handles more than the eight-month contract. Elephants leave footprints. When large hedge funds need or want to pay-up for short term protection from a market crash that is one thing, BUT the price they are paying this week is VERY extreme with a market at all-time highs. As you can see above, the 2-8 spread is wider today than nearly every financial panic in the last five years. In a healthy, “risk-on” (where risk is being put on) bull market – this spread should be in “contango” – the two-month VIX futures contract should be ALOT cheaper than the 8-month variety.
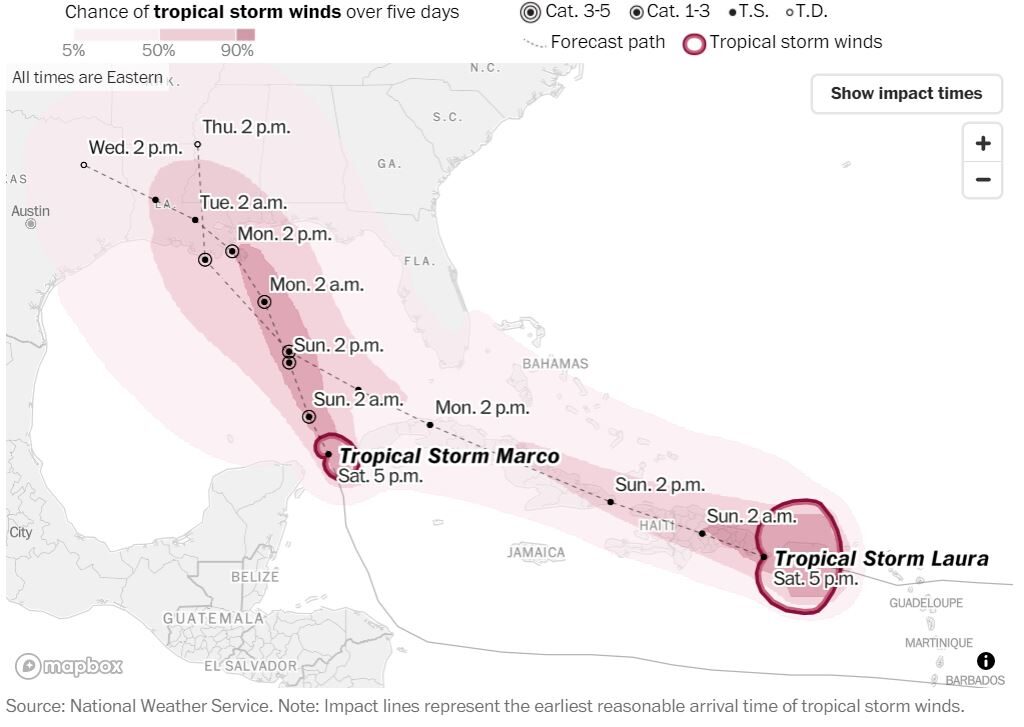
 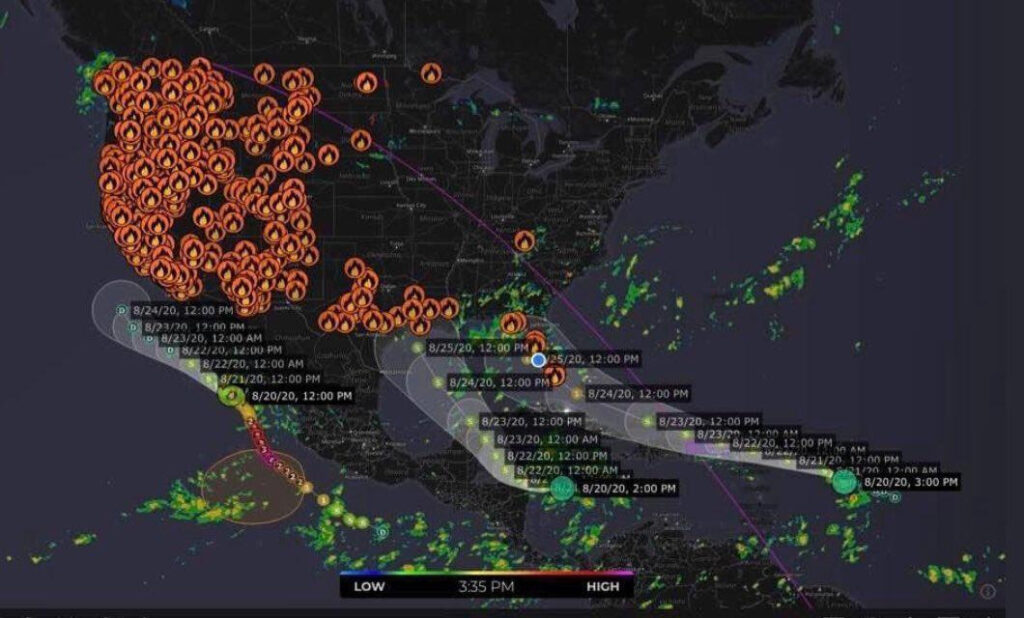 “The models are showing something unprecedented this morning, two storms make landfall within 24 to 36 hours in essentially the same spot.”