Join our Larry McDonald on CNBC’s Trading Nation, Wednesday at 3:05pm ET
Pick up our latest report on China here:
Don’t miss our next trade idea. Get on the Bear Traps Report Today, click here“A cab driver will tell you Tesla is barely profitable. Most know it has a market capitalization similar to that of the world’s leading premium car makers; BMW and Daimler, who made $14B and $18B last year, respectively. The company has burned through $13B of capital over the last decade, yet it trades at 3x BMW and 7x Porsche EV/EBITDA multiple. Tesla has thrived, in large part due to ubiquitous subsidies as well as wide open capital markets. Thanks to obnoxiously accommodative central banks, an easy money gravy train has allowed this levered beast to issue more than $11B in high yield and convertible debt in the last few years. Bottom line, in a normally functioning business cycle (capital market formation) without central bank interference, the company would NOT exist in its present form. With over $750B of U.S. high yield and investment grade (leveraged loans) bond maturities in 2019 and a Fed reducing its balance sheet (QT) to the tune of $50B a month – tightening financial conditions will be the noose around Tesla’s neck.”
Bear Traps Report – January 2019
Washington Policy Will be Driving the Tesla Bus in 2019
Tesla’s best friend over the past decade has been the U.S. Government and Elon’s (Musk) beloved tax credits for manufacturing electric vehicles. In 2009, President Obama signed the American Clean Energy and Security Act, stipulating that EVs produced after 2010 were eligible for a tax credit up to $7,500. In his 2011 State of the Union address, he pledged $2.4B in federal grants to support the development of next-generation electric vehicles and batteries.
In January, we released a major theme-report on the Electric Vehicle industry and Tesla, find out more here.
The End of Subsidies?
These tax credits were designed to have a time limit – a financial benefit (to Tesla) acting as a melting ice cube. Per the plan, after manufacturers hit the 200,000 Electric Vehicles sold mark, their tax credits would begin to phase out. Tesla was the first manufacturer to enter the phase-out at the beginning of this year, while General Motor’s phase-out began on April 1st.
“The fate of efforts to extend the electric vehicle tax credit are most likely tied to the fate of tax extenders legislation—legislation which is very much in doubt because of divisions among House Democrats, which include, among other disagreements, whether to offset the cost of reauthorizing expired or expiring tax credits (so-called “tax extenders” legislation). The Senate Finance Committee, under the leadership of Chairman Chuck Grassley (R-IA) is less inclined to offset the costs of the tax legislation.”
ACG Analytics – April 10, 2019
Tesla Equity
 Tesla stock price is on the bottom end of a sustained trend channel, as investor’s optimism slowly dwindles. However, “proposed” legislation could be the boost the equity needs to bounce off nearby support – as long as it moves quickly trhough Congress.
Join our Larry McDonald on CNBC’s Trading Nation, Wednesday at 3:05pm ET
Pick up our latest report on Electric Vehicles here:
Don’t miss our next trade idea. Get on the Bear Traps Report Today, click hereProposed Legislation
This week our associates in Washington have a very insightful update. In an institutional research note, ACG Analytics made the point that new legislation has been introduced with bi-partisan support for extending the tax credit wall an additional 400,000 vehicles with a slightly smaller credit of $7,000. We have an important view on the likelihood of legislation passage here, see our full report here.
Tesla 2019 EPS Estimates
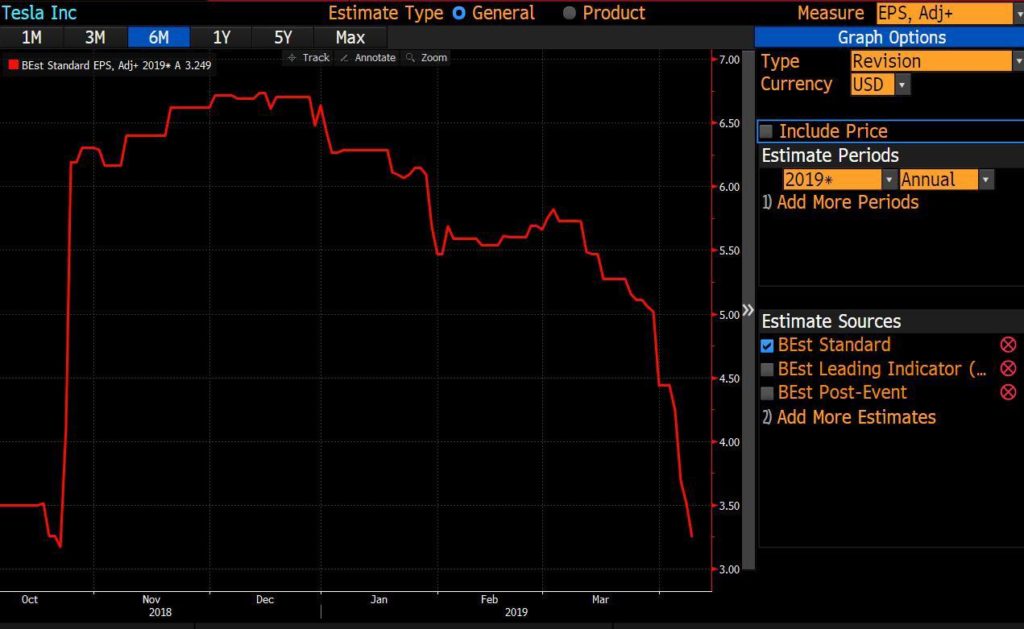 This year’s earnings expectations for Tesla have crashed down from their fantasy levels. At the beginning of the year EPS expectations were over $6.00 for the year, now they have fallen over 40% to near $3.25. Expectations slid due to increased competition in Europe and the company not hitting bullish delivery estimates – the loss of tax credit did not help their bottom line.
Implications
If the “proposed” legislation were to quickly* pass through Congress and is signed by the President, it could have large benefits for Tesla’s equity as the stock price has reflected the reality that their customers were no longer receiving thousands per vehicle from the U.S. Government.
An additional 400,000 electric vehicles on top of the existing 200,000 cap gives each manufacturer 600,000 to sell with tax credits. However, Tesla has already sold 375,000 vehicles in its history and is expected to do 300,000 more by YEAR END.
Across the street, estimates were cut after disappointing Quarter 1 deliveries. We believe Tesla should deliver roughly 339,000 vehicles by year-end (~77k thus far). Back in January, some Street estimates were as high as 400,000. However, this would leave them with limited tax-credit-worthy vehicles IF successful legislation is delayed until the end of 2019 or beyond.
Keep in mind – almost all of Tesla’s competitors will be able to reap the benefits of these tax credits for years to come. We wrote about Tesla’s incoming supply problem back in January’s bear case.
“In the mass market, Tesla’s model 3 will face an avalanche of competition from Nissan, VW, GM, the Koreans, and the French. In this table, we only highlighted the most significant launches for the US market, which is 50% of Tesla sales.”
Bear Traps Report – January 2019
Credit LEADS Equities
 In October of 2018, Tesla reported another rare profit. After 8 quarters of mounting losses, shorts were once again caught on the wrong foot (as you can see above – red circle). Why the sudden turnaround? Unlike almost any other mass car producer, Tesla delivers from their order book. With Model 3 production (finally) at adequate levels, Tesla first started delivering the top range Model 3s, which often go for ~$55K vs a $35K base price. To exemplify, Tesla makes an estimated $3,500 operating profit on the $45K version while it loses some $3,900 on the base Model 3. This is how Tesla showed a rare profit in Q3. Keep in mind, Tesla didn’t just turn profitable, it also showed positive cash flow – or more pain for shorts. This was mainly due to reversals in working capital and tax credits. All this came as huge surprise to the market and the stock ripped higher, as short sellers once again rushed to cover. We MUST look at the Tesla credit (5.3s due 2025). In late October / early November as the stock soared, Tesla’s junk bonds were NOT buying the price action in the equity and lost 4 points (early November to late December)! Sure enough, a few weeks later the stock caught up with the bonds on the downside.
Let us know if you are interested in the detail behind the potential legislation – email tatiana@thebeartrapsreport.com .
Join our Larry McDonald on CNBC’s Trading Nation, Wednesday at 3:05pm ET
Pick up our latest report on China here:
Don’t miss our next trade idea. Get on the Bear Traps Report Today, click here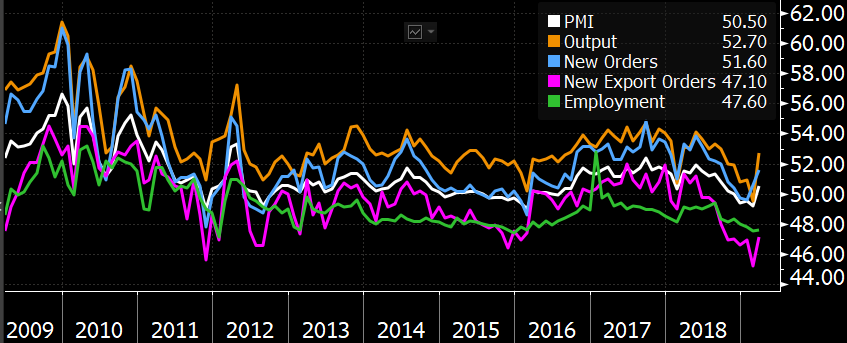 In Q4 2018, China threw a substantial amount of fiscal and monetary weaponry at its weakening $13T economy. Heading into the trade negotiating climax with the USA, we believe tax cuts and PBOC RRR (levels of reserves in their banking system) activity – all together – come to over $500B of stimulus. Three months later, those desperate measures are showing up in the data.
 We’re seeing a Major trend breakout oil on the heals of the China PMI bounce – bullish wedge.
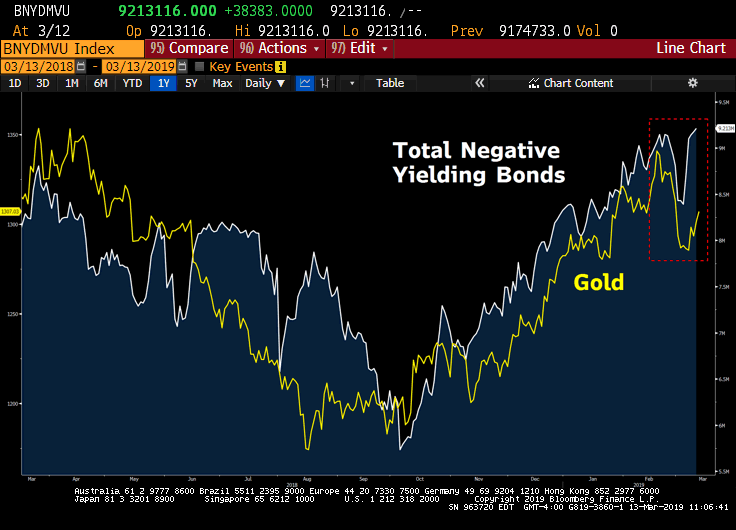 In Q1 2019, the global economy’s struggles have powered the tally of negative yielding bond on earth to near $10T. Economic data out of China this weekend will likely turn this ship around.
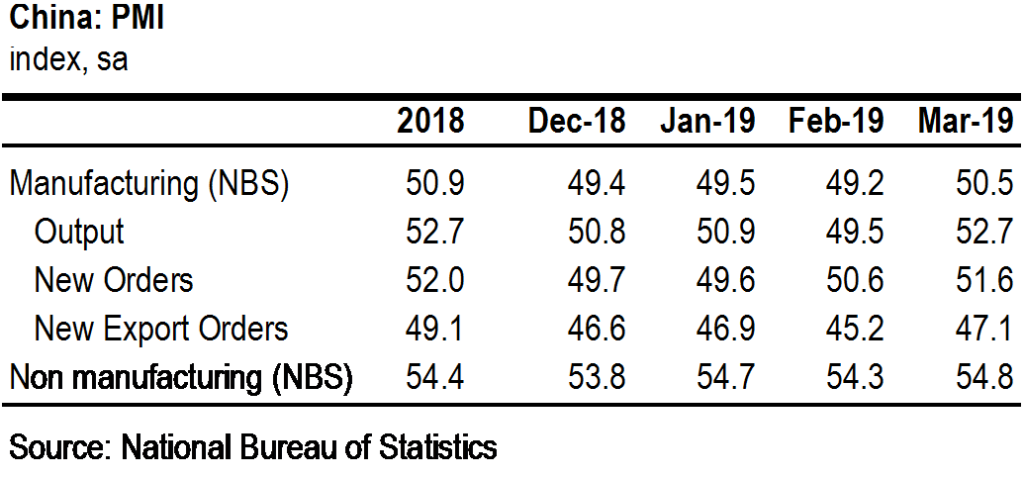 China March official composite PMI +1.6pts to 54 driven by manufacturing +1.3pts to 50.5 and non-manufacturing +0.5pts to 54.8. Could partly reflect lunar near year holiday distortions but also likely reflects the impact of China stimulus measures. “A Positive sign for Chinese and global”growth,” says AMP Capital. China delivered good news for global investors this weekend. This year, the country’s struggling demand had weighed on sectors such as auto producers and commodity exporters, worldwide – especially Germany. Likewise, with tariffs and uncertainty about whether a deal with the U.S. will be signed weighing on trade and no sign of a rebound in domestic consumption yet, there is still some work to be done in terms of getting more “buy-in” from the global investment community.
 In its largest surge since 2012, China’s manufacturing purchasing managers index rose to 50.5 from 49.2 last month, exceeding all estimates by economists – the consensus was looking for 49.6. In better news, new orders and new export orders – leading indicators which signal future activities, popped up to the highest levels in six months. Keep in mind, Germany’s economy and bond yields have a very high beta to China’s economic fortunes. As you can see above, over the last 5 years lows in German bond yields have been closely tied to periods where China’s Manufacturing PMI struggles. This speaks to HIGHER global bond yields in the days and weeks to come – a bounce is long overdue.
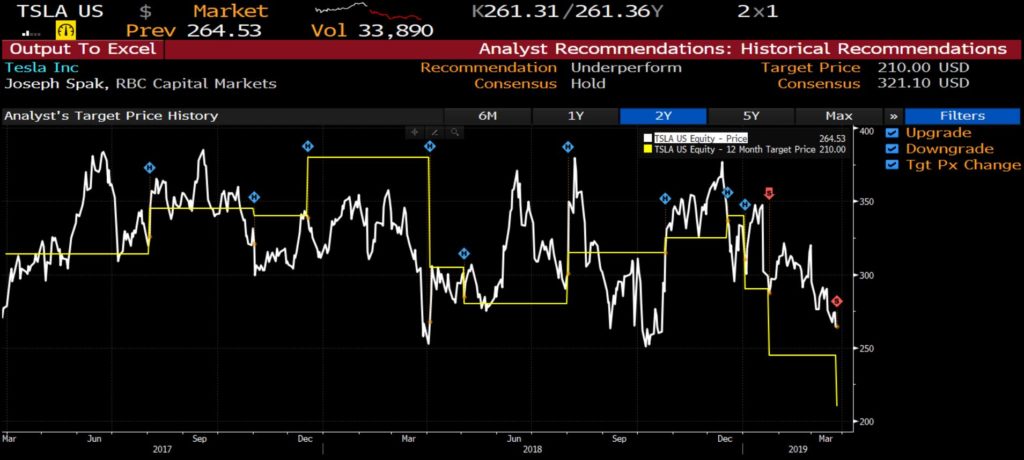 RBC Capital Markets lowers its 12-month price target on shares of Tesla amid softer demand expectations and a delivery snag in China – new target is a 14 percent reduction to his prior forecast and implies more than 20 percent downside over the next year from Friday’s close. “We see both 2019 and 2020 revenue as down vs. the 4Q18 run-rate and, given Tesla is priced for growth, believe the valuation will come in” –
  Japan led off this week where US equities closed out last, in the red. The 3% plunge is equivalent to 765 dow points.
 In recent years, U.S. equities in the economically sensitive consumer discretionary XLY sector have substantially outperformed consumer staples XLP (82.6% vs. 47.9% over the last five years total return). Since June 2018, the world has changed – staples XLP have had their day in the sun (red channel above). During Friday’s 500 point swoon in the Dow Jones Industrial Average, the XLY was 2% lower – while defensive equities in the XLP were unchanged – a sign of things to come. What’s the connection here between what bonds and equities are telling us?
 When Fixed Income markets start to price in a cap on near term / intermediate term bond yields, floating rate securities begin to dramatically under-perform (bank loans BKLN).
 Since October, the 2-10s US Treasury curve has flattened from 34 to 11bps. Since March 18, the XLF Financials ETF has plunged nearly 7%, the KBW Nasdaq Bank Index of large lenders posting its biggest one-week slide since 2016, off 10.6% since Tuesday – all with the staples XLP up 1%. Sure, we all know banks’ earnings power struggles with a flat curve and the follow on pressure on net interest margins. But, is this downdraft in the financials simply a product of a flattening yield curve? Or is something more ominous afoot?
 Yields on U.S. investment-grade bonds have plunged to the lowest in more than a year.
 German 10-year bonds were up at 0.57% in October, they touched -0.01% this week – their lowest yield since 2016. The last time bond yields in Europe were this low the ECB was buying $60 to $80B a month of asset purchases vs. just $5 to $10B today.
 We have an economist (above – white line) that’s actually worth listening to. As you can see above – going back 30 years – well before U.S. recessions, consumer staples dramatically outperform consumer discretionary stocks. When we take a close look at a recession-proof sector like the staples XLP ETF vs. a sector with a high degree of economic sensitivity, consumer discretionary XLY – we come up with eye-opening data. Notably, this ratio has historically rolled over before yield curve inversions as well. Historically, yield curve inversion only confirms what Stan’s economist is already telling us. For our full report, join
 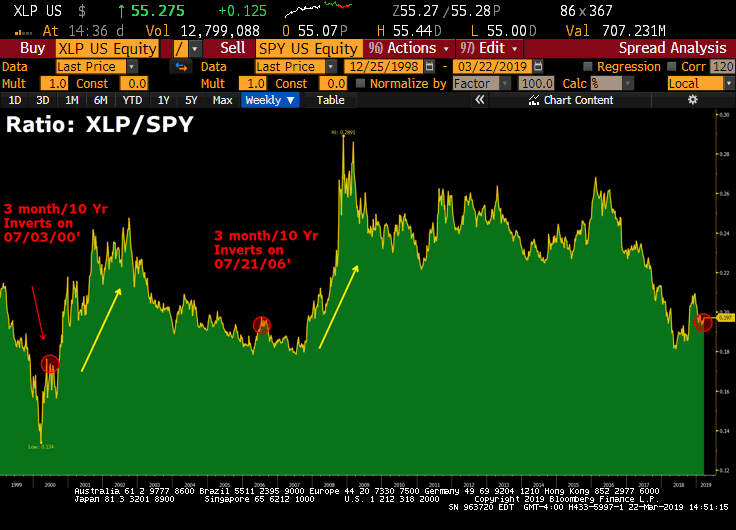 Since 1990, the 3 Month / 10 Year yield Curve has inverted twice. During 2000 to 2002 and from 2006 to 2008. Staples outperformance was substantial in these periods.
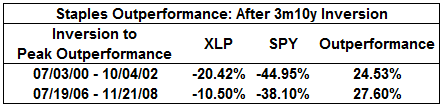 Above, is the peak to which staples outperforms the S&P 500 post-inversion. If it was a fight, they’d stop it. In a late cycle, post “yield curve inversion” regime, investors want to be overweight consumer staples – and underweight the S&P 500. Bottom line, the key lessons from previous cycles must be listened to:
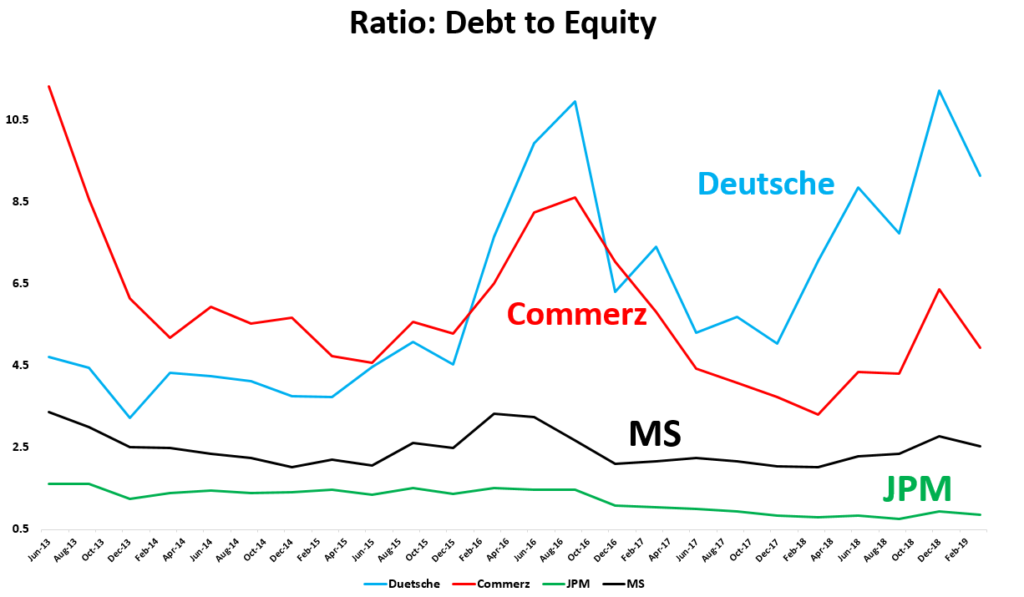
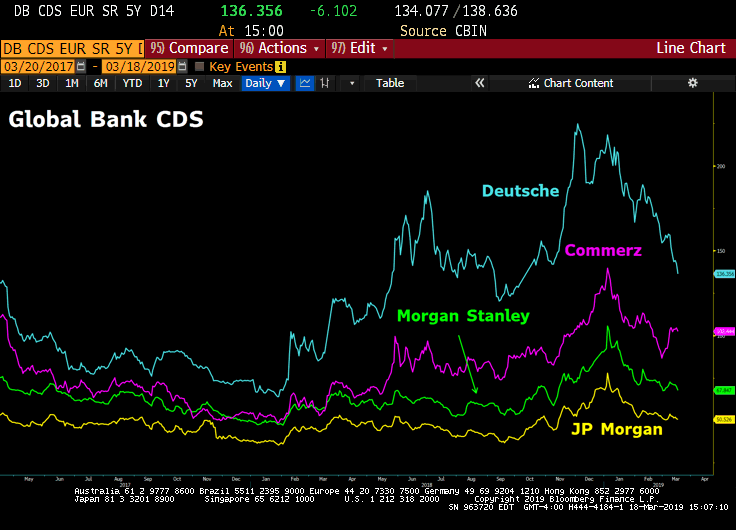 Credit risk in Europe has tightened substantially since the beginning of the year. However, the CDS in Deutsche and Commerzbank remains well above the banks in the US.
  Our Larry McDonald with hall of fame historian Niall Ferguson in Manhattan Friday. The Debt Jubilee, see our latest sit down on Real Vision
  We often tell clients, “credit leads equities.” Even more important, tightening financial conditions (FCIs) drive Federal Reserve policy movements, NOT lagging economic data. Nearly every economist in the U.S. was calling for 2-3 rate hikes back in October / November – even as financial conditions were tightening at the fastest pace since 2015. By focusing on FCIs, in late Q3 2018, we were able to position clients in a basket of “Fed Pause” trades (emerging markets, energy, gold) – this thesis has played out beautifully.
 The very latest reading of the core PCE index, rose 0.19%, its largest monthly gain since May. Prices for services, more sensitive than goods to domestic labor supply / wages, surged 0.29% – the largest jump in nearly 15 months. It’s also interesting to note how much bonds have rallied with sharply lower yields in U.S. Treasuries, while core PCE inflation is still up meaningfully over the last 18 months and NOT giving up any ground (see the white circle above).
 Just when the Street gave up on reflation and the rate cut camp started to overflow – bonds put in the most significant sell-off since Q2 2018 in recent days. It’s looking more and more like China hit the panic button heading into the trade negotiations. They were dealing from a position of weakness with an economy reeling from the sharpest global slowdown in decades. The mountain of fiscal and monetary policy actions they’ve taken is nothing short of remarkable. RRR cuts, tax cuts, infrastructure spending splurge. Looks like an $800B boost to the German economy 🙂 – maybe global synchronized growth will appear on stage after all?
 Economic boost: This will help Xi’s team sitting across the table from Uncle Bob (U.S. trade hawk) Lighthizer.
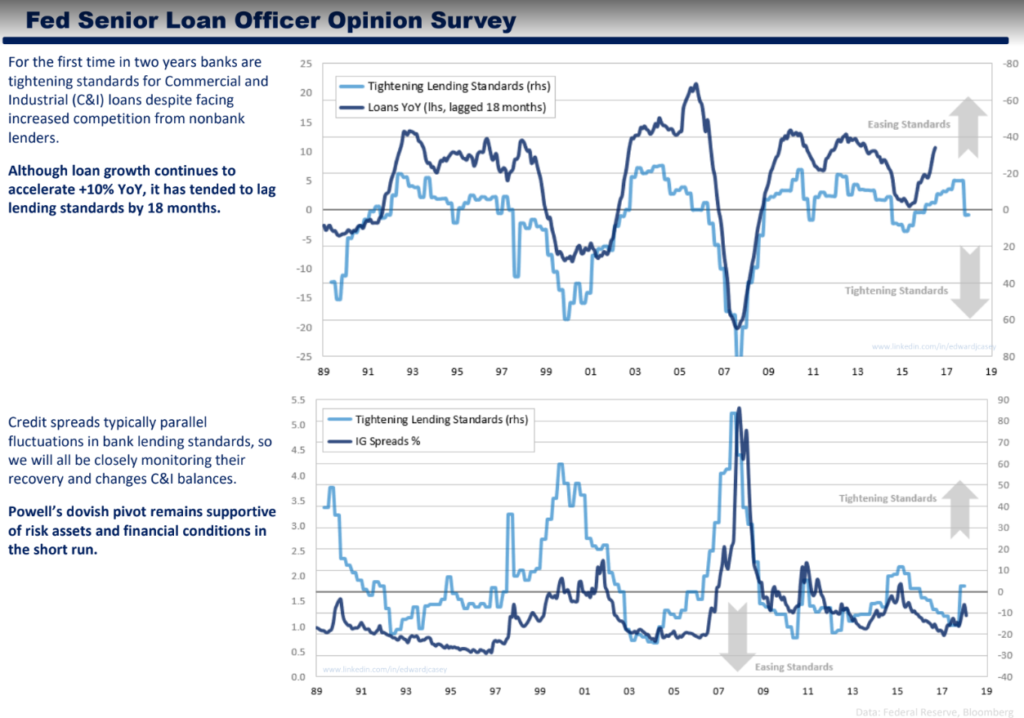
 The CDX IG is the most followed measure of corporate credit conditions in the U.S., we’re looking at the credit spreads on large investment grade companies above. As you can see, credit conditions tightened dramatically, and then the senior loan officer survey caught up with what the CDX IG was telling us weeks earlier. The Fed pays close attention to the loan survey data above, unfortunately, it takes forever to compile the STALE data. The survey above is the most recently available, as of January 31, 2019, but the actual engagement with loans officers was compiled in Q4. The white line above is telling you current credit conditions are easing, and easing fast relative to the now “out of date” C&I loan survey data.